Several groups of scientists are using two large datasets to analyze impacts of invasion by non-native tree-killing pests. The first dataset used is official Forest Service monitoring data from the Forest Inventory and Analysis (FIA). These data are collected on a “rolling” annual basis from 130,210 forest plots in 2,098 counties in the 48 conterminous states. (Go here to learn more about FIA.)
The second dataset covers the distribution of non-native forest pests and is contained in the Alien Forest Pest Explorer database, also a Forest Service product.
Some of these studies (those led by Kevin Potter) have been carried out under the auspices of “Project CAPTURE” (Conservation Assessment and Prioritization of Forest Trees Under Risk of Extirpation) as part of a multi-partner effort to categorize and prioritize US tree species for conservation actions based on the threats and the trees’ ability to adapt to those threats. Partners include North Carolina State University; Forest Service Forest Health Protection, Southern Research Station, and forest health monitoring program; Eastern Forest Environmental Threat Assessment Center; and the Forest.Health program.
Here I highlight several key studies that use FIA data to examine:
1) the relationship between the diversity of forest tree species and the number of non-native insects and pathogens established there;
2) the mortality rate of forest trees due to non-native pests; and
3) impacts i in the form of “geographic hot spots;”
4) application of these findings to setting conservation priorities.
1. Impact of Host Diversity on Pest Establishment
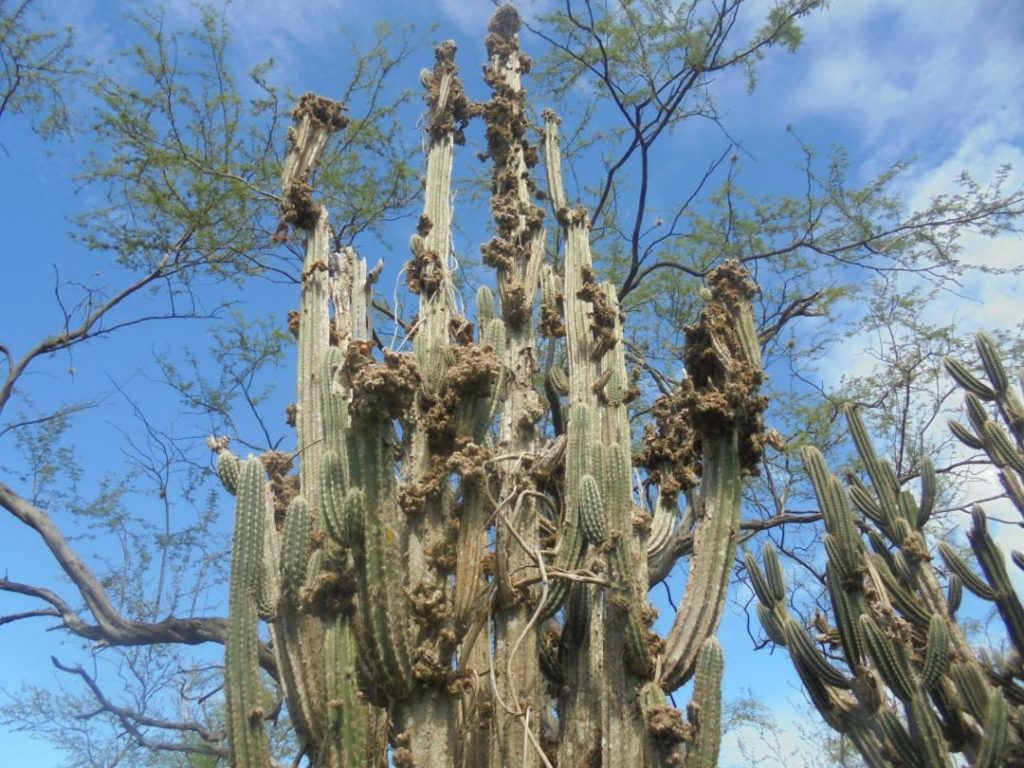
One group of scientists (Guo et al.; reference at the end of this blog) extracted distribution data for 66 non-native pests (51 insects, 15 pathogens) taken from the Alien Forest Pest Explorer database. Then, the authors compared these pest’ distributions to FIA data on the diversity of tree species in the same invaded forests — for both “host” and non-host tree species. (Guo et al. classified a tree species as a “host” only if the relevant pest was present in the county.)
Guo et al. found that the number of alien pest species established in a county increased commensurate with tree diversity – as long as that tree diversity was fairly low, i.e., below 39 tree species. The number of established pests increased particularly strongly for specialist pests. However, at higher levels of tree diversity the number of established pests fell. Another factor was the diversity of non-host tree species present. When considering generalist pests, fewer pests became established when non-host tree diversity exceeded 15 species. When considering specialist pests, that cutoff was 25 species.
Among other possible factors explaining numbers of pests established, Guo et al. also found that only propagule pressure – measured by the proxy of human population density – had a significant positive correlation with increased pest numbers.
2. Measuring the Impacts of Non-Native Pests – Tree Mortality Data
A different approach has been undertaken by Randall Morin, working with a variety of coauthors. Dr. Morin has used FIA survey data to detect whether the impact of various non-native pests can be seen in heightened levels of mortality of the pests’ hosts. I reported these findings in a previous blog.
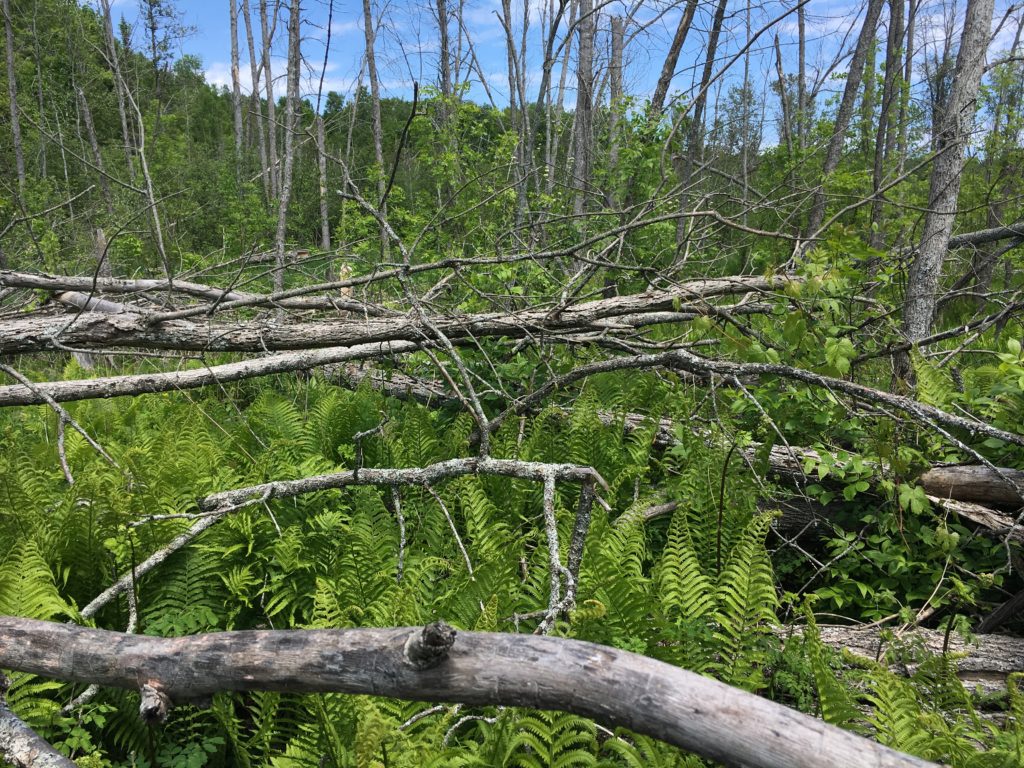
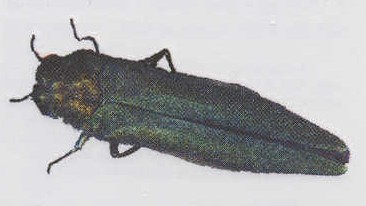
photo by Celia Boone, Nova Scotia Department of Lands and Forestry
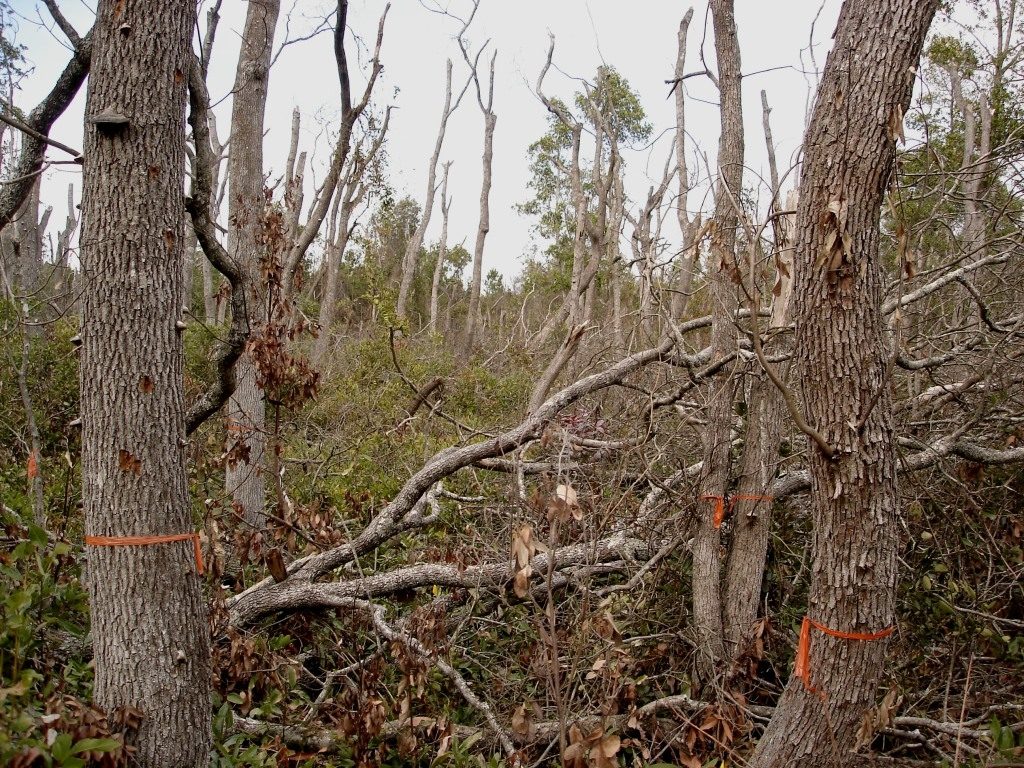
As I noted in the earlier blog, Dr. Morin found that non-native forest pests had caused an approximately 5% increase in total mortality by tree volume nation-wide. The degree to which mortality levels rose in any county depended on the killing power of the individual pest species and the relative density of tree species vulnerable to the pests present. The number or diversity of non-native tree-killing pests established in the county (see the Guo et al. study) did not determine the county’s morality level. See maps in the earlier blog.
The greatest increase in mortality rates (a four-fold increase) was for redbay, under attack by laurel wilt disease. Three-fold increases in annual mortality rates were detected for ash, beech, and hemlock. To learn the specific mortality rates for individual pest-host relationships, visit here and read the descriptions of butternut, chestnut, redbay, beech, hemlock, ash, tanoak (sudden oak death), Port-Orford cedar, oak wilt, and European gypsy moth
3.Overview of Impacts, Identification of Geographic “Hotspots” and Use in Setting Conservation Priorities
To carry out “Project CAPTURE,” Potter, Escanferla, Jetton, and Man 2019a (full reference at the end of this blog) sought to identify regions at greatest risk of significant ecological and economic impacts from damaging insects, pathogens, or parasitic plants, especially non-native, introduced pests.
They first compiled a list of 339 serious pests threatening one or more of 419 native tree species in the continental United States. The list comprised 168 diseases, 151 insects, and 20 parasitic higher plants. It included both native and introduced pests – 142 native, 55 non-native, and 142 of unknown or disputed origin.
They analyzed up to five of the most serious pests for each native tree species. This analysis resulted in 1,378 pest-host combinations.
The authors assigned a severity rating for each pest-host combination. Instead of using counties, as Guo et al. did, they evaluated pests and hosts in hexagons covering approximately 800km2. They used FIA data to determine in which hexagons each pest-host combination is present. Finally, the authors determined the “importance value at risk” (IVAR) for each hexagon based on the number of pest-host combinations present and the relative severity of those combinations. [See the article – referenced below – for detailed explanations of these calculations.]
General Findings
Analyses addressing all the pests, including native ones, found different results than analyses focused on the non-native pests. Thus, analyses of all pests found greater impacts in the West, whereas non-native pests caused potentially greater impacts in the East. The authors note that the non-native pest risk could be greatly magnified across much of the eastern United States if the alien pests are able to spread to the entirety of their hosts’ ranges.
Considering the pests:
- Of the 1,378 host/agent combinations, 51.5% involve diseases, 43.6% involve insects, and 4.9% involve parasitic plants.
- Among the insects, 77 are phloem or wood-borers, 51 are foliage-feeders, and 23 are sap-feeders. Of the total of 601 insect-host combinations (both native and exotic), borers are the agents in 224 (37%) of the combinations.
- 54% of the host tree species (228) are infested by an exotic pest – although only 28% of the 1,378 host/agent combinations involved known exotic pests.
Considering the host tree species:
- two non-native pests affect the largest number of hosts: European gypsy moth – 65 hosts; and oak wilt (Bretziella fagacearum) – 61 hosts. A third alien species, Asian longhorned beetle, ranked fourth overall with 43 hosts.
- Nearly 70% of the host/agent combinations involve angiosperm species, 30% gymnosperms. Regarding all combinations, the severity of the gymnosperm/agent combinations was significantly higher than angiosperm/agent combinations. However, when considering only non-native pests, the opposite was true: host/agent combinations for angiosperms had greater average severity.
Severity of Impacts
- Disease impacts are more severe, on average, than insect pests.
- Wood-borers are more damaging than other types of insect pests.
- Exotic agents have, on average, considerably more severe impacts than native pests.
- The risk estimate – especially for the East – is an underestimate because established pests could spread to additional vulnerable areas and there is a high likelihood that new pests will be introduced.
Of the 15 host-agent combinations with the highest severity, seven are caused by an insect, seven by a disease, one by an insect-disease complex. These 15 tree species at highest risk are:
- Florida torreya (Torreya taxifolia) – pathogen,
- American chestnut (Castanea dentata) – pathogen,
- Allegheny chinquapin (C. pumila) – pathogen,
- Ozark chinquapin (C. pumila var. ozarkensis) – pathogen,
- redbay (Persea borbonia) – disease complex,
- Carolina ash (Fraxinus caroliniana) – insect,
- pumpkin ash (F. profunda) – insect,
- Carolina hemlock (Tsuga caroliniana) – insect,
- Port-Orford cedar (Chamaecyparis lawsoniana) – pathogen,
- tanoak (Notholithocarpus densiflorus) – pathogen,
- butternut (Juglans cinerea) – pathogen,
- eastern hemlock (Tsuga canadensis) – insect,
- white ash (Fraxinus americana) – insect,
- black ash (F. nigra) – insect, and
- green ash (F. pennsylvanica) – insect.
Four host families are at the highest risk to alien pests, as measured by both the numbers of tree species affected and by the most host/agent combinations – Fagaceae (oaks, tanoaks, chestnuts, beech); Pinaceae (pines); Sapindaceae (soapberry family; includes maples, Aesculus (buckeye, horsechestnut); Salicaceae (willows, poplars, aspens). The authors point out that these families comprise the most tree species in North America and that the species are widespread.
The families under greatest threat varied somewhat when measured by the severity of the host/pest threat. While Fagaceae was still at greatest risk, and Sapindaceae was still in the top four, Ulmaceae (elms) and Oleaceae (includes Fraxinus) replaced pines and willows.
Analyses addressing all the pests found geographic “hotspots” only in the West. Analyses addressing non-native pests, based on their current extent, also resulted in Western areas appearing at highest risk. However, analyses addressing non-native pests but assuming that these pests had spread to the full extent of their hosts revealed “hotspots” in the Northeast and Great Lakes States. The Southeast is consistently a “coldspot” – clearly the near extirpation of one understory tree – redbay – is not sufficient to affect top-level data.
Note that none of the maps in the article shows all exotic pests separately from native pests; even the map in Figure 4b illustrates non-native insects only. Dr. Potter has told me that it proved too difficult to determine the origin of many pathogens (K. Potter pers. comm. April 2019).
Setting Conservation Priorities
In a second publication, Potter Escanferla, Jetton, Man, and Crane (2019b) applied the severity ranking for host-pest relationships to set priorities for conservation actions targetting the host – especially conservation of genetic diversity and implementation of programs aimed at enhancing hosts’ resistance to the pest through breeding.
They created 11 classes of species based on three factors:
- each tree species’ exposure to an extrinsic threat – as measured by the extent to which a threat could diminish a species’ adaptive genetic variation;
- each tree species’ sensitivity to the threat – as indicated by the species’ rarity, and size of range, or the degree to which a species’ total genetic resource base is susceptible to a threat; and
- each species’ ability to adapt to the pest threat – as determined by extent to which a species is unable to adapt, through micro-evolutionary change and phenotypic plasticity; unable to maintain evolutionary resilience
(These definitions are taken from Potter, Crane, and Hargrove 2017; reference below)
The highest ranked species (in three classes) are the 15 listed above.
How to Use These Data / Findings
The purpose of the CAPTURE project is to guide USDA Forest Service prioritization of forest tree species and populations for genetic conservation and monitoring efforts. It began as a response to a request from the National Forest System regional geneticist in the Southern Region (Region 8); it was then expanded to the entire country – including Puerto Rico, the Virgin Islands, and Hawai`i. (Dr. Potter told me that he has most of the data needed for Hawai`i, but is still collecting data for the Caribbean. He still needs to query experts in order to customize the framework for the two regions.)
Now that the project has set priorities for continental species, it will be interesting to see the extent to which these findings guide actual allocation of resources. For example, will additional resources be assigned to protecting such non-commercial species as Florida torreya and redbay? Will existing resistance breeding efforts – which mostly struggle to obtain funding – now have better access to funds?
The Forest.Health project – which promotes use of biotechnology to breed resistant hosts – has adopted the priority list.
Potter et al. 2019b call also for incorporating their findings into regular national reports such as those issued per the Resources Planning Act Assessment and the National Report on Sustainable Forests. These data are essential to assessing the degree to which U.S. forests can continue to meet demand for a broad range of goods and services, safeguard biological diversity, and contribute to the resilience of ecosystems and economies.
I hope that the data on regeneration, growth, and succession of individual species compiled by Morin, et al., — which are not part of the CAPTURE project — would also be included in such reports.
I applaud these studies and hope they will prove influential. They avoid some of the flaws in other priority-setting processes, which tend to focus on species with commercial value. However, I would like to suggest that some other factors should also be included in calculating priorities:
- Are some host species especially significant in their ecosystems? That is:
- Do some create unique biomes, e.g., hemlocks in stream valleys in the middle and southern Appalachians; Fraser fir (and red spruce) on southern Appalachian mountain tops; black ash in wooded swamps from Minnesota to New Brunswick; Port-Orford cedar as part of the unique flora of the serpentine soils of the Siskiyou Mountains; whitebark pine at high elevations of Western mountains.
- Are some hosts important providers of rare resources, e.g., hard mast – tanoak in California coniferous forests, beech in northern part of its range, whitebark pine at high elevations. Or calcium to the leaf litter and soil – e.g., dogwoods.
- Are particularly high numbers of faunal species associated with the host? Or rare fauna?
- Should pests that threaten entire genera – or monotypic genera – receive a higher priority? E.g., emerald ash borer threatening Fraxinus; Phytophthora ramorum threatening tanoak?
SOURCES
Guo, Q., S. Feib, K.M. Potter, A.M. Liebhold, and J. Wenf. 2019. Tree diversity regulates forest pest invasion. PNAS. www.pnas.org/cgi/doi/10.1073/pnas.1821039116
Morin, R.S., K.W. Gottschalk, M.E. Ostry, A.M. Liebhold. 2018. Regional patterns of declining butternut (Juglans cinerea L.) suggest site characteristics for restoration. Ecology and Evolution.2018;8:546-559
Morin, R. A. Liebhold, S. Pugh, and S. Fie. 2019. Current Status of Hosts and Future Risk of EAB Across the Range of Ash: Online Tools for Broad-Scale Impact Assessment. Presentation at the 81st Northeastern Forest Pest Council, West Chester, PA, March 14, 2019
Potter, K.M., B.S. Crane, W.W. Hargrove. 2017. A US national prioritization framework for tree species vulnerability to climate change. New Forests (2017) 48:275–300 DOI 10.1007/s11056-017-9569-5
Potter, K.M., M.E. Escanferla, R.M. Jetton, and G. Man. 2019a. Important Insect and Disease Threats to United States Tree Species and Geographic Patterns of Their Potential Impacts. Forests. 2019 10 304.
Potter, K.M., M.E. Escanferla, R.M. Jetton, G. Man, and B.S. Crane. 2019b. Prioritizing the conservation needs of United States tree species: Evaluating vulnerability to forest insect and disease threats. Global Ecology and Conservation. (2019)