The Virginia Invasive Plants Coalition was formed at December 2023. Seventy-six organizations participated in the formative meeting. The Coalition now boasts 113 members. CISP joined the coalition this autumn.
The Coalition’s purpose of is to identify and carry forward statewide efforts to make dramatic progress against invasive plants support the use of native plants. Members work collectively on ten initiatives:
awareness & education;
resource development;
support & implement a Virginia Invasive Species Management Plan;
create or provide expertise, incentives, and access to funds to help private land stewards mitigate invasive species
limit access to invasive plant;
research to identify & address knowledge gaps;
remove invasive plants & restore with native plants;
ensure equitable access;
build collaborative networks;
ensure that Virginia adopts policies that support reduction of invasive plants & reverse the damage they cause
I rejoice that the Coalition explicitly includes advocacy for state-level policy. I wonder whether – over time – VIPC members might consider advocating for more effective federal policies.
I also wonder whether organizations concerned about invasive species have formed similar broad and action-oriented coalitions in other states.
I will focus here on two VIPC efforts.
Virginia State Capitol; photo by Tony Fischer via Flickr
Policy
Virginia currently has two lists of invasive plants. The Department of Agriculture and Consumer Services (VDACS) lists “noxious weeds”. It currently contains 26 species in three tiers. It is illegal to sell species on this list. The Department of Conservation and Recreation (DCR) maintains the Virginia invasive plant list. The list contains 103 species. It includes a list of species identified to spur “early detection”. All noxious weeds are also included on the “invasive” list, but not all “invasive” plants are listed as noxious weeds.
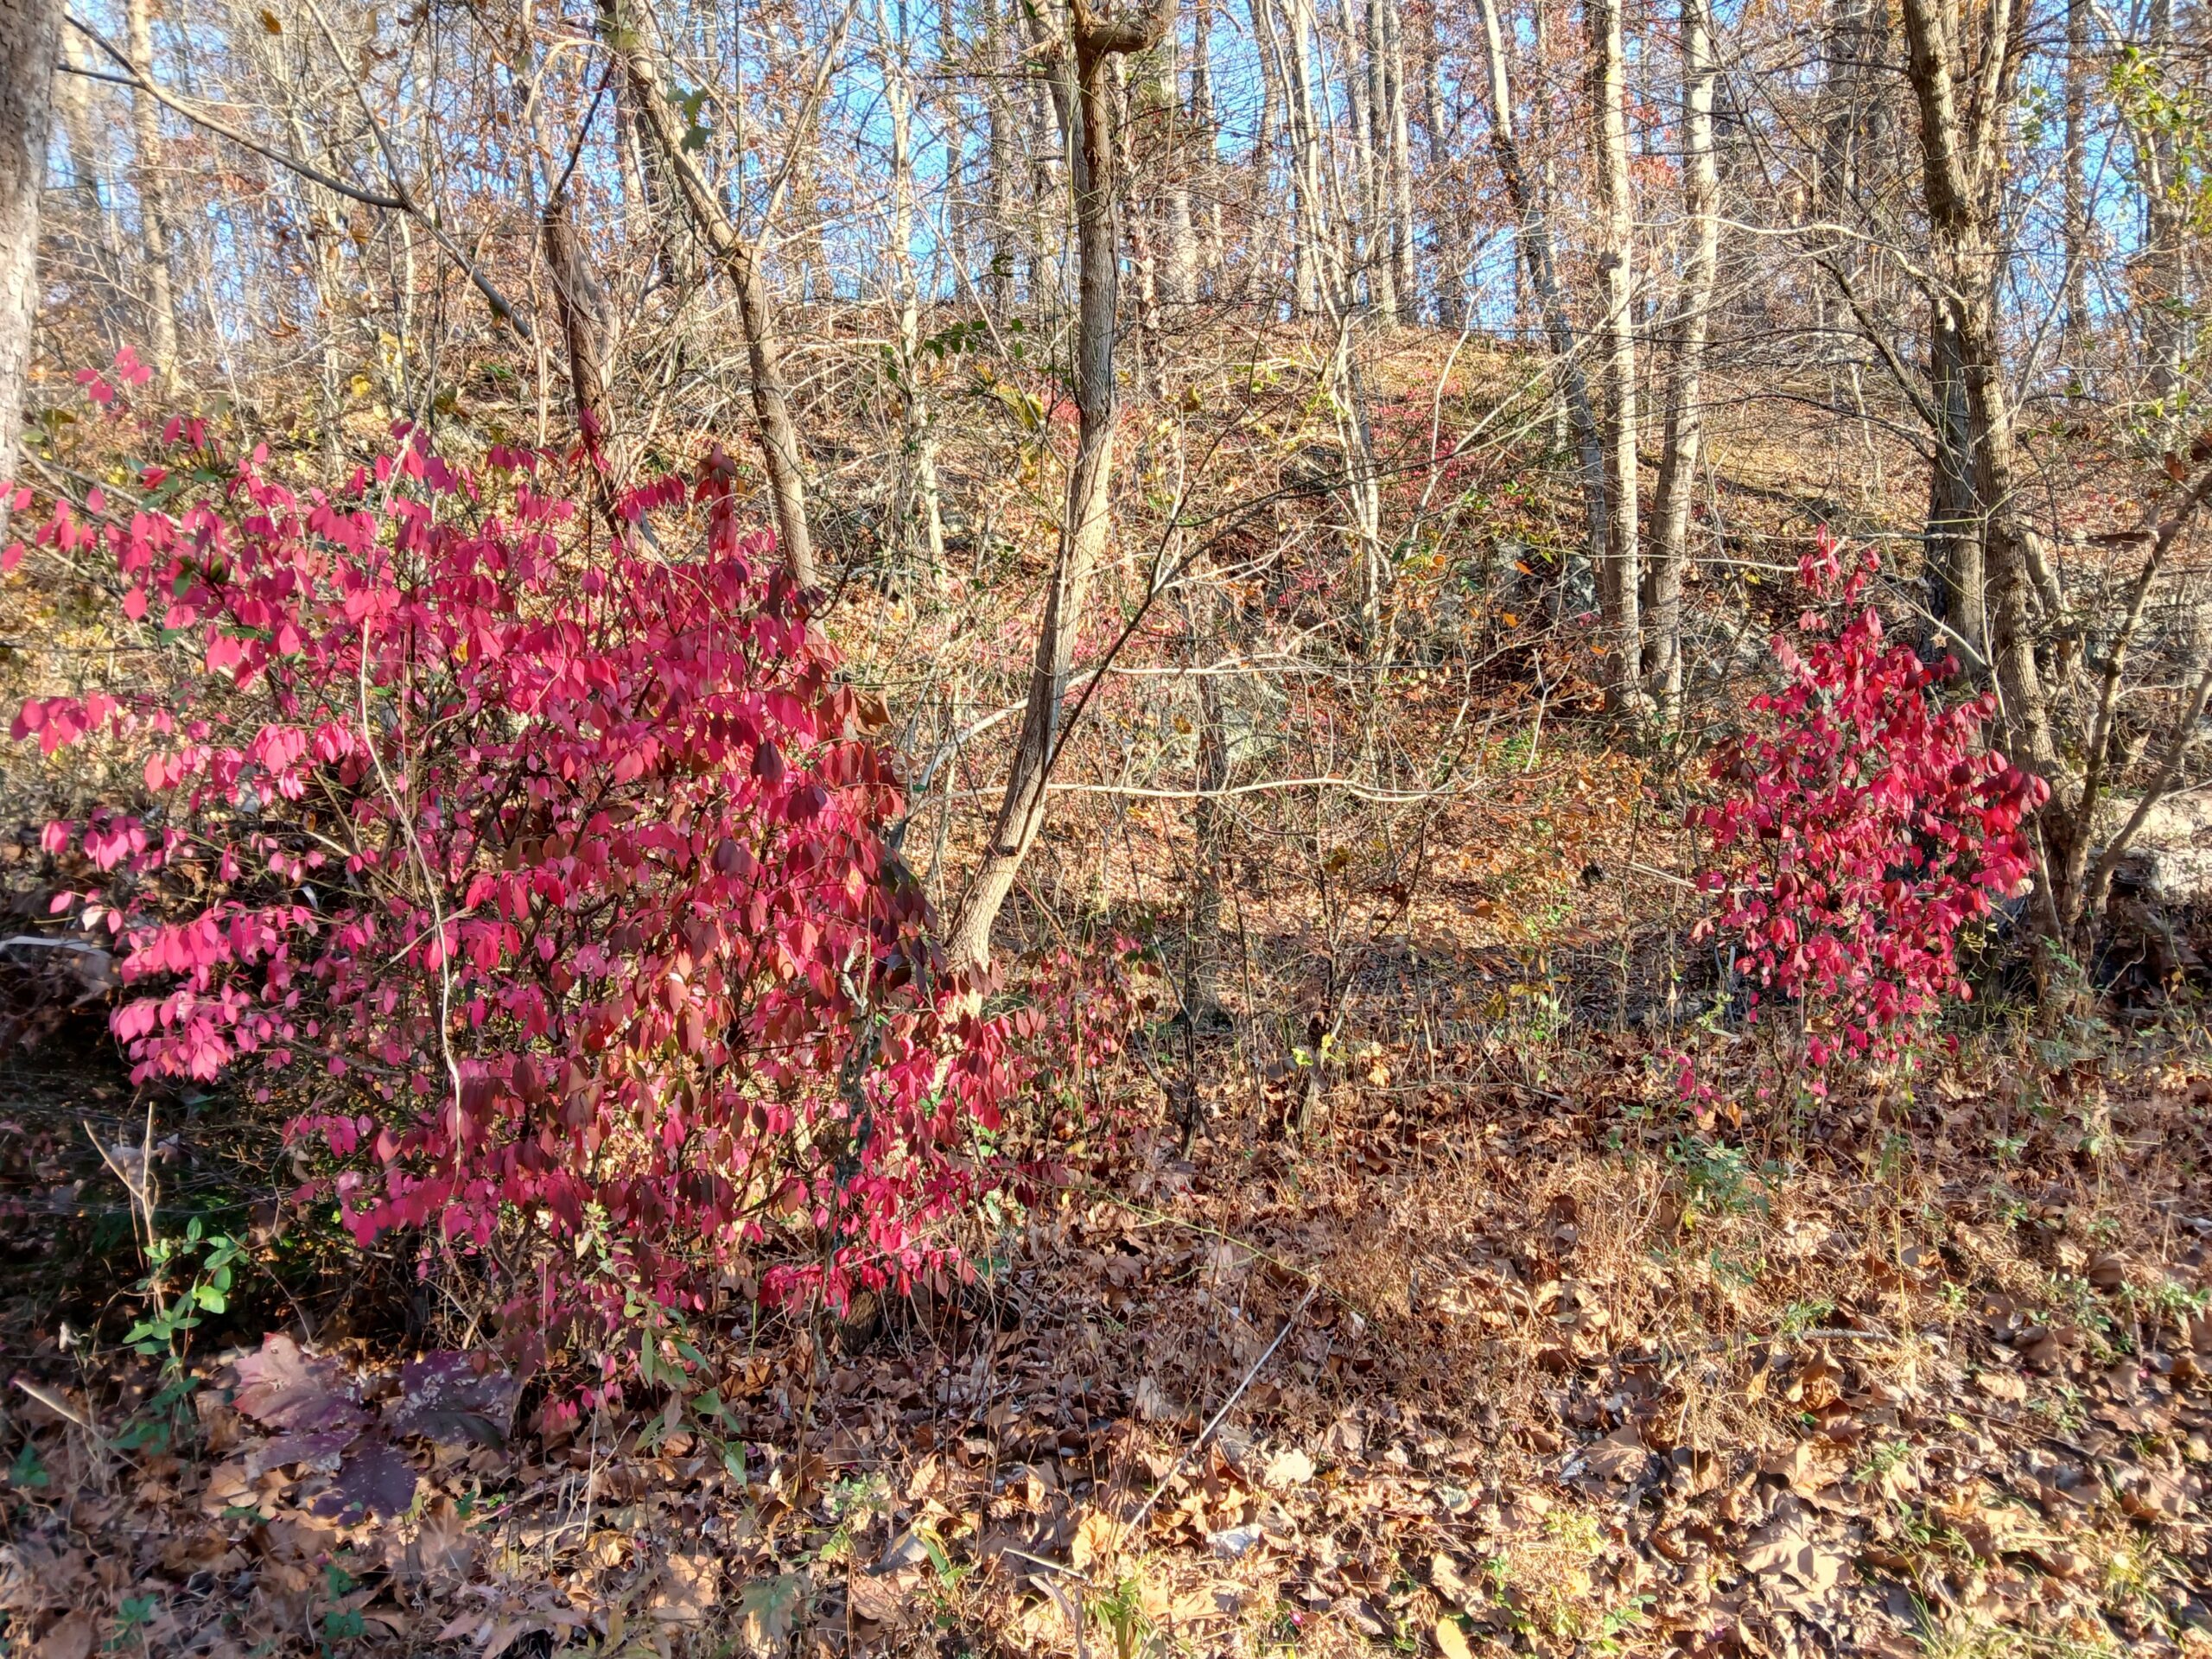
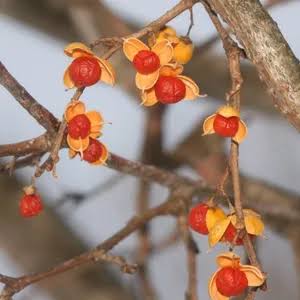
burning bush – on the DCR invasive plant list but not the VDACS noxious weed list; photo by F.T. Campbell in Fairfax County, Virginia
VIPC is a member of the Virginia Conservation Network. This coalition has developed a conservation agenda for 2027; the agenda has four categories: water; land & wildlife conservation; climate & energy; land use & transportation. “Preventing harm from invasive plants” is included under the “Native habitats & species” chapter.
In 2026 the state legislature adopted four laws that:
a) added invasive plant management to the powers of service districts; [A “service district” is a defined geographic area within a local government established to provide additional, more complete, or more timely governmental services than those generally provided to the rest of the locality];
b) removed the “commercial viability” loophole from the state’s noxious weeds law;
c) required Virginia’s Department of Transportation to create a plan for managing invasive plants along public roadways; &
d) allowed volunteers to use herbicides on state-owned public lands when under supervision of a licensed commercial pesticide applicator.
Legislation also now requires retail outlets to place warning signs near each invasive plant species offered for sale (effective January 2027); partially funds the Virginia Invasive Species Management Plan; prohibits state agencies from planting, selling, or propagating invasive plants; requires tradespersons to provide written notification to property owners for all plants proposed for installation that are included on the list of invasive plants; & allows localities to permit the supervised use of herbicides by volunteers on public lands.
The Virginia Conservation Network considers these actions to be too limited. The VIPC asks its member organizations to advocate for
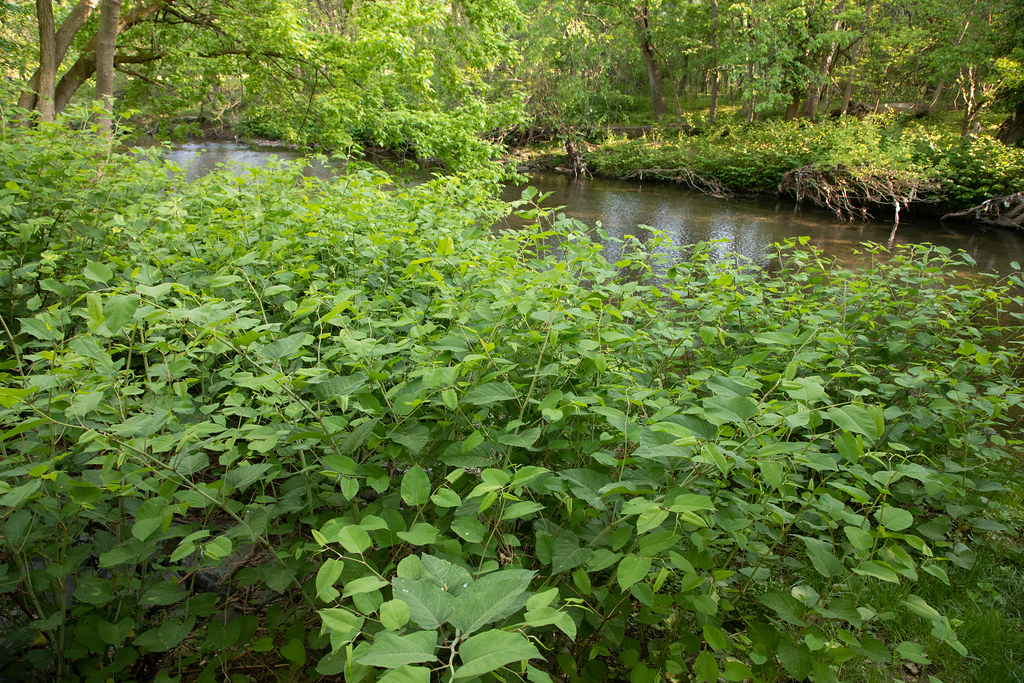
Require property sellers to disclose the presence of Japanese knotweed (Reynoutria /Fallopia japonica or Polygonum cuspidatum) on a property they are selling because it can disrupt underground infrastructure.
Tightening label language regarding whether a plant is “sterile”.
Require those clearing property for development to plant cover crops to forestall weed invasions if there is a delay in further work.
Japanese knotweed; photo by Will Parson, Chesapeake Bay Foundation
Perhaps in future the Network might broaden members’ concern about the loss of forest canopies to include insects and pathogens that kill trees?
2) Surveying nurseries to find those selling invasive plant species.
VIPC members carried out surveys in 2025 and again in 2026. The 2026 surveyors visited 122 nurseries in 60 locations across the Commonwealth. This was 42% more retailers than the 2025 survey. One-third of the nursery locations were in the Northern Virginia suburbs of Washington, D.C.
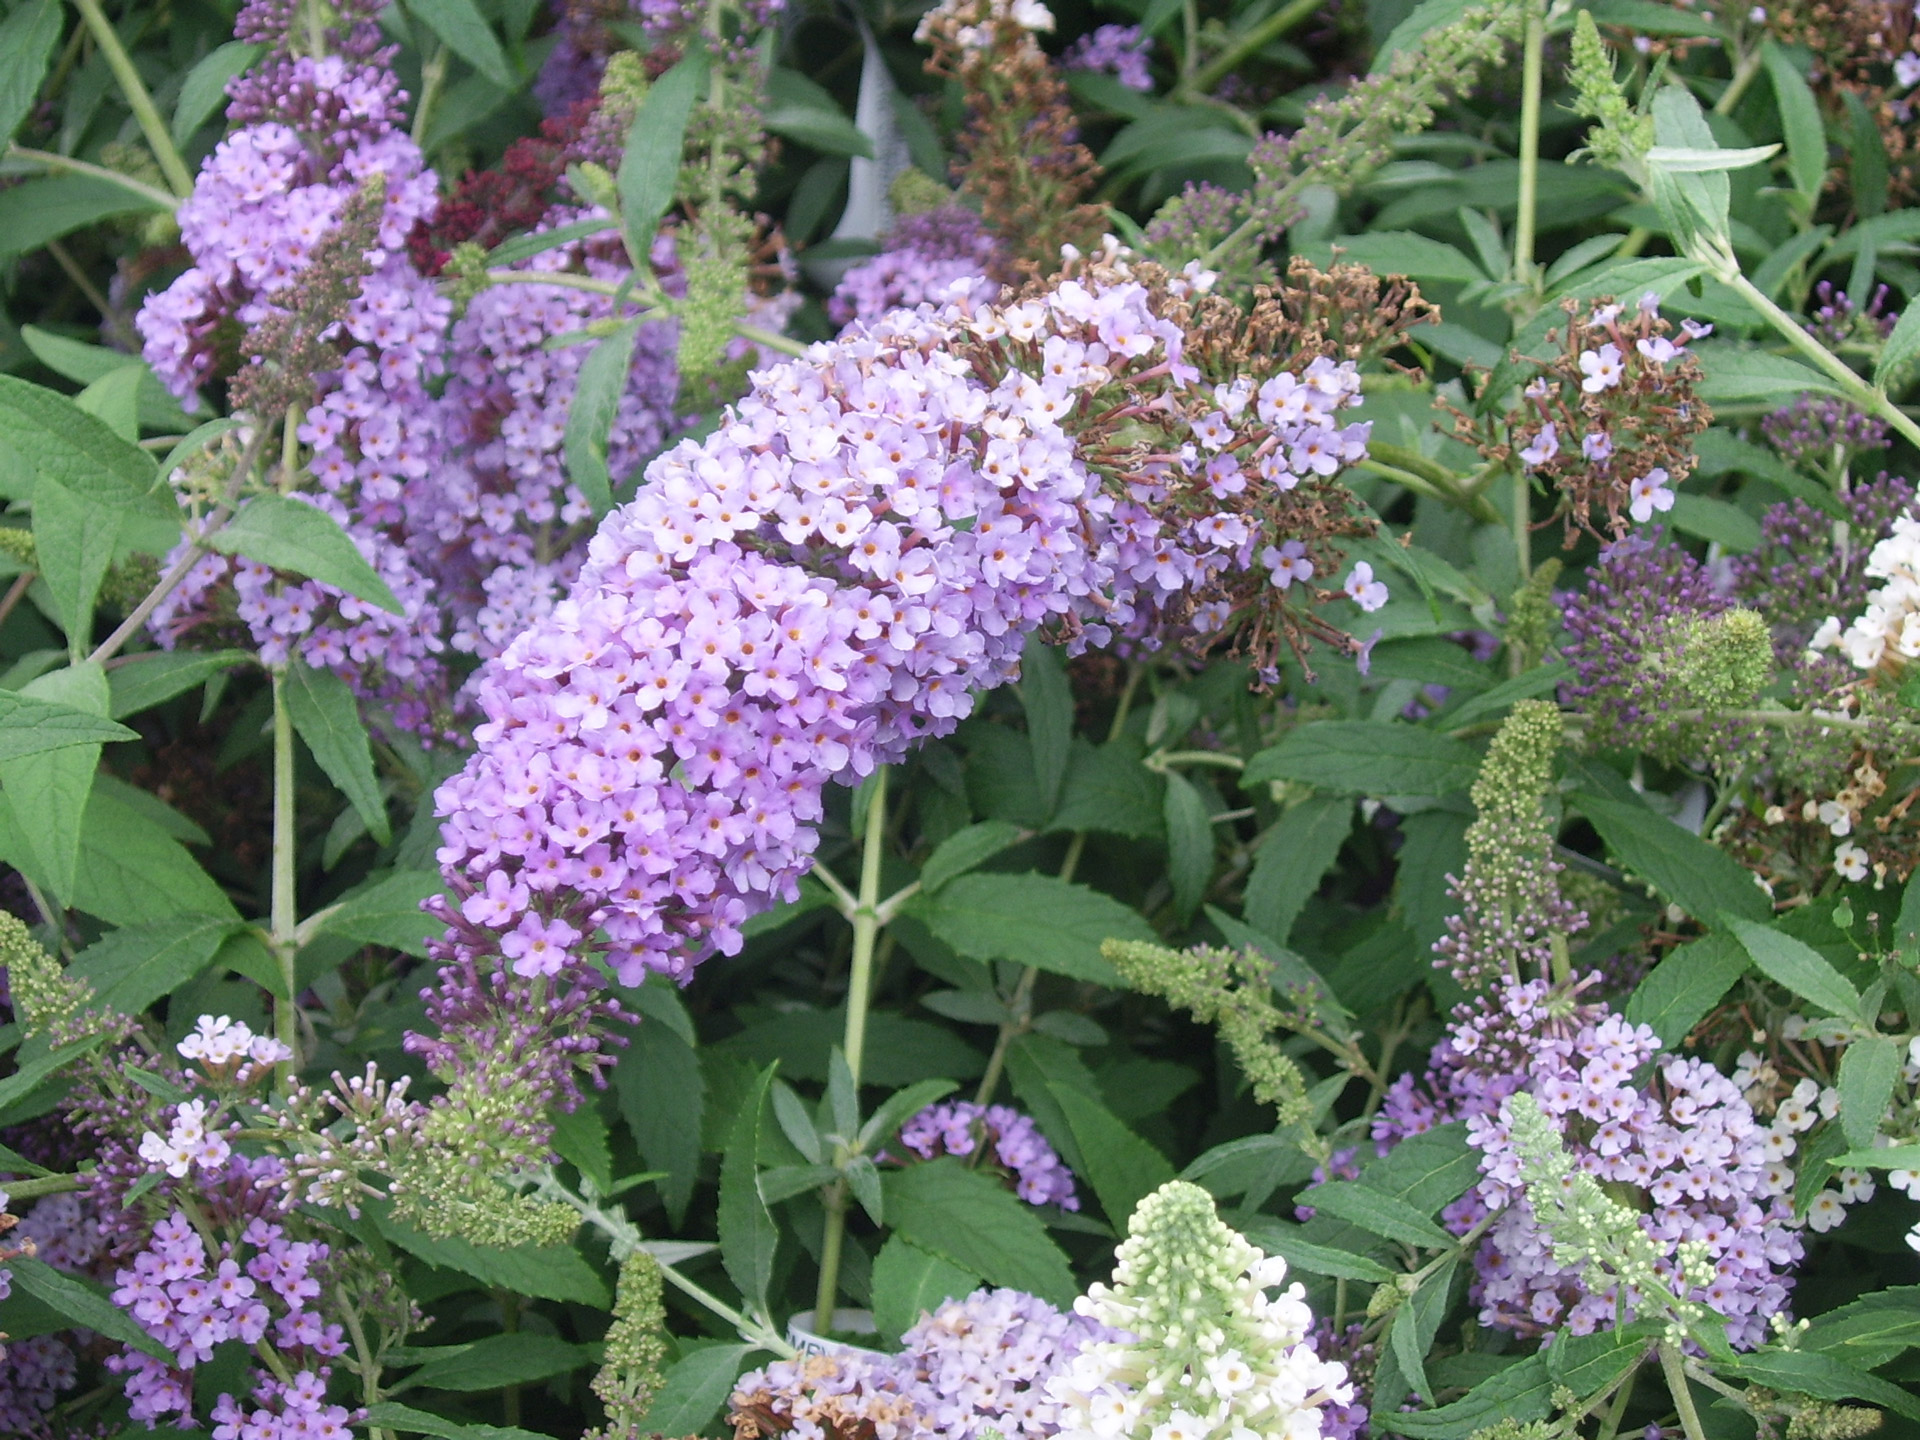
butterfly bush Buddleyadavidii; photo from Free Public Images
The 2026 surveyors found a 23% decrease in invasive plant species being offered per retailer. Twelve percent of the garden centers had no invasive species for sale. This was more than triple the number found during 2025. However, one garden center was selling 24 of the 39 invasive plant species. The most commonly detected invasive species are:
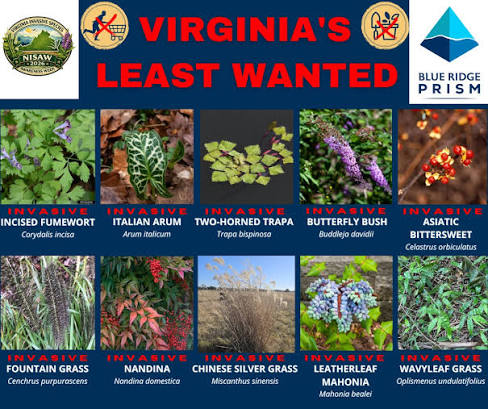
butterfly bush — found during 95 visits; [see Douglas Tallamy on why butterfly larvae cannot use this plant.]
species found during 58 to 79 visits were nandina, English ivy, periwinkle, moneywort, and Japanese barberry;
Japanese spirea and burning bush were found during 45 or 44 visits;
Two ornamental grasses, Chinese silvergrass and fountain grass, were found during 30 or 29 visits;
species found during 19 to 16 visits were greater periwinkle, leatherleaf mahonia, Chinese privet, and winter creeper;
species found during eleven to eight visits were Chinese wisteria, mimosa, water hyacinth, yellow flag, sweet autumn clematis, and border privet;
species found during five or four visits were creeping Charlie, Callery pear, golden bamboo, and Norway maple.
Invasive species found at a smaller percentage of Virginia garden centers in 2026 than in 2025 were butterfly bush, nandina, English ivy, periwinkle, greater periwinkle, Chinese privet, winter creeper, sweet autumn clematis, border privet, Callery pear, and linden arrowwood.
Invasive species found at a higher percentage of retailers in 2026 than in 2025 were moneywort, Japanese spirea, Chinese silvergrass, mimosa, water hyacinth, yellow flag, and Japanese honeysuckle (Lonicera japonica). The last species is on the Virginia Noxious Weeds List, so sale is illegal.
Invasive species found at the same percentage of Virginia garden centers in 2026 as in 2025 were Japanese barberry, burning bush, fountain grass, leatherleaf mahonia, Chinese wisteria, creeping Charlie, golden bamboo, Norway maple, five-leaf akebia, parrotfeather beefsteak plant, Italian arum, white mulberry, Chinese tallow-tree, and trifoliate orange.
Invasive species not found offered for sale by surveyed garden centers in 2026 were Amur honeysuckle*, Autumn olive*, Brazilian waterweed, cinnamon vine, cogon grass*, crown-vetch, incised fumewort*, marsh dewflower, Morrow’s honeysuckle, Oriental bittersweet*, porcelain-berry*, purple loosestrife, ravenna grass, royal paulownia, shrubby bushclover*, Siberian elm, tartarian honeysuckle, thorny olive, tree-of-heaven*, wineberry, and winter honeysuckle. (*indicates plants listed on the Virginia Noxious Weeds List.)
oriental bittersweet; on Virginia’s noxious weed list (tier 3); Picture This
Posted by Faith Campbell
We welcome comments that supplement or correct factual information, suggest new approaches, or promote thoughtful consideration. We post comments that disagree with us — but not those we judge to be not civil or inflammatory.
For a detailed discussion of the policies and practices that have allowed these pests to enter and spread – and that do not promote effective restoration strategies – review the Fading Forests report at http://treeimprovement.utk.edu/FadingForests.htm
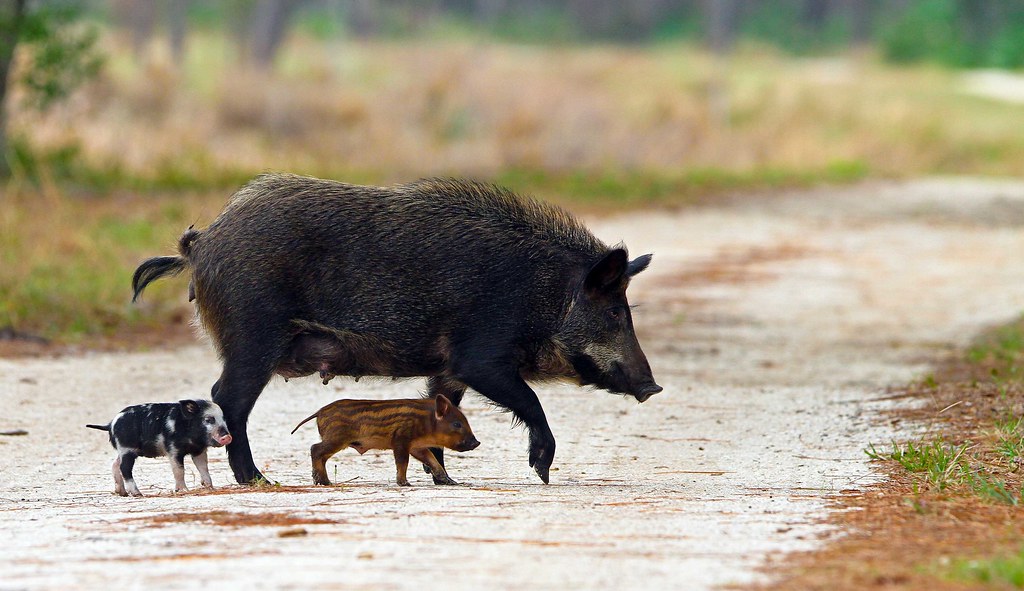
feral hogs — one the invasive species on which state approaches vary; photo by Creg Oneal via Flickr
Several groups of scientists are addressing systemic problems that impede efforts to counter bioinvasions. One of those problems is the lack of a consistent approach in federal systems.
Drake et al. (2026) (full citation at the end of this blog) evaluate the impacts of this situation in the United States where – they argue – the national government has been slow to adopt overarching policies and provide adequate and dependable funds to implement them. The result is a patchwork of varying – even clashing – regulations and differing levels of effort that undermine program efficacy. Conflicting approaches add to such well-known challenges as limited budgets and evolving goals. They recommend applying such existing frameworks as the National Invasive Species Council’s (NISC) Early Detection / Rapid Response framework or One Biosecurity to facilitate integration and cooperation among the large variety of sectors affected. (NISC’s purpose is to coordinate federal agencies’ programs. The Council has no official role vis a vis state programs. Still, there is no legal impediment to states adopting any NISC approach which they consider appropriate.) At the same time Drake et al. (2026) warn against imposing too great uniformity or lacking flexibility.
I regret that Drake et al. (2026) do not mention the National Plant Board. The NPB focuses on managing plant pests (insects, pathogens, etc.) and invasive plants. The NPB recently celebrated its centennial anniversary. States have created fora under the NPB in which they exchange experiences with the goal of coordinating their efforts.
With respect to animal invaders (other than plant pests) or disease or parasite threats to animals, I believe there is no equivalent to the NPB. The Association of State Wildlife Agencies (AFWA) has an invasive species committee which discusses issues of general concern (see agenda from one of its meetings here). This effort is much more recent than the NPB. It is similar in that it is consultative, with no authority to enforce a common approach.
Findings
Drake et al. (2026) explore the extent to which American states apply similar vs. different approaches to managing invasive species as a group and plants, invertebrates, and vertebrates separately. Lack of data forced them to exclude fungi and other microorganisms. They focused on 21 contiguous states in the eastern part of the country. They also compared the states’ lists of regulated species to national lists of invasive species compiled by the United States’ Register of Invasive and Introduced Species (US-RIIS) (Simpson et al., 2022; Simpson and Eyler, 2018) and U.S. Geological Survey Non-indigenous Aquatic Species database (NAS; U.S. Geological Survey, 2023).
A literature search revealed 1,117 state statutes, regulations, and similar policy documents that pertain to invasive species. One third of these documents (n = 448) named at least one taxon at the genus or species level. Of these, 35.3% named one or more plant species; 19.9% named one or more invertebrate; and 44.8% named vertebrates. Overall, 60.5% of these species were listed by only one state. Viewed by taxonomic group, this broke down to 40.6% of plant species, 60.6% of invertebrates, and 56.4% of vertebrates. Only four species are regulated in all 21 states = western (European) honeybee (Apis mellifera); and three agricultural weeds, creeping thistle (Cirsium arvense), quackgrass (Elymus repens), and dodder (Cuscuta species).
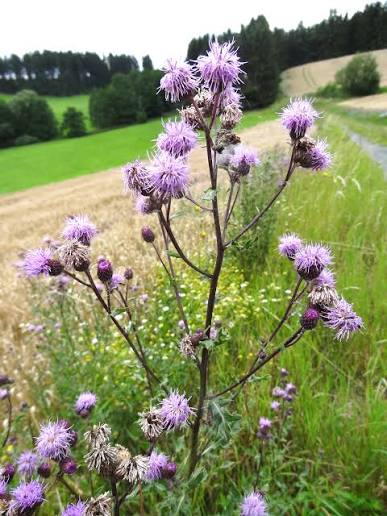
Cirsium arvense; photo by USchmidt via WikiMedia
Drake et al. (2026) found neighboring states did not share similar species lists or approaches. Consistency was even less at the regional scale, particularly when managing invasive invertebrates or vertebrates. The absence of a unified approach means that proactive states are susceptible to invasion from neighboring states which take a less vigorous stance. Since managing invasive species becomes more difficult and costly as the invasion progresses, undermining proactive policies undercuts efficiency.
Even when the national government does act, it lacks a unified approach. No federal legislation mandates a central authority to direct and implement IAS detection and response. The National Invasive Species Council (NISC), established by Executive Order 13112 in 1999, is supposed to provide high-level leadership to help overcome barriers to communication and promote collaboration among the several federal agencies bearing responsibility for various aspects of the issue. Authors, e.g., Reaser, Simpson, et al. (2020); Simberloff et al. (2020), say NISC’s effectiveness has been undermined by inconsistent funding and vacillating political support from policy-level leaders.
Drake et al. (2026) also assessed which of the 21 states took action proactively. Two plant species were listed by name by all 21 states: quackgrass (Elymus repens) and creeping thistle (Cirsium arvense). They called three states (14.3%) “pro-active” because they regulated quackgrass before it was detected in the state. Four states (19%) did the same regarding creeping thistle. The one invertebrate species listed by all 21 states, the western (European) honeybee, was established in these states before they began addressing invasive species, so it is not a test of states’ forethought.
Of course, the policy goals differ between the two plant species and the honeybee: the former are considered damaging so policies focus on their control and management, whereas the honeybee is valued for pollination and honey production so policies aim at protecting it. There is no federal legislation regulating Apis mellifera individuals already in the country. State regulations governing interstate movement are the usual jumble of approaches. Drake et al. (2026) says this lack of consistency can increase the risk that introduced pathogens, pests, and undesirable subspecies (i.e., “Africanized” bees) will spread. They note that this chaos reigns despite bees’ importance to the agricultural sector.
Florida had policies governing the most species (345), Vermont the least (67). More surprising to me, New York regulated the most plant species (161); Mississippi the most invertebrates (105), and Virginia the most vertebrates (189).
Collectively the states regulate three times more species than appear on either national registry: 1,862 species in the state database versus 630 in US-RIIS or NAS databases. The states regulated a proportionally larger number of plant species and much smaller proportion of vertebrates. The number of species named in both state and federal databases were 360 plant species (57.1%), 170 invertebrates (28.4%), and 91 vertebrates (14.4%). The difference between federal and state lists is further magnified by the fact that significant numbers of species listed on the federal databases are managed by only one state: 143 plant species (48.3%), 86 invertebrates (29.1%), and 28 vertebrates (9.5%). In other words, only 217 plant species, 84 invertebrate species, and 63 of vertebrate species designated as invasive by federal databases were being managed by more than one state.
Carex extensa – one of plant species listed as invasive by USGS but not regulated by any of the 21 states; photo by botanygirl via Picture This
The survey identified a wide range of state agencies that have at least some responsibility for managing invasive species. These agencies’ principal concerns are agricultural, plant, or livestock industries; wildlife, fisheries, and recreation; forestry, mining, and natural resources; marine resources; public and environmental health; transportation, utilities, and commerce; and administration, education, specific locations, and all other types. Agriculture agencies are overwhelmingly responsible for invasive plants, insects, and arthropods; and almost equal to Fish and Wildlife departments in the case of managing molluscs. F&W departments are most often responsible for mammals, fish, crustaceans, amphibians and reptiles. Public and environmental health agencies are a distant second as regards responsibility for plants and arthropods, and third re: insects. Administration/education/specific location agencies are third most frequently given responsibility for plants; they hardly appear for other categories. Transport and commerce ranked fourth (nearly the same as public health agencies) for managing insects.
More than half of state policy measures (55.4%) related to terrestrial species, habitats, and pathways; 17.1% related to aquatic species, habitat, and introduction pathways; and 27.5% related to both.
Considering all species named in each state’s policy codes, about half of the listed taxa in each focal state’s policies are also listed by at least one neighboring state. At the regional level, overlapping or consistent policies declined to about 19% of the species. It doesn’t surprise me that New England states rank high in cooperation. Nor that the least number of species also regulated by neighboring states applies to Florida; the “sunshine state” is semitropical and has many types of ecosystems probably not present in Alabama or Georgia.
Once again, consistency is higher for plant species than the animal taxa. Among-neighbor overlap for plant taxa is ~69-70%, for invertebrates is ~50%, and for vertebrates only about a third. At the regional level, overlap is ~28% for plant species, ~18% for invertebrates, and 14% or less for vertebrates.
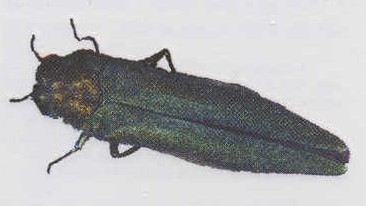
Drake et al. (2026) present case studies on several species to illustrate the breadth and depth of policy inconsistency, coordination, and implementation. The species studied are three of the four species regulated by all 21 states in the database; and three others selected to be emblematic of plant, invertebrate, and vertebrate taxonomic groups. The representative species for invertebrates is the emerald ash borer (EAB; Agrilus planipennis); the illustrative species for vertebrates is feral pigs (Sus scrofa).
Drake et al. (2026) report that the EAB had been detected in all but two of the 21 states in their study – Florida and Mississippi (EAB has now been detected in the state). There was a federal quarantine until early 2021. Still, only 10 states (47.6%) have a policy regulating EAB per se. Nine states had acted proactively; this was the highest proportion among all the species analyzed, probably because the beetle spread so quickly and had such obvious and severe impacts observed.) My analysis of data on the Don’t Move Firewood website determined that few of these states regulate firewood. Seven states require treatment of firewood originating out-of-state. New York also prohibits movement of firewood within the state over distances exceeding 50 miles. Two states regulate firewood originating in location quarantined for a specific pest, e.g., EAB. Three states restrict movement of outside firewood onto state properties. The rest of the states urge people to “burn it where they buy it” but impose no requirements. In some cases, National parks for forests have more stringent regulations. I am quite disappointed how few states have taken protective actions. Drake et al. (2026) explained the absence of regulations in the other 11 states as possibly due to the slow pace of legislative action compared to the speed of spread. I think this factor deserves greater attention.
Drake et al. (2026) noted that there are cooperative programs that cross jurisdictional boundaries; these increase programs’ effectiveness. The example they cite is the Ash Protection Collaboration Across Wabanakik — a cooperative effort among federal, state, and tribal governments and non-governmental organizations in northern New England and bordering Canadian and tribal lands.
The discussion of feral pigs reported that these animals are becoming increasingly troublesome. The highest density of pig populations is in southern states but suitable habitat is found across North America. Twelve states have adopted relevant policies; five were proactive in doing so. Feral hogs are present in at least three of the nine states that lack any policy; they are also present in neighboring states of most. Drake et al. (2026) say that the patchwork of policies and regulatory agencies across (and even within states) has hindered management. One of the issues with feral hog management is the presence of conflicting views and stakeholders. Some states encourage hunting, others outlaw it in hopes of reducing any motivation to transport hogs to new areas to initiate sport hunting. They conclude that prohibiting private landowners from profiting from feral pig hunting opportunities, while apparently useful for control, might not be reasonable.
Drake et al. (2026) notes that there is no national policy but the federal government does provide financial assistance. Congressional legislation created the Feral Swine Eradication and Control Pilot Program (FSCP), co-managed by USDA Natural Resources Conservation Service and APHIS. They say that while federal and state investment is likely necessary to conduct the large-scale control needed, the public wants the opposite: they say those responsible for pig releases and individual landowners should pay for control efforts. Drake et al. (2026) discuss the situation in North Carolina to illustrate the conflicting approaches within one state.
Drake et al. (2026) find the greatest consistency across states in the regulation of invasive plants. This might reflect the historical attention to agricultural weeds. However, there are still inconsistencies that might cause confusion and facilitate unintended spread of invasive plants by the horticultural trade. (See my earlier blog here.) They point out that the lack of attention to invertebrates and vertebrates falls short considering the risks and costs these invaders impose at the national and global levels. In the eastern United State, five of the six costliest invasive species are invertebrates; the sixth is feral hogs.
Drake et al. (2026) worry that the widespread differences in approach leads to inaccurate estimates of invasive species’ economic cost as well as reduces states’ ability to effectively plan and coordinate efforts. They concede that given the range of agencies and industries that contribute to invasive species management, their review of state policies might not accurately reflect the full effort. Also the engagement of multiple players enhances flexibility. However, the disconnect between policy and on-the-ground actions can be a barrier to effective communication and compliance. It might also result in duplication and missed opportunities for collaborative management on common goals in neighboring states.
Drake et al. (2026) concede that social acceptance affects implementation. The most cost-effective, efficient, and impactful control methods might be socially unacceptable. Often social acceptance comes after an invasive species has spread and established – so after counter action is most successful and cost-effective.
Drake et al. (2026) note that climate change is likely to reduce barriers to invasive species’ spread and establishment and facilitate transition of benign non-indigenous species into damaging invaders. They say there is an urgent need for more attention from policymakers to the threat posed to both the economy and ecological systems. Their example is the contrast between the concentration of forest insect pests in the northeast while Florida and Mississippi list the highest number of species. Drake et al. (2026) suggest these listings reflect the region’s forestry sector’s concern about non-native pests – but I have not seen such interest (See profile of Sirex woodwasp here.)
To reduce vacillations in federal policy when administrations change, Drake et al. (2026) urge Congress to adopt strong, overarching legislation. If that isn’t possible, they say the second best option is to strengthen incentives and procedures for interstate cooperation. Such an approach could be extended to Canadian provinces
Drake et al. (2026) say it is clear from their own and others’ work that current policy tools fall short and leave proactive states at risk of threats from their neighbors. A possible model is competitive and non-competitive State Wildlife Grants program managed by the U.S. Fish and Wildlife Service. These funds should complement, not be reallocated from, current conservation efforts.
They praise some efforts by NISC, specifically the Early Detection Rapid Response framework, as a way to spur improved communication among policymakers, practitioners, and researchers. However, given the many remaining legislative and regulatory gaps, and differing interpretations, they suggest increasing opportunities of practitioners to use existing research and outreach structures e.g., Land Grant institution extension model. New frameworks such as translational invasion ecology can improve identification of research priorities and transfer of generated knowledge. These frameworks explicitly take into account the ecological, sociological, economic, and political contexts. Incorporating diverse stakeholders and quantitative tools e.g., through simulations, climate change projections, connectivity assessments, and species distribution maps that take into account the socio-economic components might be able to more holistically evaluate and act upon the potential threats.
Drake et al. (2026) call for increased attention to researching species likely to become problematic in the future. They note that only four of 18 NIS species in New England identified by another’s study as likely to benefit from climate change are included under policies of at least one state in the region.
SOURCE
Drake, J., E.M.X. Reed, D. Haak, B. Brown, M.C. Mims, M.G. Sorice, H. Rogers, S. Salom, T. Schenk, and J.N. Barney. 2026. State Lines and Species Divides: Inconsistencies and Opportunities in Invasive Species Policies across the eastern United States. Ecological Applications 36(5): e70287. https://doi.org/10.1002/eap.70287
Posted by Faith Campbell
We welcome comments that supplement or correct factual information, suggest new approaches, or promote thoughtful consideration. We post comments that disagree with us — but not those we judge to be not civil or inflammatory.
For a detailed discussion of the policies and practices that have allowed these pests to enter and spread – and that do not promote effective restoration strategies – review the Fading Forests report at http://treeimprovement.utk.edu/FadingForests.htm
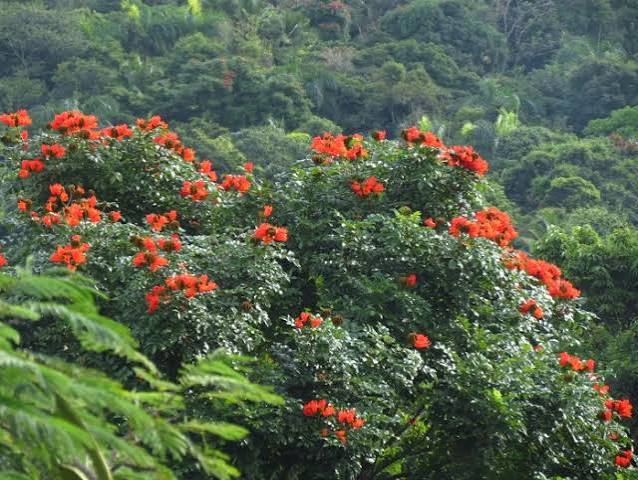
Spathodea campanulata (one of the most common invasive plant species in moist or wet forests on Puerto Rico); photo by Annika Lindqvist via EasyScape
America’s Caribbean islands have received much less attention that Hawai`i with regard to either their biological importance or level of biological invasion. I posted a blog three years ago about invasive tree species. I rejoice that the silence might be starting to change – thanks in large part to Julissa Rojas-Sandoval.
The West Indies
The Caribbean islands – including but not limited to Puerto Rico and the U.S. Virgin Islands – are considered one of 35 global BD hotspots on Earth (Castro, Quinones, and Gould 2016; Zimmerman et al. 2021). The most comprehensive descriptions are a decade old. Castro, Quinones, and Gould (2016) report that the Caribbean islands are home to ~14,526 plant and terrestrial vertebrate species, half of which are endemic to the region. At that time more than 900 species were on the IUCN Red List. The West Indies are characterized by exceptionally high levels of plant endemism, with more than 70% of seed plants considered endemic to the region (Rojas-Sandoval et al. 2017, citing earlier floristic assessments).
The Caribbean islands have a long history of anthropogenic disturbance – especially since Europeans arrived in 1492 — and intentional or accidental introductions of non-native species. Available sources differ on the number of species that should be categorized as “invasive”.
Potteret al. (2022) report that 17% of the flora of the islands of the Caribbean archipelago are not native. Rojas-Sandoval et al. (2017) identified 516 invasive non-indigenous plant species, representing about 4% of the total West Indian flora, and concluded that the incidence of invasive plants in the region is high compared with other island groups. Interestingly, each island group has its own suite of invasive species. More than 60% of these taxa occur on a single island. Thirty-eight percent belong to one of three families — Fabaceae, Poaceae, and Asteraceae. Thirty-four families are represented by a single species; 78 families by fewer than five.
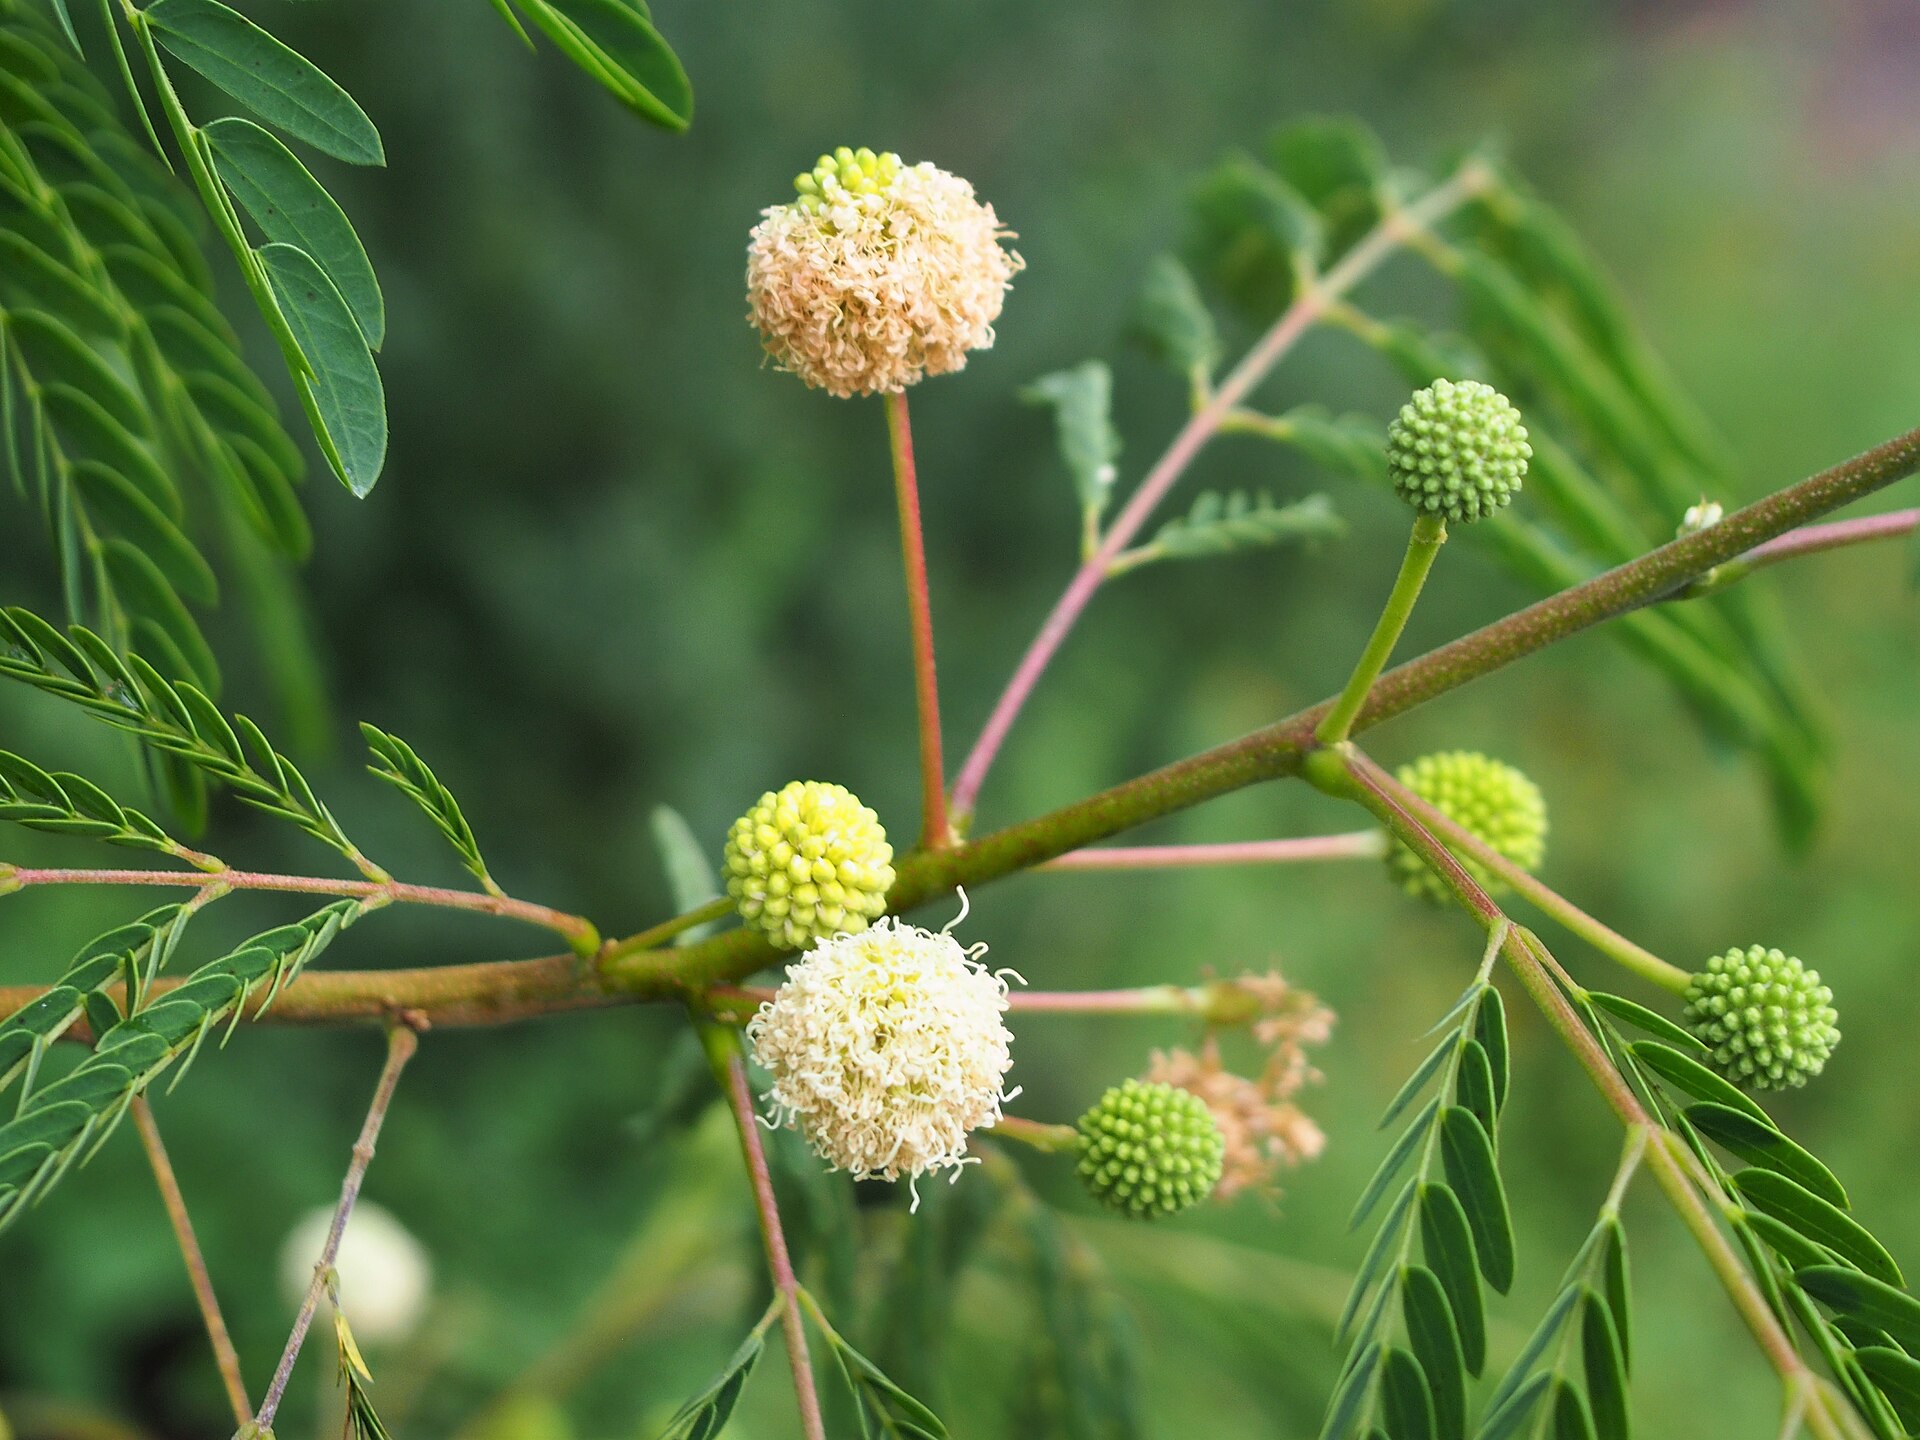
Leucaena lecocephala; photo by Agnieszka Kwiecien-Nova via WikiMedia
They report that the most widely distributed species is river tamarind, Leucaena leucocephala (Fabaceae); it occurs on all nine islands. Another seven species are found on seven of the islands: Casuarina equisetifolia (Casuarinaceae); Eichhornia crasssipes (Pontederiaceae); Megathyrsus maximus (Poaceae); Melaleuca quinquenervia (Myrtacea); Ricinus communis (Euphorbiaceae); Spathodea campanulata (Bignoniaceae), Terminalia catappa (Combretaceae).
The density of invasive plants per square kilometer varies considerably among the islands. The Virgin Islands (US and British) rank second highest at 0.245 / km2. Puerto Rico doesn’t stand out. As noted above, each island has a distinct invasive flora. The pair of islands which share the highest number of species (122) is Puerto Rico and the Virgin Islands (Rojas-Sandoval et al. 2017). I suggest it might be informative to explore whether these islands’ century-long ties to the United States influenced trade pathways and planting choices, thereby leading to this similarity.
Rojas-Sandoval et al. (2017) report that 31% of the invasive plants (162 species) are herbs; 20% (102 species) are trees; 16% (80 species) are shrubs; 15% (77 species) are grasses; 13% (67 species) are vines; 3% (15 species) are succulents; 2.5% (13 species) are aquatics. Three-quarters are perennials. These plants occur primarily in human-altered habitats: 98% (506 species) in ruderal areas; 61% (314 species) in seminatural areas; 35% (138 species) in agricultural areas. Only 5% (27 species) are found in mature forests.
Nineteen of the species are listed among the “world’s worst alien invasive species”. For example, six of the eight most widely distributed species (above) are invasive in Florida also.
Seventy-five percent of the invasive plant species have escaped from cultivation. According to Rojas-Sandoval et al. (2017), half of these were introduced as ornamentals; another third were introduced for various agriculture and forestry purposes. Finally, 7% were deliberately planted in natural ecosystems for some purpose such as erosion control. They suggest that repeated introduction of some of these species – especially the ornamentals – might increase propagule pressure and thus their probability of establishing.
Generalities About Biology on Puerto Rico
Puerto Rico is the smallest island of the Greater Antilles at ~ 9100 km2 (5,325 mi² / 1,379,000 ha) (Rojas-Sandoval, Presley, and Willig 2026). It is 39% forest, 32% grassland, 13% woodland and shrubland, 11% urban, 3% herbaceous wetlands, 1% forested wetlands, 1% inland water, < 1% natural barrens (Castro, Quinones, and Gould 2016).
Puerto Rico is relatively poor in species richness compared to mainland tropical areas. In one example, a plot in a Puerto Rican wet forest had half the number of freestanding woody species as a comparably-sized area in central Panama. Puerto Rico lacks large herbivores and predators. Still, Puerto Rico is much more diverse than other more isolated islands, e.g., the Hawaiian Islands (Zimmerman, Rojas-Sandoval, and Shiels 2021). There are 2,780 species of plants and 361 native vertebrates, including 277 birds, 52 reptiles, 19 amphibians, and 13 mammals (Castro, Quinones, and Gould 2016).
This biodiversity reflects the island’s highly varied topography – elevations range from sea level to 1338 m – and rainfall. Areas in the south and southwest receive ~800 mm while the high-elevation areas in the northeast are drenched by more than 4000 mm.
Unlike in most tropical areas, forests on Puerto Rico are regrowing due to abandonment of agriculture. Forest cover has increased from less than 6% in the 1950s to more than 55% by 2014. These regenerating forests contain a mixture of native and non-native species in a mosaic of forest at various stages of succession (Rojas-Sandoval, Presley, and Willig 2026). Potteret al. (2022) reported that two-thirds of Puerto Rico’s forests comprised novel tree assemblages.
Invasive species
A decade ago, Puerto Rico had 176 invasive plant species – 32% of the island’s flora. They comprised 44 herbs, 35 grasses, 33 trees, 28 vines, 19 shrubs, and 5 succulents. In this category, Puerto Rico ranks higher than other islands in the Greater Antilles e.g. Jamaica (21%), Dominican Republic (18%), and Cuba (12%) (Rojas-Sandoval et al. 2017; Rojas-Sandoval and Acevedo-Rodríguez 2015).
Three studies have addressed invasive species on “la Isla del Encanto”. They differ in in geographic scope, data, and study objectives.
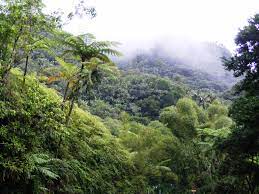
Zimmerman, Rojas-Sandoval, and Shiels (2021) addressed biological invaders in all taxonomic groups, not just vascular plants. However, their analysis was limited geographically to the Caribbean National Forest (CNF; popularly known as El Yunque). This study was based on published literature, museum and herbarium collections, local and academic experts’ experience, and personal field observations. They concluded that there were some worrisome trends but no strong evidence that the National Forest’s ecosystem was in danger of fundamental change as a result of invasive species. However, they admit data were limited and called for systematic surveys and detailed studies. This need is particularly acute because of the ecological importance of El Yunque, which is one of the few (and the most important) remnants of original native forest on Puerto Rico.
Potter et al. (2022) relied on data collected as part of the USFS Forest Inventory and Analysis (FIA) survey. The survey evaluates 341 permanent plots every 5 years. They assessed trees (no other kinds of plants) in forested areas across the island, not just in the CNF. They usually attribute invasive trees’ prevalence largely to the land-use history, i.e., reforestation of formerly agricultural lands. These scientists emphasize the importance of recent land-use history in determining where non-native tree species occur. They do not offer an overall assessment of the trajectory of invasions.
A more recent analysis by Rojas-Sandoval, Presley, and Willig (2026) was also island-wide and included all woody plants with dbh ≥ 2.5 cm, i.e., trees and shrubs. Noting that invasion intensity is steadily increasing in Puerto Rico’s forests, they concluded that the threat to Puerto Rico’s native biological diversity is greater than did the earlier studies.
Relying on the FIA surveys has the advantage of providing statistically valid data. However, this survey has two drawbacks as regards assessing plant invasions. First, the FIA inventory data don’t evaluate species in the understory, i.e., herbs, small shrubs, or vines. These species might also alter long-term successional trajectories (Rojas-Sandoval, Presley, and Willig (2026). Second, the FIA inventory is not designed to detect even woody plant species in the early stage of invasion, i.e., those that occur only as small seedlings on a few inventory plots (Potter et al. 2022).
El Yunque
Invasive Plants
Zimmerman et al. (2021) report that 168 non-native plant species from 135 genera and 57 families are established in the National Forest – at varying levels from “naturalized” to fully invasive. Of these, 77 species (~46%) had previously been listed as invasive on Puerto Rico. Twelve were hangers-on from crops planted in the past (e.g., coffee, mango, and breadfruit). They considered most of these non-invasive because they hadn’t increased strongly during a 10-year study. They named one possible exception, Simarouba amara, a timber tree, which had increased in numbers in areas of less intense land use after hurricanes in late 1990s. However, this species has not been mentioned as problematic by any other study.
El Yunque (CNF) is home to 37 of the non-indigenous plant species, including 14 vines, nine herbs, and eight grasses. These plants are described as colonizing primarily disturbed areas (e.g., landslides), wastelands, river edges, and roadsides.
The non-native species present in the regrowing forests vary by forest type – as would be expected given the large differences in rainfall. In the subtropical dry forest the principal invasive plants are river tamarind (Leucaena leucocephala) and Prosopis juliflora (Rojas-Sandoval, Presley, and Willig (2026). The former is one of the most widespread and common of the highly invasive non-native tree species throughout the Caribbean. On Puerto Rico, L. leucocephala is documented on 12.6% of 294 forested plots, 40% of plots in this biome. P. pallida (algarroba) is recorded on 10.9% of all survey plots, 27.1% of plots in the biome. Invasions in the dry forest are sometimes arrested by chronic disturbance – presumably fire (Potter et al. 2022). However, the authors do not report which species – native or introduced – come in after the disturbance.
The subtropical moist forest is presumably the biome most affected by previous agricultural efforts. African tuliptree (Spathodea campanulata) occupies 41.8% of survey plots in this biome. Rose apple (Syzygium jambos) is found on 36.4% of these survey plots (Potter et al. 2022).
Invasive trees in the subtropical wet and rain forests biome included Erythrina poeppigiana and two species also found in the moist biome – Spathodea campanulate, and Syzygium jambos. S. campanulata is found on 33.9% of the plots in this biome (Potter et al. 2022). Zimmerman et al. (2021) call our attention to an herb, Selaginella willdenowii. They call this ornamental spikemoss one of most aggressive plant invaders in the CNF.
There is a difference of opinion on the threats posed by Spathodea campanulata. Potter et al. report that S. campanulata is found on 6.1% of all plots surveyed – half or less of plots invaded by the dryland species Leucaena leucocephala and Prosopis juliflora (and the S. campanulata plots are spread across two much larger biomes – moist and wet forests). S. campanulata is also shade intolerant so Potter et al. believe it might decline in the future as other species overtop it. The conflicting opinion is offered by Rojas-Sandoval, Presley, and Willig (2026). They call Spathodea campanulata a key driver of native biodiversity loss and homogenization in moist and wet forests. They note that the species has broad ecological tolerance and can proliferate after hurricanes. They found the species to already be significantly influencing native forest distinctiveness and composition – and to be increasing in abundance.
Potter et al. (2022) considered rose apple (Syzygium jambos) to pose a higher threat since it is shade tolerant and can form dense, monotypic stands under closed canopies – which S. campanulata cannot. Zimmerman, Rojas-Sandoval, and Shiels (2021) agree that where it occurs in areas of secondary forest near stream beds, S. jambos outcompetes other species. Rojas-Sandoval, Presley, and Willig (2026) note the species might potentially contribute to homogenizing biodiversity. A new development might counter this threat: the accidental introduction of guava/ohia rust (Austropuccinia psidii); it has been highly fatal to rose apple populations in Hawai`i. Both Zimmerman et al. and Rojas et al. mention this possibility but I have not seen a more recent discussion of whether this is occurring.
myrtle rust on Syzygium jambos; photo by Smallbiologie via Wikimedia
Zimmerman et al. (2021) say several invasive vines are established in El Yunque. The vines respond quickly to the disturbances caused by the region’s frequent hurricanes. Seven of the 14 species in the CNF are morning glories in the Ipomoea genus. Other locally abundant non-native vines are Epipremnum pinnatum, Pueraria phaseoloides, Dioscorea alata, Thunbergia alata, and Thunbergia fragrans.m
Potteret al. (2022) defined invasive tree species as those exhibiting 60 – 75% of stems in the “small” diameter categories (less than 12.5 cm dbh). Fifty-seven non-native tree species in old-growth and regenerating forests it this definition. They considered 17 of them as highly invasive, 16 as potentially highly invasive, and two as moderately invasive. That is, 35 of 57 nonnative tree species, or 60%, are actually or potentially bioinvaders. While on the continent only seven non-native tree species occurred on at least 2% of FIA plots across the ecoregions in which they were inventoried, on Puerto Rico 21 species (38%) occurred on at least 2% of the FIA plots. Potter et al. (2022) could not assess the invasiveness of eight additional species that occurred only as small stems on a couple of survey plots.
Potter et al. (2022) note the possibility of conflicting views about the invaders: some of the moderately to highly invasive species provide timber and non-timber forest products. These include S.campanulata, L. leucocephala, Syzgium jambos, and Mangifera indica (mango).
Rojas-Sandoval, Presley, and Willig (2026) also analyzed FIA data to assess how non-native tree species affect the biodiversity and composition in three forest types: dry, moist, and wet forests. Unlike Potter et al. (2022), they found that non-native tree species are reshaping native tree assemblages in Puerto Rican forests, leading to significant declines in native species abundance, richness, evenness, and diversity.
The transformation is greatest in the dry forest; there, native richness has declined by more than 90% by some measures. Native communities have become depauperate, dominated by a few species. In subtropical moist forest, native richness peaked at low to moderate invasion levels, then declined. S. campanulata is the dominant non-native species; as noted above, it is found on 41.8% of survey plots in this biome. In subtropical wet forests, native species richness and diversity were highest in uninvaded and lightly invaded plots, followed by marked declines at higher levels of invasion. This is largely driven by that one species, S. campanulata (found on a third of the survey plots in this biome).
The dry forest suffered the greatest proportional loss of biodiversity, including the largest proportional declines in native species richness. Wet forests also experienced strong declines in native richness & abundance. However, since wet forests had much higher initial diversity & structural complexity, their proportional decline in biodiversity is less. Thus, invasion effects differ among forest types depending on initial diversity, resource availability, land-use history, successional stage, and community composition.
Invasion can make individual plots diverge locally through loss of some rare species or gain of different non-native species. If this happens across the study site, the compositional heterogeneity at broader scales is simultaneously reduced. This results in landscape-level biotic homogenization.
Rojas-Sandoval, Presley, and Willig (2026) say homogenization effects are particularly concerning in insular ecosystems, where high endemism and ecological specialization make native biotas especially vulnerable to displacement.
To their surprise, the key driver on Puerto Rico is the increasing abundance of the non-native trees, rather than non-native species richness (Rojas-Sandoval, Presley, and Willig. 2026).
RECOMMENDATIONS
Potteret al. (2022) advise limited efforts to eradicate or control the eight species that occurred only as small stems on a couple of survey plots. These are probably incipient invasives. They name specifically Schinus terebinthifolius (Brazilian pepper) – a species already recognized as moderately invasive in Hawai`i and seriously invasive in peninsular Florida. In 2019 USDA APHIS approved release of two biocontrol insects in Florida targetting Brazilian pepper.
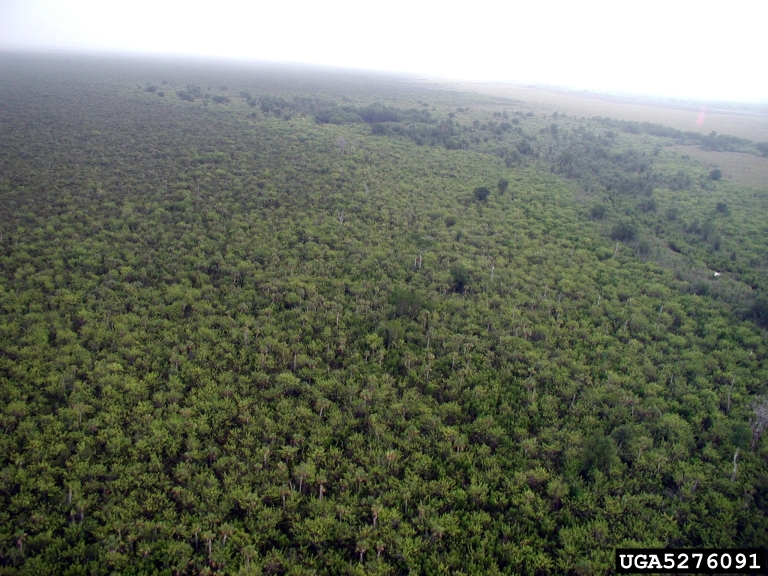
infestation of Brazilian pepper in the Florida Everglades; photo courtesy of Tony Pernas, National Park Service
I recommend that, in order to avoid having to consider importing those biocontrol agents to Puerto Rico, island conservation stakeholders should focus eradication efforts on this species now while it is still – apparently – not widespread.
Rojas-Sandoval, Presley, and Willig (2026) are bolder. They call for implementation of more effective policies to prevent additional introductions and spread of the invasives already on Puerto Rico or nearby islands. They suggest that officials focus on the species named in their dataset. In addition, scientists should also collect data on understory dynamics to get a more comprehensive assessment of bioinvasion in the forest. Rojas-Sandoval et al. (2026) also urge implementation of policies aimed at reducing anthropogenic disturbances in these fragile ecosystems. One component of this program is for those responsible for forest management, conservation, and climate adaptation to incorporate invasion dynamics into their strategies. They remind us that Caribbean islands host extraordinary species richness – many of which are endemic. So protecting these biological riches is of global importance.
Preventing anthropogenic disturbance is likely to aid control of invasive plants. Zimmerman et al. (2021) found that the better-protected forests of the Caribbean National Forest was less invaded by vascular plants than were similar areas that had higher levels of human disturbance. However, this was not the case regarding invasive mammals and some invertebrates. Other than the passing reference to Austropuccinia psidii on Syzygium jambos, none of the studies considered pests or pathogens hosted by trees or other plants.
Other Taxa
Zimmerman et al. (2021) also evaluated invasive animal species. They report that six species of vertebrates are invasive in Caribbean National Forest. Black rats (Rattus rattus), mongoose (Herpestes auropunctatus), and feral cats (Felis catus) are widespread through both disturbed and undisturbed mature forest. Each threatens many native species. The black rat also preys on seeds of several native tree species. House mouse (Mus musculus) is also very common, but restricted to roadside habitats. Cane toad (Rhinella marina) and green iguana (Iguana iguana) are also present. The green iguanas was introduced relatively recently and is rarely observed in CNF. Cane toads have been established much longer. Zimmerman et al. (2021) report no impacts.
Surprisingly, they report no introduced bird or fish species in El Yunque, even the species are common on the island and in parts of the Forest having a history of anthropogenic disturbance.
Two invertebrate bioinvaders are reported as ubiquitous in the National Forest: a hybrid honeybee and Aedes aegypti mosquito. The Africanized honeybee has evolved gentle behaviors and is no longer a great threat to cavity nesting birds, including the endangered Puerto Rico Parrot (Amazona vittata). Two species of introduced earthworms, Pontoscolex corethrurus and Ocnerodrilus occidentalis, are widespread in El Yunque; a third, Drawida barwelli, is found only in lower-elevation forest areas outside NF. The earthworms alter biogeochemical cycling in the soil, which might further influence plant community dynamics. Non-native slugs and snails do not appear to be spreading rapidly or damaging native plant species. Zimmerman, Rojas-Sandoval, and Shiels (2021) warn that additional invertebrates might be of concern in the future, since they can expand rapidly after forest destructions caused by hurricanes.
See also the brief summary of invasive species on Puerto Rico included in the Regional Summary Appendix for the Southeast in Poland et al. (2019). I note mentions of the South American Harrisia cactus mealybug (Hypogeococcus pungens, which is killing columnar cacti in the islands’ dry forests.
SOURCES
Lugo, A.E., J.E. Smith, K.M. Potter, H. Marcano Vega, C.M. Kurtz. 2022. The Contribution of Non-native Tree Species to the Structure and Composition of Forests in the Conterminous United States in Comparison with Tropical Islands in the Pacific and Caribbean. USFS International Institute of Tropical Forestry General Technical Report IITF-54.
Poland, T.M., Patel-Weynand, T., Finch, D., Miniat, C. F., and Lopez, V. (Eds) (2019), Invasive Species in Forests and Grasslands of the United States: A Comprehensive Science Synthesis for the United States Forest Sector. Especially the Appendix on the Southeast and Caribbean. Springer Verlag. Available gratis at https://link.springer.com/book/10.1007/978-3-030-45367-1
Potter K.M., Riitters, K.H. and Guo. Q. 2022. Non-native tree regeneration indicates regional and national risks from current invasions. Frontiers in Forests and Global Change Front. For. Glob. Change 5:966407. doi: 10.3389/ffgc.2022.966407
Rojas-Sandoval, J., R.L. Tremblay, P. Acevedo-Rodriquez, H.D. Soltero. 2017. IAS plant species in the West Indies: geog, ecological and floristic insights. Ecology and Evolution 2017; 1-12
Rojas-Sandoval, J., Presley, S.J. and Willig, M.R. 2026. Increasing non‑native tree abundance reshapes biodiversity and composition of tropical forests. Biol Invasions28, 84 (2026). https://doi.org/10.1007/s10530-026-03802-w
Zimmerman, J.K., J. Rojas-Sandoval, and A.B. Shiels. 2021. IAS in PR: The View From El Yunque. Front. Ecol. Evol. 9:640121. doi: 10.3389/fevo.2021.640121
Posted by Faith Campbell
We welcome comments that supplement or correct factual information, suggest new approaches, or promote thoughtful consideration. We post comments that disagree with us — but not those we judge to be not civil or inflammatory.
For a detailed discussion of the policies and practices that have allowed these pests to enter and spread – and that do not promote effective restoration strategies – review the Fading Forests report at http://treeimprovement.utk.edu/FadingForests.htm
sycamores overcome by invasive vines, primarily porecelain berry; photo by F.T. Campbell
18 months ago I blogged about the impacts of invasive plant species and deer on regeneration of tree species. I provide more information on some National Park units’ efforts to counter these threats – contemporaneous with release of the report.
Emma Brentjens has posted a report with pictures. She focuses on National parks in the National Capital Region (NCR). These are the National parks in Maryland, Virginia, and a small part of West Virginia, including Catoctin Mountain Park; Antietam, Manassas, and Monocacy National battlefields; Harpers Ferry and Chesapeake & Ohio National Historical parks; Rock Creek Park; some parkways; and some urban parks, e.g. Anacostia and East Potomac. Forests constitute three-quarters of the landcover in National parks of this region. Regional NPS staff noted poor regeneration as early as 2006. In the years since, most have ramped up IAS plant management, & begun deer population management. As result, the previously steady regeneration declines have begun to reverse.
They analyze forest vegetation data using the Stocking Index, which calculates seedling density per hectare. “Acceptable” forest regeneration is defined as 67% of plots being adequately stocked. Unfortunately – from my perspective – the program accepts non-native tree species as successful regeneration.
Comparing the parks’ Stocking Index in 2006-2009 to 2020-2024 showed that most of these parks have seen an increase in the Stocking Index, including most sites managing deer populations. Still, no parks have yet achieved adequate stocking for more than 30% of the plot.
Most parks that are managing their deer populations show growth in seedling density, e.g., Catoctin Mountain Park (illustrated in the report); Harpers Ferry National Historical Park; and Monocacy National Battlefield. In Rock Creek Park, which also manages deer, many seedlings have grown into saplings.
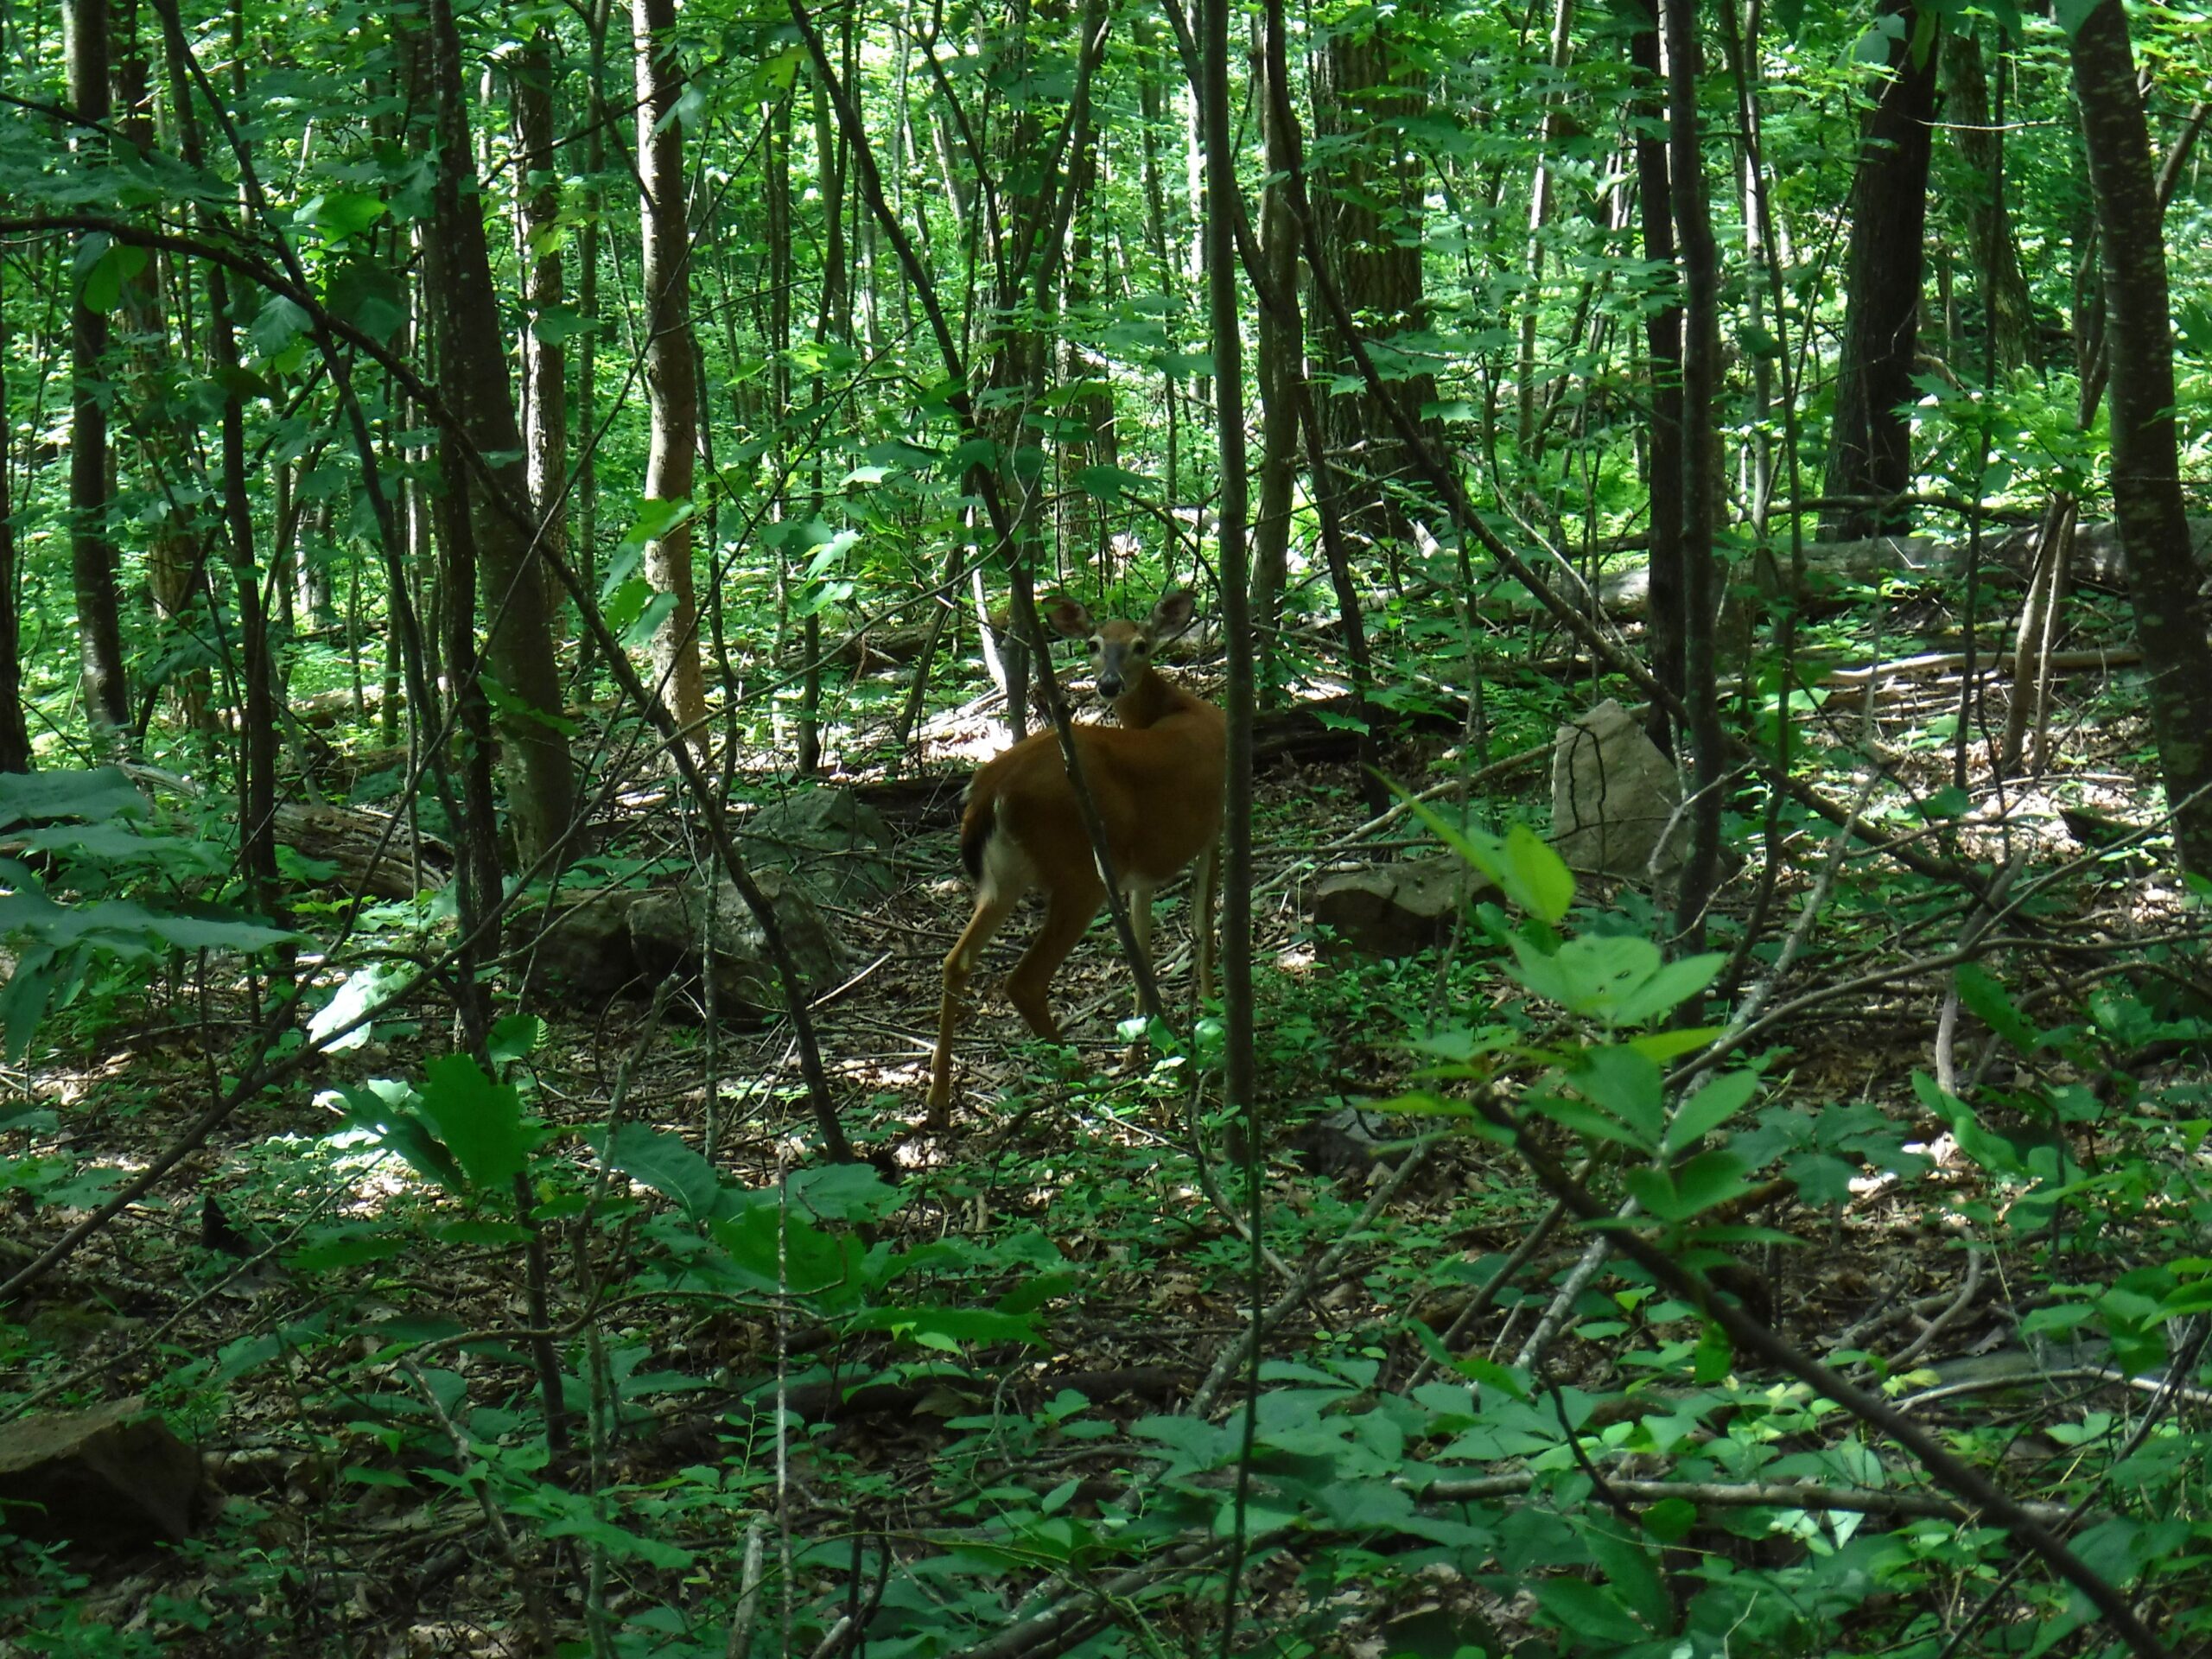
deer in Shenandoah National Park; photo by F.T. Campbell
Most of the sites with declines in seedling density have not implemented deer management. These include several segments of Chesapeake & Ohio Canal National Historical Park and the parkways. Unfortunately, it also includes Prince William Forest Park, which at 15,000 acres is the largest protected area near Washington, D.C.
Brentjens notes that while these early results are promising, seedling levels are highly variable and do not guarantee forest regeneration. Continued management is necessary to sustain improvements.
As part of deer management, the NP units are also monitoring spread of chronic wasting disease (CWD) among white-tailed deer. Current CWD rates are very low (< 1%). The disease has been confirmed at four parks in the region: Antietam, Manassas, and Monocacy National battlefields and Harpers Ferry National Historical Park.
(Chronic wasting disease is not an effect too to reduce deer populations. First, is relying on such suffering an ethical approach? Second, significant declines in deer populations are not observed until infection rates reach about 29% of the population. Parks in the National Capital Region are not expected to reach that level for at least 20 years.
Posted by Faith Campbell
We welcome comments that supplement or correct factual information, suggest new approaches, or promote thoughtful consideration. We post comments that disagree with us — but not those we judge to be not civil or inflammatory.
For a detailed discussion of the policies and practices that have allowed these pests to enter and spread – and that do not promote effective restoration strategies – review the Fading Forests report at http://treeimprovement.utk.edu/FadingForests.htm
old-growth forest in Tioresta Research Natural Area, Allegheny National Forest (Pennsylvania); photo by Nicholas T via Flickr
The implied or explicit recommendations are not new. But they are supported by new data!
Several measures of forest health drawn from survey plots of the Forest Inventory and Analysis (FIA) show that federally-owned forested lands – in both National forests and National parks – are healthier than neighboring forests under different ownership. Forest inventory plots in federal forests have significantly greater tree species and structural diversity and evenness; basal area and biomass per hectare; and seedling density. They are also less invaded by non-native plants. These findings hold across the continental United States, four regions (North, South, Rocky Mountains, and Pacific Coast) analyzed separately, and 22 common forest types.
The consistent finding of more “mature forest” features in eastern National parks and National forests – regardless of longer-term land-use histories (Potter et al. 2026b) – seems to me to indicate that recent and current management practices might overcome influences of centuries of pre-protection land use histories of exploitation and degradation.
1. Forest Health Inside vs. Outside Federal Forested Lands
Legally designated USFS National forests comprise ~19% of the Nation’s total forest area (~59 million out of 310 million hectares). Since adoption of the Forest and Rangeland Renewable Resources Act of 1974, the National Forest System (NFS) within USDA has been managed to maintain “appropriate forest cover . . . to secure the maximum benefits of multiple use sustained yield management in accordance with land management plans”. The Department of Interior’s National Park Service units are managed to conserve unimpaired the natural and cultural resources and values in the system for the enjoyment, education, and inspiration of this and future generations (National Park Service “Organic Act” of 1916).
Potter et al. 2026b assessed the ability of National forests to provide ecosystem services and forest products in the face of dramatically increasing threats: (1) more intense and frequent wildfires; (2) uncharacteristically long and hot drought conditions; (3) mortality and compositional changes caused by invasive forest pests; (4) competition from invasive plant species; and (5) forest fragmentation and conversion to other land uses. To do this, they asked whether National forests (1) have greater biodiversity – as measured by species and structural diversity; (2) are denser and encompass more biomass; (3) experience more regeneration; and (4) are less invaded by non-native plants. The FIA surveys were carried out from ~2010 to ~2022. As noted, they analyzed each comparison across the conterminous states, the four regions, and the 22 forest types.
Potter et al. (2026b) and an earlier study by Miller et al. (2016) agree that ownership determines forest management, specifically the level of anthropogenic disturbance allowed. Miller et al. demonstrated that, in the eastern United States, forests in National parks have greater live tree basal area, a larger volume of coarse woody debris, and greater proportions of late-successional tree species than nearby forests. They also have lower rates of tree growth and mortality.
Potter et al. (2026b) found that all biodiversity indicators except number of saplings per hectare were higher for plots inside the NFS than neighboring forests under other ownerships. This was true across the continent and in all four regions.
In some of the 22 forest types the indicators were particularly strong. Thus, basal area was notably higher on NFS forests populated by loblolly/shortleaf pine, Western larch, hemlock/Sitka spruce, maple/beech/birch, and oak/hickory forest types. Tree species richness was significantly higher on NFS plots for Western larch, elm/ash/cottonwood, longleaf/slash pine, pinyon/juniper, and loblolly/shortleaf pine. Differences in regeneration were seen most prominently in loblolly/shortleaf pine, oak/hickory, oak/pine, and white/red/jack pine. The authors do not speculate on the reasons.
a large loblolly pine in Congaree National Park; via Picaryl
The FIA data showed that invasive plant richness and cover were both greater on plots outside National forests across the Continent and in all four regions. However, invasive plant richness did not differ by ownership for some specific forest types: elm/ash/cottonwood, pinyon/juniper, Western larch, and hardwood woodlands. (National parks are even less invaded by non-native plants than National forests; see below.)
2. Regions Differ – Why?
Geographic regions differed noticeably. Tree species richness and evenness; diversity and evenness of tree height classes; biomass/ha; seedlings and saplings per hectare; and invasive plant diversity and cover were higher in the East – in both USFS Northern and Southern regions. Tree species richness was by far highest in the South – especially in the southern Appalachians and on the Cumberland Plateau. Seedling density was highest in the North, moderately high in the South. In the North, tree species and tree height evenness were both higher on non-federal lands.
Invasive plant richness was highest in some parts of the South. [See a more detailed discussion of invasive plants below.] Tree diameter class diversity and evenness were significantly higher in the West. Basal area was by far the highest in the northern part of the Pacific coast region (Washington, Oregon, and California.). Seedling density was moderately high in some National forests in the Rocky Mountains. Tree diameter evenness was higher outside National forests in the Rocky Mountains.
These differences had been expected given the marked regional dissimilarities in floristic, climatic, and edaphic factors, as well as ownership patterns.
Potter et al. (2026b) report that tree recruitment was stronger in the East than the Rocky Mountain and Pacific coast regions. I wish they had discussed how this finding relates to earlier findings (Potter and Riitters 2022) that numbers of species experiencing poor regeneration were highest in the Southeast, followed by the Northeast and Midwest. Miller et al. (2023) also found that tree regeneration was poor in National parks from Virginia to Maine. The latter study attributed this failure to a combination of browsing by overabundant deer and competition by invasive plants. The latter is presumably even more important in national forests, which are invaded by non-native plants at twice the rate of national parks. Nonfederal forests are invaded at even higher rates – up to 3 times greater. [See here for a study of improve regeneration in National parks which control their deer populations.]
Potter et al. (2026b) note that the higher forest health indicator values for NFS forests prevailed across the Continent despite notable differences in land-use and management histories and landscape contexts. Most NFS land in the West was put under federal management before arrival of European pioneers, so more of their groves are classified as old-growth or mature. In the East, nearly all lands incorporated into the National Forest System were privately owned until they were purchased in the 20th Century. At that time these forests were often highly degraded. Not only did the eastern National forests have to recover from overexploitation; they are still typically embedded in a matrix of other land ownerships, often largely cleared of trees.
In their analysis, Potter et al. (2026b) controlled for differences in site productivity and some environmental conditions e.g., elevation and slope, but not soil or hydrological conditions. So they believe that the suite of environmental factors do not explain the “older” attributes of eastern forests managed by the USDA Forest Service and USDI National Park Service,. These attributes generally include a more complex forest structure; higher tree species richness; and greater basal area and density of live trees (Miller et al. 2016).
What differs is management. Miller et al. (2016) say explicitly that protection from forest harvesting for many decades probably is an important explanation of why forests in the eastern National parks have greater tree species diversity than forests owned by other parties. Potter et al. (2026b) instead emphasize the impacts of different land-use histories outside of National forest boundaries. Much of this land (especially in the East) has experienced continuous, centuries-long agriculture and residential development and more acute disturbance pressures associated with higher human population density. They also note that managers of non-federal forests goals often call for harvests or other active management – which can reduce forest structure, species richness, size of live trees, presence of downed woody debris, etc.
I note that the consistent finding of more “mature forest” features in eastern National parks and National forests – regardless of longer-term land-use histories (Potter et al. 2026b) – indicates that recent and current management practices might overcome older influences. Many of these forests have enjoyed protective management for less than a century; the Forest and Rangeland Renewable Resources Act of 1974 was adopted just 50 years ago. I assert that the decisive factor might be the much lower presence – although not absence! – of deliberately planted non-native plant species on federal properties. [Again, see a more detailed discussion of invasive plant issues below.]
Potter et al. (2026b) also comment that regeneration on NFS land is almost exclusively natural. As discussed above, they consider this regeneration to be successful, in that seedlings generally are being produced in greater numbers than on surrounding forests in other ownerships. Again, I would like to learn how this finding relates to the earlier study by Potter and Riitters (2022).
Potter et al. (2026b) state that National forests benefit from their greater size and stability of management goals. These are necessary for large-scale approach to conserve or imitate the processes that create diversity
As Potter et al. (2026b) note, in the East, reserved areas like National forests (or to a greater extent, National parks) represent a small proportion of the landscape. Their distinctness from neighboring forestlands emphasizes their ecological value. They call for managers to be alert to potential invasions of non-native plants or tree-killing pests from the surrounding agricultural and developed land. In the West, private forests abut federal forested lands less often and thus have less influence on the status of forest health indicators on National forests.
3. Plant Invasions in Forests
Several studies by Kevin Potter, Kurt H. Riitters and colleagues have documented the extent of plant invasions in America’s forests. Data supporting these studies come from the same forest plot surveys conducted under the Forest Inventory and Analysis (FIA) program.
The region most invaded is Hawai`i: 83% of FIA plots have one or more invasive plant species. The region that ranks second is the East, specifically the 37 states comprising the USDA Forest Service’s former Northern and Southern regions. Nearly 53% of FIA plots in this region have one or more invasive plant species (Potter et al. 2024). FIA plots in the Rocky Mountain West had only 11% (Potter et al. 2026a).
student volunteers in Camp S.E.E.D. (Students Encouraging Environmental Recovery) program pulling invasive plants in Shenandoah National Park; via Picaryl
As noted above, invasive plants are particularly problematic in the South. There, invasive plants have been documented on 55.3 million hectares. In the Northern Region, an incomplete survey found invasive plants on 36.9 million ha. In some counties of the 37 states, 80% of inventoried forest plots contain invasive plants. Spread of these invaders is largely unchecked. The invasions’ extent and intensity are so great that their complete removal – or elimination of their impacts – is “practically impossible” (Potter et al., 2024; Potter et al. 2026a).
Plant invasions in eastern forests are undoubtedly worse than these data indicate because the records include only some of the non-native plant species present — those considered to be the worst invaders at the time regional lists were compiled (Potter et al. 2026a). Not included on the survey list are wavy-leaf basketgrass (Oplismenus undulatifolius), fig buttercup (Ficaria verna), shrub and creeping Euonymus, callery pear (Pyrus calleryana). Only one privet (Ligustrum vulgare) is included.
Furthermore, Bradley, Early and Sorte (2015) report that while non-native plant species are already more widely distributed than native species, the average invasive plant species inhabits only about 50% of its expected range.
Sites Most Heavily Invaded
Analyses of the FIA data reveal several overlapping definitions of which locations and situations have been invaded most severely. These factors are separate from the issue of ownership discussed above. Invasive plants are more numerous, widespread, and diverse in more disturbed or fragmented sites. One study found that 65% of plots that experienced greater fragmentation were invaded compared to 46% of plots that experienced low fragmentation. Invasion rates are highest in the “wildland-urban interface” (WUI). Unfortunately, the WUI is growing faster than any other land use type in the country – especially in the East (Potter et al. 2024). Because the East is so heavily developed, a plot’s distance from a road was nearly irrelevant. Furthermore, development in the WUI also promotes planting of non-native species that might then invade the nearby forest. See my more detailed discussion of these issues here.
Highly productive sites [defined as a site’s ability to grow industrial timber; Potter et al. 2026b] are also prone to invasion: 76% of highly productive plots were invaded compared to 40% of low-productivity plots. It is not known whether highly productive sites are inherently more invasible, or, instead, that such plots were converted to agriculture earlier, so exposed to human disturbance longer (Riitters et al. 2017).
A third analysis found that the best predictor of the odds that a site would be invaded was the site’s ecological province as defined by Robert G. Bailey in 1995 (Riitters et al. 2017)
Propagule Pressure: the Role of Deliberate Planting
Over 25 years (Reichard and White 2001) numerous scientists have documented the role of deliberate planting – especially ornamental horticulture – in facilitating introduction and spread of invasive plants. Kinlock et al. (2025) found that more than 1,600 plant species sold by nursery and seed catalogs over 200 years had “naturalized” somewhere in the continental 48 states. Fertakos and Bradley (2024) found that species were likely to establish if they were introduced to as few as eight locations. Beaury et al. (2023) found that half of 89 plant species recognized as invasive are sold in the same locations where they are invasive. Another 25 species are sold in an area that is currently unsuitable for those species, but that will become more suitable for invasion as temperatures warm.
Japanese barberry – invasive that is widely sold; photo by Matthew Beziat via Flickr
Both Potter et al (2024) and Potter et al. (2026a) note that the flora of suburban and rural residential landscapes is dominated by non-native plant species. I add that the people who live there promote plant invasions in various ways, including planting shrubs or flowers in the woods and dumping yard waste there. The older the human settlement, the more years for these plants to spread – assisted by birds, wind, or water. Go here for a more detailed discussion of these issues.
What Should We Do to Curtail Introduction and Spread of Invasive Plants?
a. Regulations The ornamental plant market – whether brick and mortar stores or internet sales — is interstate in scope. Regulations need to match (Beaury et al. 2023). This requires Congress to adopt a new federal law. Under the Constitution, the appropriate entity for regulating interstate commerce is the federal government. But the current statute (the Federal Noxious Weed Act) does not address long-established, widespread species.
States currently have the lead in regulating sales of horticultural plants. Beaury et al. (2023) and Evans et al. (2024) criticize state restrictions as outdated, limited to a few weeds that plague agriculture, and irregularly enforced. The result is a checkerboard of places where a species is offered for legal sale next to places where that sale is prohibited. Finally, the regulations are reactive; they rarely include plants in anticipation of their spread to new areas. Evans et al. (2024) urge state regulators to prioritize those species in the ornamental trade that are projected to remain or become abundant under evolving climate conditions.
b. Voluntary Actions
Potter et al. (2024) call for efforts to encourage homeowners to plant more native and environmentally friendly private landscapes. They concede the complication that some non-native – even invasive – species provide valued ecosystem and cultural services. They also suggest that local governments adopt land-use planning rules that protect forests of high conservation value. They do not discuss the extreme improbability of the latter action given the magnitude of predicted land-use changes in the country, powerful demographic factors driving them, and lobbying clout of affected economic interests, including the nursery industry.
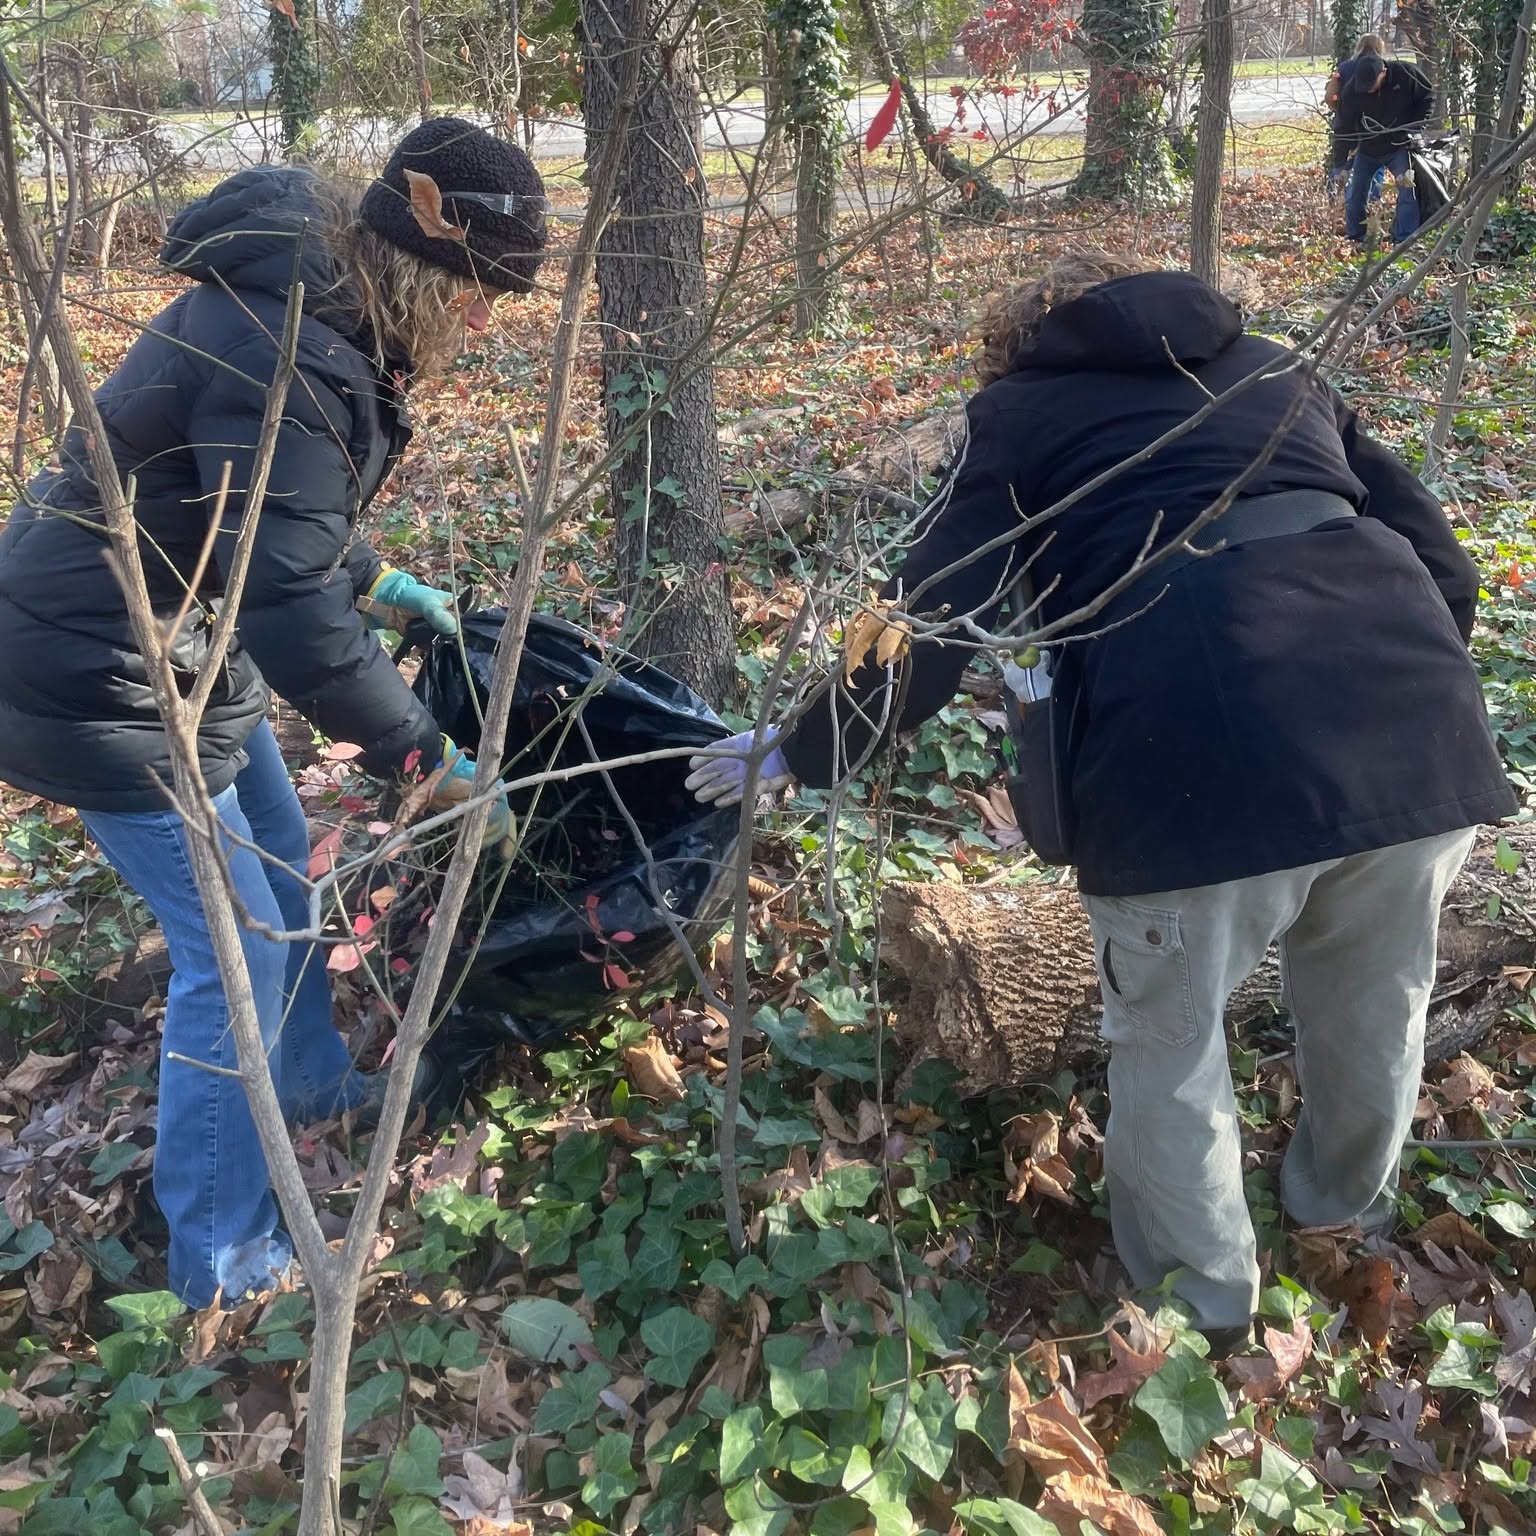
Many citizen associations – native plant societies, regional or state invasive plant councils, etc. – are pursuing the education approach. (See the websites for state native plant societies, Southeast Exotic Pest Plant Council, Mid-Atlantic Invasive Plant Council, Midwest Invasive Plant Network, and Virginia Invasive Plant Coalition.) These voluntary efforts have yielded some success. But they have not resulted in adequate protection for our ecosystems.
c. Land-Managing Agencies
Many land-managing agencies work with local and regional groups to monitor and remove invasive plants, e.g., Blue Ridge PRISM. Databases that verify and post their findings, e.g., iNaturalist and EDDmapS can provide early warning of new invaders. See here for a discussion of these matters.
Blue Ridge PRISM removing English ivy; photo courtesy of Rowena Zimmerman, Director of Virginia Invasive Plant Coalition & Blue Ridge PRISM
Potter et al. (2026a) also suggest that the USDA Forest Service update the lists of invasive plants to be included in future FIA surveys. I agree. See above for examples of highly invasive species not now included.
Of course, the influence of plants on ecosystems is broader than invasive species. Dr. Douglas Tallamy has demonstrated that even non-invasive, non-native plants can disrupt food webs.
SOURCES
Beaury, E.M., J.M. Allen, A.E. Evans, M.E. Fertakos, W.G. Pfadenhauer, B.A. Bradley. 2023. Horticulture could facilitate invasive plant range infilling and range expansion with climate change. BioScience 2023 0 1-8 https://doi.org/10.1093/biosci/biad069
Bradley, B.A., R. Early and C. J. B. Sorte. 2015. Space to invade? Comparative range infilling and potential range of invasive and native plants. Global Ecology and Biogeography
Evans, A.E., C.S. Jarnevich, E.M. Beaury, P.S. Engelstad, N.B. Teich, J.M. LaRoe, B.A. Bradley. 2024. Shifting hotspots: Climate change projected to drive contractions and expansions of invasive plant abundance habitats. Diversity and Distributions 2024;30:4154
Fertakos, M.E. and B.A. Bradley. 2024. Propagule pressure from historic U.S. plant sales explains establishment but not invasion. Ecology Letters 2024;27:e14494 doi: 10.1111/ele.14494
Kinlock, N.L., D.W. Adams, W. Dawson, F. Essl, J. Kartesz, H. Kreft, M. Nishino, Jan Pergl, P. Pyšek, P. Weigelt and M. van Kleunen. 2025. Naturalization of ornamental plants in the United States depends on cultivation and historical land cover context. Ecography 2025: e07748 doi:10.1002/ecog.07748
Miller, K. M., F. W. Dieffenbach, J. P. Campbell, W. B. Cass, J. A. Comiskey, E. R. Matthews, B. J. McGill, B. R. Mitchell, S. J. Perles, S. Sanders, J. P. Schmit, S. Smith, and A. S. Weed. 2016. National parks in the eastern United States harbor important older forest structure compared with matrix forests. Ecosphere 7(7):e01404. 10.1002/ecs2.1404
Miller, K.M., S.J. Perles, J.P. Schmit, E.R. Matthews, M.R. Marshall. 2023. Overabundant deer and invasive plants drive widespread regeneration debt in eastern United States national parks. Ecological Applications. 2023;33:e2837. https://onlinelibrary.wiley.com/r/eap
Potter, K.M and Riitters, K. 2022. A National Multi-Scale Assessment of Regeneration Deficit as an Indicator of Potential Risk of Forest Genetic Variation Loss. Forests 2022, 13, 19. https://doi.org/10.3390/f13010019.
Potter, K.M., K.H. Riitters, B.V. Iannone III, Q. Guo and S. Fei. 2024. Forest plant invasions in the eastern United States: evidence of invasion debt in the wildland‑urban interface. Landsc Ecol (2024) 39:207 https://doi.org/10.1007/s10980-024-01985-y
Potter, K.M., B.V. Iannone III, K.H. Riitters, Q. Guo, K. Pandit, C.M. Oswalt. 2026a. US Forests are Increasingly Invaded by Problematic Non-Native Plants. Forest Ecology and Management 599 (2026) 123281
Potter, K.M., Q. Guo, F.H. Koch, S. Lim-Hing, E.R. Matthews, and K. Pandit. 2026b. U.S. National Forests Are More Diverse, Denser and Less Invaded than Neighboring Forests. Forests 2026 17
Reichard, S.H. and P. White. 2001. Horticulture as a Pathway of Invasive Plant Introductions in the United States. BioScience 103. Vol. 51 No. 2. February 2021.
Riitters, K., K. Potter, B.V. Iannone III, C. Oswalt, S. Fei, Q. Guo. 2017. Landscape correlates of forest plant invasions: A high-resolution analysis across the eastern United States. Diversity and Distributions. DOI: 10.1111/ddi.12680
Tallamy, D.W. and K.J. Shropshire. 2009. Ranking Lepidopteran Use of Native Versus Introduced Plants
Conservation Biology, Volume 23, No. 4, 941–947 2009 Society for Conservation Biology
DOI: 10.1111/j.1523-1739.2009.01202.x
Posted by Faith Campbell
We welcome comments that supplement or correct factual information, suggest new approaches, or promote thoughtful consideration. We post comments that disagree with us — but not those we judge to be not civil or inflammatory.
For a detailed discussion of the policies and practices that have allowed these pests to enter and spread – and that do not promote effective restoration strategies – review the Fading Forests report at http://treeimprovement.utk.edu/FadingForests.htm
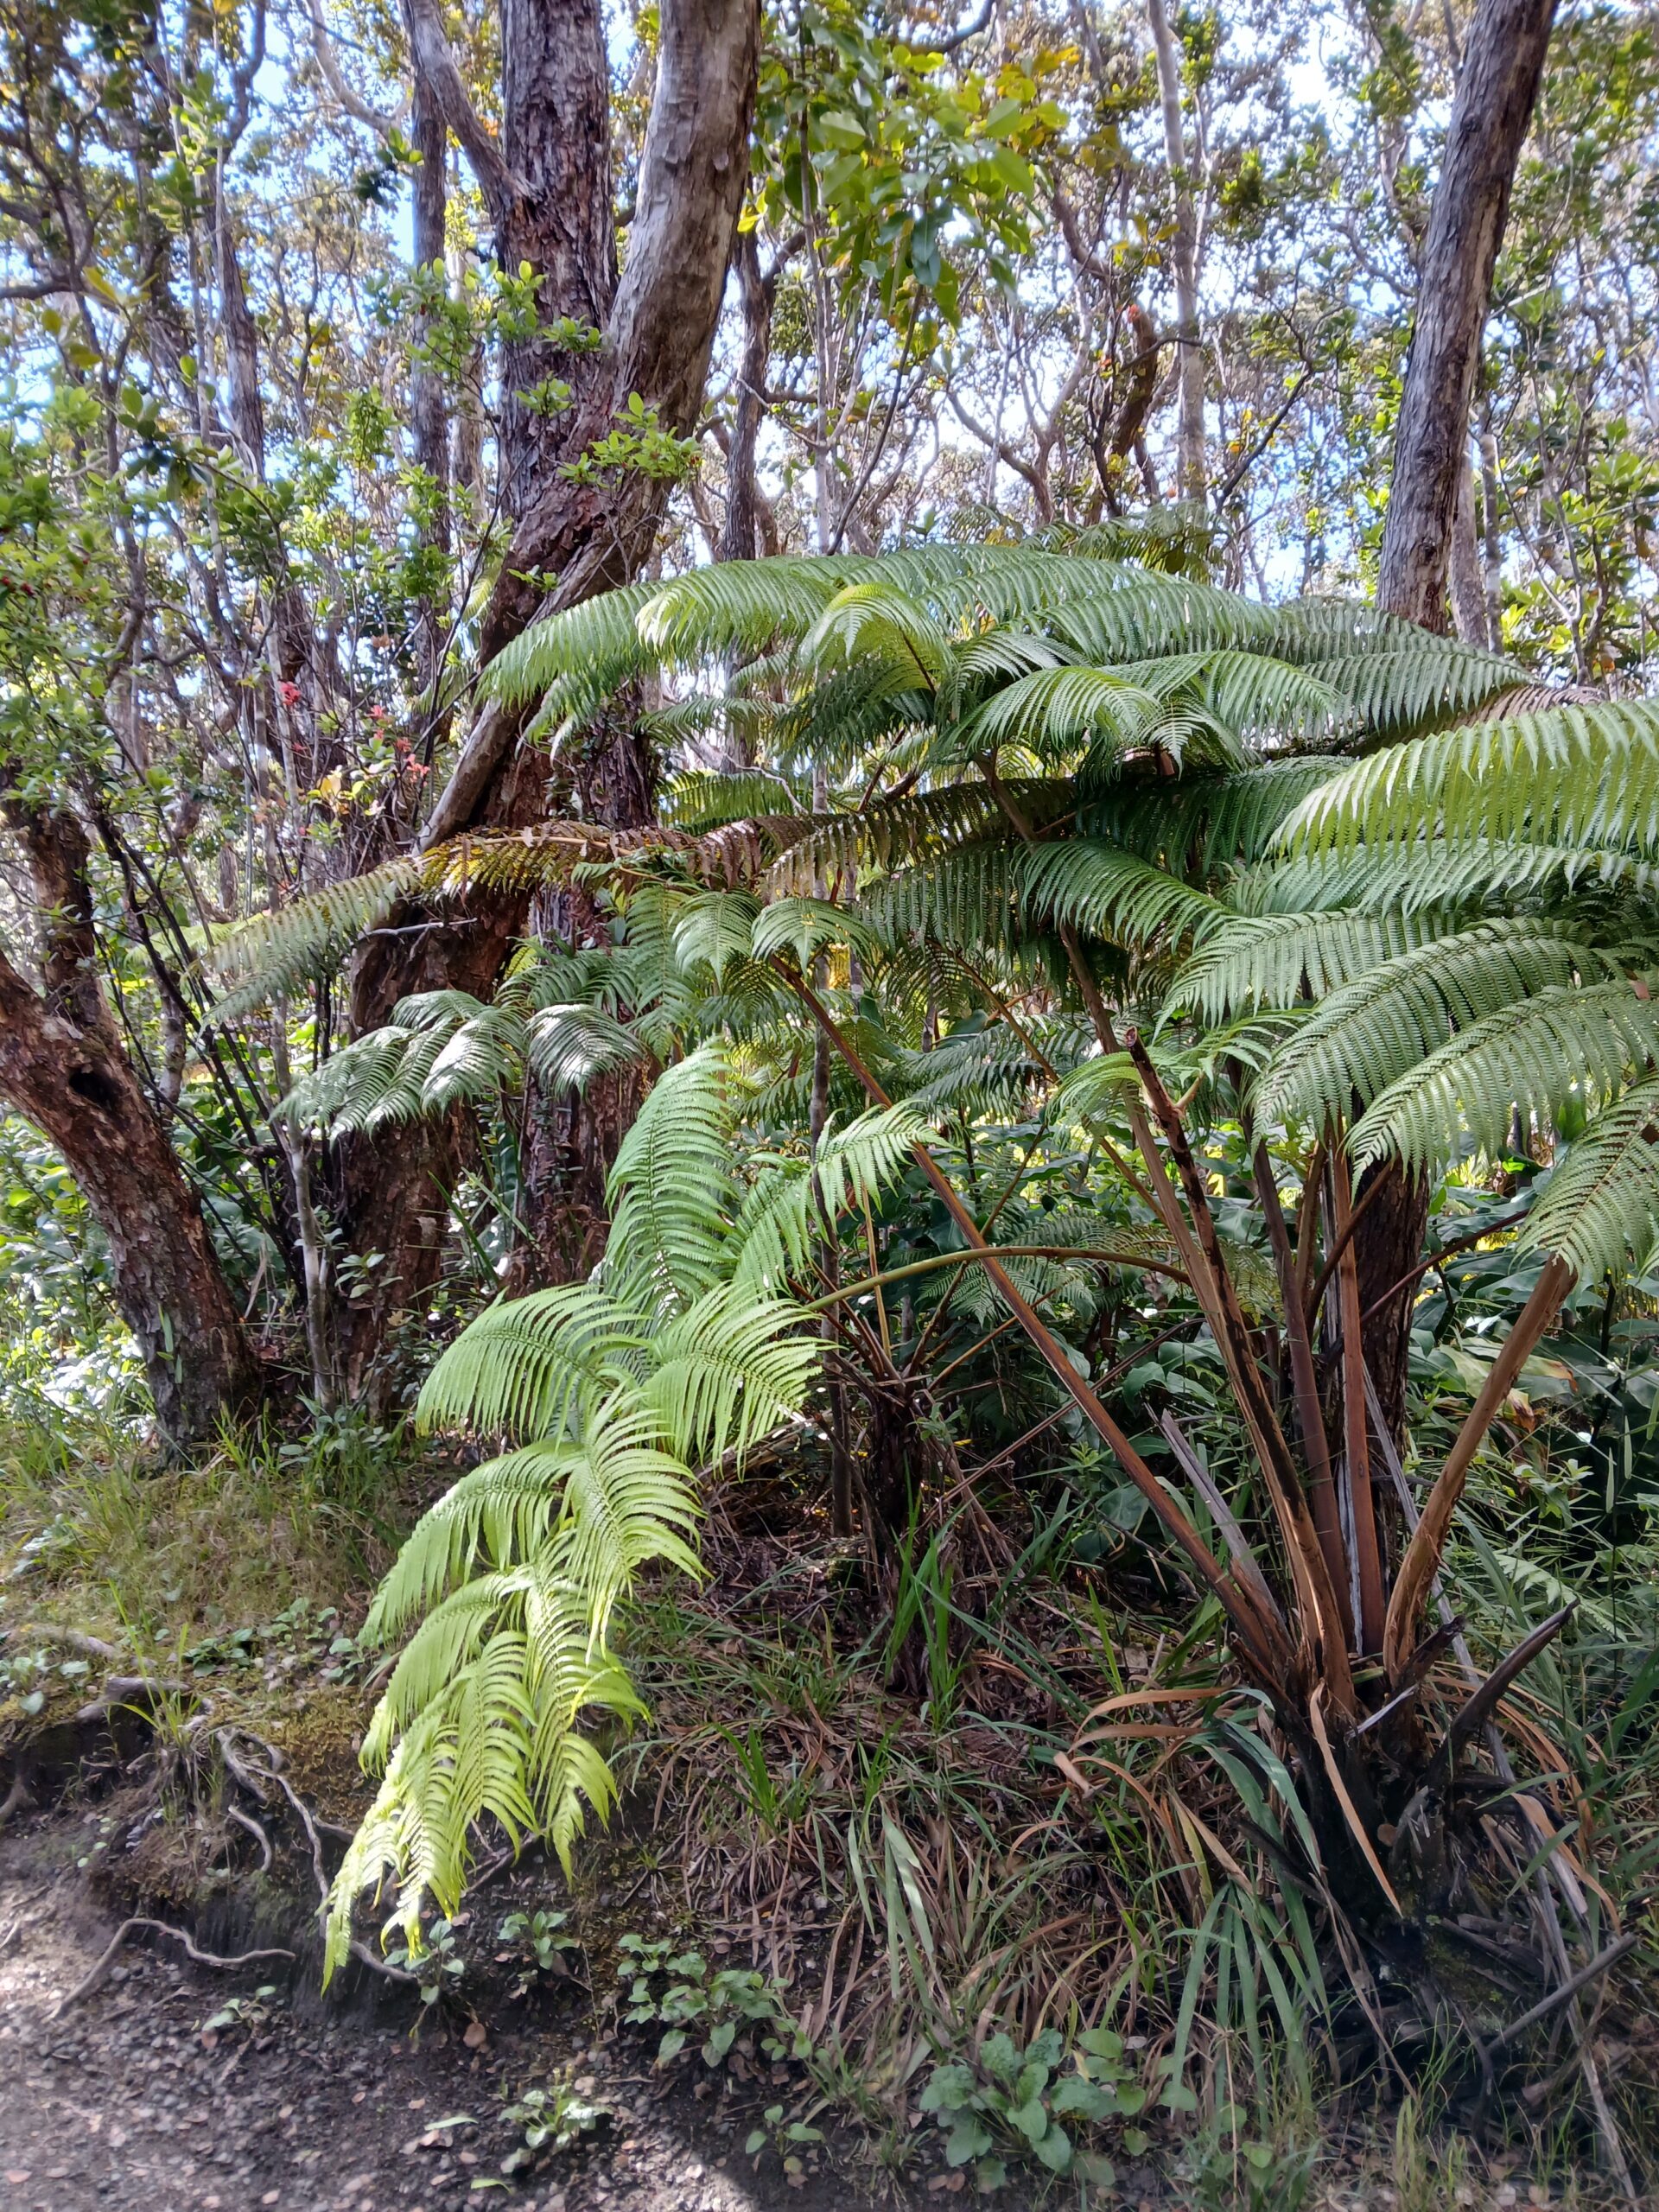
Cibotium glaucum in Hawaii Volcanoes National Park; F.T. Campbell
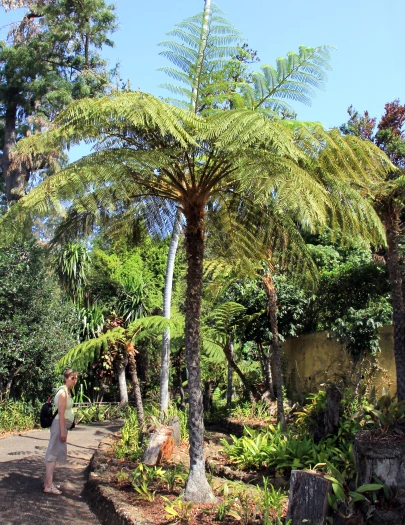
A year ago I blogged about the status of Hawaiian species in the face of high levels of bioinvasions. I now update that discussion as it pertains to one of the invaders, the Australian tree fern Sphaeropteris cooperi.
S. cooperi has successfully invaded multiple regions, including the southern coast of South Africa, the Azores and Mascarene Archipelagos, and Hawai`i. The invasion’s impacts have been assessed only in Hawai`i. Studies found that the non-native tree ferns have outcompeted the dominant native tree fern Cibotium glaucum (Cibotiaceae), and altered leaf litter composition hence soil nutrient cycling. This in turn affects species assemblages (van den Berg et al. 2025).
Chau, Walker and Mehltreter (2013) documented the litter and soil chemistry in Hawaiian rainforests. They found that S. cooperi produces more leaves that grow faster, contain more nitrogen and phosphsorus, and decompose faster than the leaves of the dominant native tree fern C. glaucum. They compared the effect of leaf litter from the native and tree ferns on the growth and nutrient content of four native angiosperm species when they were grown in N-rich forest soil and P-rich landslide soil. The results suggested that nitrogen availability is the strongest driver of growth. The introduced tree fern, S. cooperi, can thus prompt more rapid growth of some native HI plants. They point out, however, that under natural conditions, native plants must compete for these additional nutrients with various non-native plants, including S. cooperi. The ultimate impact, then, remains unclear.
van den Berg et al. (2025) report that other invaded sites are at great risk Both the Garden Route region of South Africa and La Reunion Island in the Mascarene Archipelago in the eastern Indian Ocean have high bioidiversity. Both contain large, globally-recognized protected areas established to protect the native biodiversity: UNESCO Garden Route Biosphere Reserve and Reunion National Park. Despite their biological importance, both are among the top10 most invaded countries/territories globally (Tuberlin et al. 2017).
Sphaeropteris cooperi; photo via Easyscape
While climate change is expected to reduce the extent of suitable habitat for the Australian tree fern in both South Africa and La Reunion, the current situation is troubling. At present the tree fern occupies a narrower range of climatic conditions in both the Garden Route and especially on La Reunion than in Australia. (On La Reunion, 13.74 % of the fern’s apparent niche remains unoccupied.) van den Berg et al. (2025) are not sure what factors might be limiting the tree fern’s spread. They do urge educational campaigns to persuade people living near the Biodiversity Reserve to avoid planting the non-native tree fern.
The tree fern’s actual niche is somewhat uncertain because predation by deer (non-native to Australia) might have reduced its reproduction. The authors mention this but do not speculate further on the possible response of the fern to the absence of such stresses on La Reunion.
SOURCES
Chau, M.M., Walker, L.R. and Mehltreter, K. An invasive tree fern alters soil and plant nutrient dynamics in Hawaii. Biol Invasions15, 355–370 (2013). https://doi.org/10.1007/s10530-012-0291-0
Turbelin,A.J., Malamud,B.D., Francis,R.A. 2017. Mapping the global state of invasive alien species: patterns of invasion and policy responses. Glob. Ecol. Biogeogr. 26,78–92. https://doi.org/10.1111/geb.12517.
van den Berg, M.L., G. Singh, E.J. McCulloch-Jones, M. Rouget, D.M. Richardson, T.B. Robinson. 2025. The invaded range of the tree fern Sphaeropteris cooperi is predicted to shrink in two southern hemisphere biodiversity hotspots. African Journal of Botany 178 (2025) 390-399
Posted by Faith Campbell
We welcome comments that supplement or correct factual information, suggest new approaches, or promote thoughtful consideration. We post comments that disagree with us — but not those we judge to be not civil or inflammatory.
For a detailed discussion of the policies and practices that have allowed these pests to enter and spread – and that do not promote effective restoration strategies – review the Fading Forests report at http://treeimprovement.utk.edu/FadingForests.htm
We are beginning to get more information about invasive species on the African continent.
a flyer naming principal invasive ornamental plants in Kruger National Park
In several countries, the focus has been on threats to agriculture. Previous blog about horizon-scanning in Ghana. In Zimbabwe, N. Mudada and colleagues (2026; full citation and the end of this blog) found alarming, if not surprising, levels of risk to food production from introduced invasive plants. They investigated 1,668 human-aided transboundary plant introductions at 14 ports of entry and non-official crossing points over the course of four years.
They estimate that the 20,000 trucks that transported maize into the country over the four years carried over 20,700 metric tons of weed seeds and rubbish! They recorded detections of 11 species in eight orders. The pathways are familiar. As noted, several weeds were contaminants of grain shipments; Convolvulus arvensis in wheat for human consumption, Helianthus annus and Datura stramonium in maize for animal feed. Adenium obesum and Vitex agnus-castus were being smuggled for planting as flowers and ornamentals. (Vitex agnus-castus was also smuggled in passenger baggage for its medicinal properties). Several Lemna species (an aquatic plant) were also smuggled for planting as animal feeds.
In some cases, the focus is the threat to native ecosystems. I posted a blog the about threat of an introduced pathogen to trees in the remnant rain forests of Madagascar.
South Africa still has the lead in addressing invasive species. Regarding invasive plants specifically, the country has the benefit of more than 150 years of botanizing. The richness of the region’s flora is globally recognized. South Africa also has a long history of studying and managing invasive species, especially plants.
South African scientists and colleagues in Botswana, Eswatini, Lesotho, and Namibia have published four editions of the Flora of the Southern Africa region since 1984. In 2006, the PRECIS database of the South African National Biological Diversity Institute (SANBI) was combined with the Tropical African Plant Checklist published by the Conservatory and Botanical Garden of Geneva to create the African Plant Checklist and Database Project. It is continually updated. This is the first continental flora checklist for Africa; it fulfils countries’ obligations under the Convention on Biological Diversity’s Global Strategy for Plant Conservation.
The 2025 Checklist reports that 21,539 plant species are extant outside cultivation in the country; these comprise 20,204 indigenous species and 1,329 naturalized species. Thus, 6% of the total flora is non-indigenous. Of these, 649 (48.8% of the non-indigenous species, 3% of all plants) of them are invasive.
[Naturalized species are defined as species whose documented natural range does not include South Africa, but have overcome a biogeographic barrier and now sustain self-replacing populations for two or more life cycles or over a given period of time in the country. These populations are maintained without direct intervention by people, or despite human intervention. Invasive species meet the above definition plus produce reproductive offspring, often in large #s at considerable distances from the parent and/or site of introduction, and have the potential to spread over long distances.]
Since the previous checklist was published in 2006, botanists have identified 1,048 additional species – a 4.9% increase. Eighty-two percent of the newly identified species (865 species) are “naturalized”. Specifically, 414 new species are categorized as naturalized (a 31.1% increase), and 451 new species are classified as invasive (a whopping 69.5% increase). Le Roux and Klopper attribute these steep increases to active botanizing by SANBI’s Invasive Species Programme (begun in 2008), and the Southern African Plant Invaders Atlas Project (begun in 2010).
Of the 384 plant families present in South Africa, 350 contain at least some indigenous species. Thirty-four families contain only naturalized species. Among the 2,189 plant genera present, 459 (21%) contain only species that are non-indigenous.
Three families stand out because of the particularly high numbers of naturalized species: Fabaceae (143 species; 11% of all naturalized species), Asteraceae (140 species; 10%), Poaceae (123 species; 9%). Two of these families — Asteraceae and Fabaceae — are also the largest families among native South African plants. The third, grasses (Poaceae), ranks seventh in the list of most specious families indigenous to South Africa. The next group of families with high numbers of naturalized species has less than half as many invasive species: Myrtacae (55), Amaranthacea (52), Solanaceae (48). None of these families ranked within the top 20 families of indigenous plant species.
The genera with the most naturalized species were Solanum,Euphorbia and Acacia (all 24 or 23 species).
Acacia cyclops; photo by David M. Richardson
South African scientists are also exploring how to balance conflicting goals and perspectives when an invasive plant species has economic or social value. The example chosen by Mbobo et al. (2025) is guava (Psidium guajava) – a nutritious and popular tropical fruit grown commercially in South Africa, but also invasive along roadsides, watercourses and forest margins. Invasions are especially common in eastern parts of country; large monocultures are found in KwaZulu-Natal. Outbreaks have also been detected at five sites in Western Cape in riparian zones and at a hot spring. Mbobo et al. (2025) note that the microclimatic conditions at this last location differ from the broader conditions in the region – which are what most models would measure.
The scientists used models to predict where guava might invade – especially in large monocultures – and compared those areas to where the tree can be grown in cultivation with human inputs, e.g., irrigation. They then assessed whether six regulatory approaches would avoid restricting guava farming in areas at minimal or low risk while still protecting vulnerable locations. They also considered the amount of information required to implement the approach and costs of acquiring the information; and level of likely public acceptance. Mbobo et al. (2025) laid out the trade-offs between continuing to regulate planting of the species at the provincial level vs. at the municipal level. Prohibiting planting of guava in provinces where it is recorded as invasive allows some plantings near natural forests and riparian areas that are highly susceptible to guava invasions. On the other hand, nearly half of the prohibited area is outside the known or likely at-risk area. The provinces do allow exceptions through a permit process. Adopting more geographically limited rules by regulating at the municipal level would enable a tighter link to geographic areas at highest risk. However, this approach does not address long-distance seed dispersal by animals. Furthermore, the very detailed regulations might confuse stakeholders and complicate enforcement. Also, the models lack sufficiently fine spatial resolutions to predict invasible areas so accurately. Finally, the reduction in regulated area is minimal (~ 14%), so the economic benefits are unlikely to outweigh the significantly higher administrative costs and risk of allowing guava invasions in new sites.
Guava fruit on tree; Roenashy via Wikimedia
Gildenhuys et al. (2026) analyzed the factors that drive which non-native plants establish where. They assessed the roles of temperature, precipitation, urbanization intensity, urban area, travel time, year of city’s establishment, and human population density in determining which plant species are present in 54 urban centers in Western Cape Province. The cities have significant differences in climate: Mediterranean in the far southwest, warm temperate in the southeast, and semi-arid towards the interior. The expectation was that these drivers and assembly processes are influential at more advanced invasion stages when the species have already overcome some barriers to dispersal, so are now found in reasonably suitable habitats.
Gildenhuys et al. (2026) found temperature and precipitation were most important in determining plant species’ presence. This was especially true at the boundary between arid and mesic climates. These strong environmental gradients are the same ones which have driven high differences in native species presence across the province. [See pamphlet describing invasive plants in Cape Town.] This finding supports the “Goldilocks hypothesis”: that non-native plant species assemblages are driven by the same abiotic variables as native species assemblages. While did not directly study the “Biome decides hypothesis” (the composition of non-native flora is mediated by the biotic effects of native flora and fauna), Gildenhuys et al. (2026) doubt its applicability here because native species’ presence has probably been greatly reduced by the effects of urbanization.
Urbanisation intensity itself ranked third as a factor. Its effect was strongest at low to medium urbanization intensities. Because urbanization creates novel habitats, such as, “hardscapes” of paved surfaces that resemble deserts, their non-native plant assemblages are dominated by similar, urban specialist, species. At lower urbanization intensities a greater variety of habitats is available. Gildenhuys et al. (2026) conclude that urbanization acts primarily as a driver of opportunistic habitats for species at later invasion stages rather than as a filter of species introduction.
An earlier study found a similar effect from road density (often associated w/ urbanization) as an explanation for where specific woody non-native species establish. They do concede that larger urban areas might experience greater propagule pressure.
Gildenhuys et al. (2026) note that recent globalization of the plant trade has probably changed the specis planted in urban centers. For example, cities in the Western Cape are increasingly replacing English oak (Quercus robur) with more disease-resistant oaks. The change might reflect greater environmental awareness and regulations issued under the National Environmental Management: Biodiversity Act 10 of 2004. In newly established urban centers, fewer invasive species are being planted — at least among trees.
SOURCES
Gildenhuys, C.P., L.J. Potgieter, C. Hui, D.M. Richardson. 2026. Drivers of compositional turnover of the NIS urban flora in the W Cape, South Africa. Urban Ecosystems (2026) 29:51 https://doi.org/10.1007/s11252-026-01919-3
Le Roux, M.M., R.R. Klopper. 2025. Taking stock of South Africa’s flora. South African Journal of Botany 184 (2025) 571-579
Mbobo, T., D.M. Richardson, A. Datta, K.T. Faulkner, J.R.U. 2025. Wilson. Spatially-Differentiated Reg of NIS Can Be Improved Using Spp Distribution Models: Psidium guajava in South Africa as a Case Study. Diversity and Distributions. 2025 31:e70102 https://doi.org/10.1111/ddi.70102
Mudada, N., J. Chitamba, E. Nyangani, C. Chapano, N. Mapope,and W. Ngezimana. 2026. Weeds associated with cross border traffic, their approach and infestation rates in Zimbabwe. ISABB Journal of Food and Agricultural Sciences. Vol. 12(1) January-June 2026. DOI: 10.5897/ISABB-JFAS2025.0192
Posted by Faith Campbell
We welcome comments that supplement or correct factual information, suggest new approaches, or promote thoughtful consideration. We post comments that disagree with us — but not those we judge to be not civil or inflammatory.
For a detailed discussion of the policies and practices that have allowed these pests to enter and spread – and that do not promote effective restoration strategies – review the Fading Forests report at http://treeimprovement.utk.edu/FadingForests.htm
dying ash in Shenandoah National Park; photo by F.T. Campbell
The emerald ash borer (Agrilus plannipennis; EAB) was detected in North America in 2002. So both U.S. and Canadians have been motivated to evaluate the probable trajectory of the primary hosts – the ash genus Fraxinus – in the face of the ongoing invasion. See Deschênes et al. 2026 and Wilson et al. 2025 – full citations at the end of this blog. Both studies focused on white (Fraxinus americana) and green ash (F. pennsylvanica); they say next to nothing about black ash (F. nigra). I regret this silence because of the unique ecology of black ash swamps. Neither addresses the threat to Oregon ash (F. latifolia) in the West.
The two assessments have similar findings: high mortality of larger trees (canopy and “recruit” size trees); abundant regeneration (seedling and saplings sizes) after an initial period; and uncertainty as to whether persisting EAB populations will kill the saplings before sufficient numbers grow into reproductive size.
There are two conspicuous differences. First, the American study does not consider the possible impact of biological control – although USDA APHIS has placed all its effort on this approach since January 2021. The Canadians report that self-sustaining populations of the wasps are now found across the northern U.S. and eastern Canada. In their study, conducted in Ontario, they detected only Tetrasticus planipennisi; it was parasitizing 16% of the EAB larvae in dissected stems. This wasp’s affinity for colder climates and short ovipositor – which limits it to parasitizing larvae inhabiting small stems – are portrayed as positive traits under these circumstances.
Second, the Canadians did not find “lingering” adult ash trees as have the Americans. These trees indicate the probability of finding workable levels of genetic resistance to the EAB. USDA Forest Service scientists are pursuing a breeding program. While in south-central Michigan, where overstory ash mortality typically exceeded 80%, 46% of overstory ash and 82% of ash recruits were relatively healthy (Wilson et al. 2025), in Ontario none of 1,129 overstory ash trees survived beyond seven years after EAB detected. No trees exceeded 15 cm dbh (Deschênes et al. 2026).
ash resistance breeding trial at Holden Arboretum; photo courtesy of Jennifer Koch, USFS
Regeneration
As Deschênes et al. (2026) state, the future of ash stands depends on the complex of interactions among environmental conditions, management interventions, efficacy of natural enemies (natural or introduced), and life-history traits of the insect and its host. Coexistence might be possible if EAB larval densities remain sufficiently low to support survival of residual trees and successful seedling recruitment.
Larval densities in Ontario were said to be generally low, suggesting reduced carrying capacity in post-invasion forests, lower EAB fecundity, and higher EAB mortality in regenerating stems. Deschênes et al. (2026) note that in more northern areas colder temperatures are thought to slow larvae development. Perhaps these larvae might also be less vigorous, so they night disperse only over short distances. Still, there were sufficient EAB present after all the overstory trees had died to create 97% of the 298 galleries in regenerating ash stems (Deschênes et al. 2026). Furthermore, Wilson et al. (2025) say that EAB densities in infested trees in Michigan were similar to densities recorded during the initial invasion. This seems ominous to me – a solid foundation from which beetle populations could build up again as regenerating ash grow and provide more phloem for the insect to exploit.
Ash reproduce by both flowering/seeding and sprouting from the base. EAB predation is not the only complication. First, ash are dioecious so mature trees of both sexes must grow within a few hundred meters. Second, predation by the ash seed weevil (Lignyoodes helvolus) reduces seed supplies. Dense sedge mats can prevent germination (Wilson et al. 2025). Scientists generally believe that the soil seed bank is quickly exhausted, although Wilson et al. (2025) cite others’ conflicting findings. Neither article discusses predation by mammals, e.g., deer or rabbits. Wilson et al. (2025) mention attacks by beavers.
ash saplings felled by beavers; photo by F.T. Campbell
Wilson et al. (2025) did not study whether stump-sprouted ash were able to successfully recruit into the overstory. They do report that in one study in southeastern Michigan stump sprouts were the dominant form of green ash regeneration and about a quarter of these sprouts produced seeds at least once. Deschênes et al. (2026) found that on average 47% of regenerating stems at their Ontario research sites originated from stump sprouts.
EAB has been documented to attack and kill trees when the main stem is as small as 2.5 cm. While EAB probably prefer larger stems, Deschênes et al. (2026) suggest that stems become acceptable at the lower range of size required for seed production – 8–10 cm dbh. Reliable and abundant seed production doesn’t occur until white or green ash achieve > 20 cm dbh. At their Ontario sites, Deschênes et al. (2026) found that 42% of regenerating stems has been infested by EAB at least once; 14% had been attacked five or more times. They removed 74 EAB larvae from 28 stems; 49 (66%) were alive. Fifteen EAB (16% of current year galleries) had been parasitized — all by Tetrastichus planipennisi. They also observed numerous signs of defensive responses.
In Michigan, no ash recruits — living or dead – were found in plots in 28% of the cells. In the remaining 128 cells, an average of ~33% of ash recruits were infested by EAB, and ~21.4% of ash recruits dead. As is typical, white ash fared better than green ash. Recruit sized ash trees were twice as likely to die than to survive and mature into overstory size (Wilson et al. (2025).
In Ontario, as noted, all canopy ash had died. There were 119 live trees 5 – 10 cm dbh – a tenth as many “mature” ash as when EAB arrived, and all were smaller. There was abundant regeneration in most sites initially, but at the longest-infested sites in Essex County, regenerating ash stems were half as numerous as early after the transition (Deschênes et al. 2026).
The Canadians found it encouraging that some of the regenerating stems were vigorous despite containing EAB gallery densities greater than 20 larvae·m?2 of phloem. They did not know the mechanisms underlying survival of these stems. Possible explanations ranged from the low EAB carrying capacity of smaller trees to stronger host defenses in regenerating stems to EAB mortality due to parasitism.
Wilson et al. (2025) note that despite more than 20 years of EAB presence, densities of ash recruits, saplings, and seedlings were high relative to other species. However, they remind us, ~ one-third of the live ash recruits were infested so their survival into reproductive size was uncertain. The high mortality of overstory ash results in loss of seed resources, greater sun exposure, and cascading consequences for forest composition and function. In upland sites, cells with low ash basal area favored Quercus rubra and Tilia americana. They conclude that changes to forest composition is probably site specific — largely depend on what tree species are already present.
Despite the challenges described above, the Canadian scientists also believe that these findings demonstrate that ash has a capacity for long-term regeneration (Deschênes et al. 2026).
Changing Species Composition in the U.S. (Wilson et al. 2025)
Canopy gaps caused by ash mortality have largely been filled by lateral ingrowth of species already there — American elm (Ulmus americana), black cherry (Prunus serotina), and northern red oak (Quercus rubra). The regeneration strata (saplings and seedlings) is dominated by Fraxinus (white outnumbering green when differentiated), maples (Acer rubrum, A. saccharum), black cherry, Crataegus species and Carya ovata. Elms are consistently among most common non-ash taxa among overstory, recruit, sapling and seedling strata. At some Ohio sites there was also increased abundance of non-native tree and shrub seedlings. This is not surprising since invasive plants are widespread in the forests of Ohio and other eastern states. A decade ago 93% of Forest Inventory and Analysis (FIA) plots in Ohio had at least one of 50 invasive plant species.
In another paragraph they mention Tilia americana as one of the important species in these forests.
Situation in Canada (Deschênes et al. 2026)
Deschênes et al. (2026) express concern that the death of nearly all canopy-level trees will substantially reduce ash’ ability to fulfill its ecological roles in these ecosystems. Still, ash regeneration is persisting for decades following overstory mortality. The taxon’s continued presence is driven largely by strong sprouting, which has been observed in several locations in Ontario. In some areas, low EAB infestation rates and evidence that regenerating stems can withstand multiple infestations raises hope that some might reach maturity and produce seeds. This scenario would be similar to that of elms, in which surviving trees contribute to ongoing regeneration and might eventually facilitate development of some level of resistance to the invasive fungus. A second possibility is that ash’ high sprouting capacity might point to a scenario similar to that of American chestnut. This species has persisted for a century primarily as sprouting shrubs — although they rarely reach reproductive maturity.
white fringetree; photo by Ryan Somma via Wikimedia
White Fringetree
Scientists also reviewed the status of a secondary host of EAB in North America, white fringetree (Chionanthus virginicus). Earlier studies of this host-pest relationship had been conducted on ornamental plantings where the trees tend to be scattered across open lawns and actively managed – including protection from pests. The Cipollinis (see full citation at the end of this blog) believe they might be better able to ward of EAB attack than are wild, unmanaged trees in forests that must compete for resources. They wanted to assess the current status and likely trajectory of the tree species in the wild.
To do so they revisited a wild population of the tree in southern Ohio previously assessed 10 years earlier. White fringetree is a small multi-stemmed tree native to the southeastern U.S. It is widely planted as an ornamental in across the east. In Ohio, white fringetree grows wild in only a few southern counties, in small populations or as widely scattered individuals. The species is classified as “Potentially Threatened” at the state level.
In 2015, 30% of the white fringetrees at the site were infested. These trees had signs of stress but none had died. EAB larvae grow more slowly on fringetree than on North American ash species. Meanwhile, all mature white ash trees at the site had been killed by EAB. Smaller white ash trees more comparable in size to the white fringetrees had attack rates and impacts comparable to those on the fringetrees.
In their new study, the Cipollinis found that nine of 31 trees tagged in 2015 (29%) had died; 22 (71%) were alive. Of those 22 living trees, 12 (55%) stayed the same or improved slightly over the five-year period; 10 (45%) declined. Five of these 22 living trees (23%) had evidence of current infestation. Trees that had died had a higher incidence of old EAB galleries, adult exit holes, and woodpecker activity. This is interpreted as demonstrating that EAB must cause extensive damage to kill fringetrees.
In summary, fringetrees in a wild unmanaged population continued to be attacked by EAB over 10 years and suffered higher attack rates and more significant impacts than those previously observed in managed pops. The Cipollinis conclude that trees large enough to attract EAB oviposition will continue to decline in health and be killed as long as beetles are present. They expect that wild white fringetrees might meet the same fate as ash trees, but over longer time scales.
At the same time, this delay in complete mortality might create a refugium for remnant populations of EAB after most ash have been killed. This status would be exacerbated if it turns out that the biocontrol agents cannot find their target — EAB — in the alternative host. The Cipollinis found lower parasitism rates by Tetrastichus planipennisi in fringetrees, although this was not true for the egg parasite Oobius agrili and two Spathius larval parasites.
Whitebark fringetree populations can produce few adult EAB because the trees are small and contain low amounts of phloem. Still, as young trees grow into vulnerable sizes they might help sustain the EAB population – as young ash trees in the area appear to do.
While caution is appropriate in interpreting findings from a study of a single population, the Cipollinis argue that this population has been studied intensively: assessed six times over 10 years, beginning at the start of the EAB infestation. Therefore they think their analysis provides useful informative regarding the long-term impacts of EAB on fringetree.
They concede that larger populations in areas deep within the tree’s native range might experience different dynamics and impacts. So far, however, observations in Chattahoochee National Forest in Georgia and at Great Falls Park on the Maryland-Virginia border generally support their finding that wild fringetrees in natural landscapes will suffer higher attack rates and be more severely impacted by EAB than trees in managed landscapes.
Finally, the Cipollinis fear that a close relative, pygmy fringetree, Chionanthus pygmaeus, is at particularly high risk because it is endemic to only a few counties in the sandhills of central Florida. The species is already classified as endangered by both the state and the federal governments. The pygmy fringetree is smaller than white fringetree, so its size might help it escape attack. However, adults achieve sizes comparable to that of fringetree in some cases. So when EAB reaches Florida, the specie appears to be highly vulnerable.
SOURCES
Cipollini, D. and K. Cipollini. 2026 The Fate of a Wild White Fringetree (Chionanthus virginicus) Population in Ohio 10 Years After Invasion by Emerald Ash Borer (Agrilus planipennis) Forests 2026, 17, 712
Deschênes, É., C.J.K. MacQuarrie, L. Scott, C. Zimmerman, and I. Aubin. 2026. Ash population dynamics after two decades of emerald ash borer infestations in Canada. Canadian Journal of Forest Research. Can. J. For.Res. 56: 1–13 (2026) | dx.doi.org/10.1139/cjfr-2026-0075
Wilson, C.J, L. Labbate, T.R. Petrice, T.M. Poland, D.G. McCullough. 2025. Ongoing regeneration of ash and co-occurring species 20 years following invasion by emerald ash borer. Forest Ecology and Management 580 (2025) 122546
Posted by Faith Campbell
We welcome comments that supplement or correct factual information, suggest new approaches, or promote thoughtful consideration. We post comments that disagree with us — but not those we judge to be not civil or inflammatory.
For a detailed discussion of the policies and practices that have allowed these pests to enter and spread – and that do not promote effective restoration strategies – review the Fading Forests report at http://treeimprovement.utk.edu/FadingForests.htm
Hernández‐Gutiérrez, Nichols, and Kelly (2026) (full citation at the end of the blog) analyzed interactions between this genus of beetles and oaks (Quercus species). In this context, they report that 32 Agrilus species from Africa, Asia, Europe, and North and South America use 51 Quercus species as hosts in their native range. Eighteen (56.25%) use only Quercus hosts.
Oaks that host Agrilus species cluster in several clades, i.e., the entire Section Cerris and one clade of Section Ilex and two clades of section Lobatae. Clades where Agrilus hosts are underrepresented are Sections Cyclobalanopsis and Quercus &, surprisingly, two clades in Section Lobatae.
Their analysis indicated that beetle-oak interactions involving all the 32 Agrilus species and 105 Quercus species in their study had a significant likelihood of being damaging. For example, northern red oak (Q. rubra) is already known to host six Agrilus species. Hernández‐Gutiérrez, Nichols, and Kelly (2026)’s analysis indicated that this tree species might be utilized by all 32 Agrilus species assessed. The tree’s wide distribution (both native and introduced) places it close to other known or probable hosts, which exacerbates the risk of an interaction. Another 26 Quercus species are predicted to host ten or more Agrilus species.
The model was not successful in predicting hosts of A. auroguttatus (goldspotted oakborer) in its introduced range in California.
black oak (Quercus kelloggii) in Cleveland National Forest killed by GSOB; photo by F.T. Campbell
It also predicted that few of China’s oak species might host Agrilus beetles. However, as Dr. Robert Haack notes (pers. comm. June 2026), larval hosts have been identified for only 13% of the nearly 1,200 Asian Agrilus.
Some Agrilus species have a very large number of predicted novel interactions. A. graminis and A. angustulus are predicted to have more than 40 novel oak hosts. Both have numerous known oak hosts; so their “polyphagous” nature is already documented.
Since two-thirds of 666 Agrilus species with known larval hosts exploit only one plant genus as a host in their native range, Hernández‐Gutiérrez, Nichols, and Kelly (2026) assert that they might spread faster if introduced to homogeneous rather than species-rich habitats. Dr. Haack believes that this statement is too broad (pers. comm. June 2026).
A. bilineatus; photo by Christina Butler via Wikimedia
Twolined chestnut borer
Haack and Blank (2024) document that the twolined chestnut borer, Agrilus bilineatus has preferentially infested apparently healthy English oak (Quercus robur) trees over healthy native oak trees in Michigan. In North America, A. bilineatus is a major pest of oaks and American chestnut (Castanea dentata)when they are stressed by drought or other factors. Infestation typically begins in the upper crown and proceeds downward; tree death often occurs within three years.
At several sites in southern Michigan, where English oaks were intermixed with native white oaks (Quercus alba) and close to northern red oaks (Quercus rubra), A. bilineatus preferentially infested Q. robur trees that initially appeared healthy. Further study revealed that many of the English oaks attacked had low or depleted root starch levels.
Although these findings are cause for alarm, English oak is already used by 11 species of Agrilus in Europe. Perhaps the tree and ecosystem might have sufficient defenses in Europe. Meanwhile, A. bilineatus has been reported in Turkey as of 2018; I have found no recent information about the damage whether it is causing any damage there.
Data from Britain and Worldwide
Peyton et al. (2026) reviewed the effectiveness of a “horizon scanning” exercise conducted for Great Britain (England, Scotland and Wales). They report that 3,248 recognized non-native species have been detected in Great Britain, of which 2,016 have established self-sustaining populations. Some 194 (~10%) are considered invasive, that is, have negative impacts on biodiversity and wider ecosystem viability. These consist of 108 terrestrial species, 47 freshwater species, and 39 marine species. These bioinvaders cost the British economy an estimated ~£3.9 billion per year (the bulk of the damage is attributed to ash dieback, caused by the fungus Hymenoscyphus fraxineus).
In the decade between completion of the “horizon scan” and the present, 143 species were recorded as being introduced. The horizon scan predicted 31 of these species, 22%. Peyton et al. (2026) consider this to be success.
Peyton et al. (2026) report that globally, ~ 6% of non-native plant species are ranked as invasive. Among invertebrates, this proportion rises to 22%. Considering vertebrates introduced to Europe or North America, the figure is more than 50%!! I welcome global data that support my call for rethinking the “rule of tens” long relied on for estimating the proportion of non-native species that are invasive.
Discussing bioinvaders’ role in causing extinctions, Peyton et al. (2026) report that 30 predators have been linked to declines and extinctions of 738 vertebrate species.
Peyton et al. (2026) also discuss the difficulty in predicting an introduced species’ impacts when in some cases the time lag between introduction and presence in the wild or between establishment and spread w/in the region can last decades or even a century. They cite as an example Senecio squalidus, which escaped the Oxford Botanic Gardens in the 1700s but started to spread only during mid-1900s.
Australia
More than 300 non-native insect pests, pathogens and nematodes have established on tree or shrub hosts in Australia; 20% have caused moderate to high impacts to commercial plantations, urban forests, or trees in natural ecosystems (Carnegie et al. 2026).The rate at which non-native forest pests and pathogens have been detected in Australia has doubled since 2018 compared to earlier decades: from ~ 1.5 to ~ 3 per year. Carnegie et al. (2026) attribute this rise to greatly expanded official surveillance efforts. Still, three-quarters of the most recent detections came too late for eradication to be attempted.
The Forestwatch program (inaugurated – under a different name – in 2022) includes pathogens. I rejoice!!! Still, the target species threaten primarily tree species not native to Australia but important to commercial forestry or urban forests: Asian longhorned beetle, burnt pine longicorn (Arhopalus ferus), pine pitch canker, pine wilt disease, red turpentine beetle (Dendroctonus valens), Asian spongy moth, red needle cast, and sudden oak death. The exceptions are strains of Austropuccinia psidiinot yet intro to Australia, and eucalypt leaf blight (caused by Teratosphaeria destructans) (Carnegie et al. 2026).
Austropuccinia psidii infection on Melaleuca in Australia; photo by John Tann via Flickr
Among the introduced pests causing the greatest damage to native species are
Phytophthora cinnamomi: this soil fungus can kill 40% of the plant species in the southern portion of Western Australia – which is one of 36 “Biodiversity Hotspots” recognized by the Critical Ecosystem Partnership Fund.
Austropuccinia psidii (cause of myrtle rust) in natural ecosystems; Members of the host family Myrtaceae occur in 11 of 13 major vegetation formations on Australia. Various authorities have identified 76 species as at risk to the rust.
I hope the Australians are developing strategies for landowners to counter damage by the polyphagous shot hole borer (Euwallacea fornicatus) and its associated fungus (Fusarium euwallaceae). DMF Outbreak detected near Perth, Western Australia, in 2021 – apparently three years after the actual introduction. By June 2025 authorities had determined that it was too widespread to be eradicated, so landowners will be responsible for any management. (Carnegie et al. 2026) Impact is predicted to be greatest in urban landscapes, and cost up to AU$9.7 M per annum to manage.
Phytophthora pluvivora was first detected in Australia on an English oak, Quercus robur. However, it has since been recorded on native species in the Blue Mountains, including the critically endangered dwarf mountain pine (Pherosphaera fitzgeraldii) in a National Park.
SOURCES
Carnegie. A.J., B.A. Summerell, C. Trollip, F. Tovar, D.I. Smith, and J. McDonald. 2026. Sentinel trees for early detection of non-native forest pests and pathogens in Australia. Front. For. Glob. Change 9:1801183. doi: 10.3389/ffgc.2026.1801183
Haack, R.A. and R.B. Blank. 2025. Susceptibility of English Oak (Quercus robur) to the Twolined Chestnut Borer, Agrilus bilineatus (Coleoptera: Buprestidae): Observations from Michigan. The Great Lakes Entomologist. 57: 113-125. https://doi.org/10.22543/0090-0222.2492
Hernández‐Gutiérrez, E., R.A. Nichols, and L.J. Kelly. 2026. Combined phylogenetic and geographic data can predict plant–pest interactions with high accuracy. New Phytologist (2026) doi: 10.1111/nph.71306
Peyton, J.M., S. Rorke, D.C. Aldridge, O.L. Pescott, K. Dehnen- Schmutz, D.G. Noble, J. Sewell, A.J.A. Stewart, T. Adriaens, B.C. Beckmann, J. R. Britton, J. Brodie1, P.M.J. Brown, I.C.N. Cavadino, P.F. Clark, A.M. Dunn, J.Foster, C. Harrower, M.C. Harvey, M.C. Jackson, T. Jones, C.A. Maggs, G. Martin, F. Mathews, A.C. Mill, D. Murphy, E. Paganini, R. Payne, W. Rabitsch, T. Renals, K. Schönrogge, R.H. Shaw, G.C. Smith, P.D. Stebbing, P.A. Stroh, H. Tidbury, E. Tricarico, J. Vallet, K.J. Walker, L.E. Wood, C.A. Wood, B. Woodcock, H.E. Roy. 2026. Assessing the success of a horizon scanning approach in predicting invasive non- native species arrival. J Appl Ecol. 2026;63: https://doi.org/10.1111/1365-2664.70217
Posted by Faith Campbell
We welcome comments that supplement or correct factual information, suggest new approaches, or promote thoughtful consideration. We post comments that disagree with us — but not those we judge to be not civil or inflammatory.
For a detailed discussion of the policies and practices that have allowed these pests to enter and spread – and that do not promote effective restoration strategies – review the Fading Forests report at http://treeimprovement.utk.edu/FadingForests.htm
ash trees (Fraxinus spp.) killed by EAB along Mattawoman Creek, Prince Georges County, Maryland; photo by Leslie A. Brice
I report here on action so far on funding vital agencies in Fiscal Year 2047 (which begins on October 1, 2026). I describe the various programs roles in addressing the invasive species threat briefly in my earlier blog.
USDA Forest Service
The House Appropriations Committee approved the FY27 Interior Appropriations bill (which includes the USFS) in early June. I greatly appreciate Congress’ continued support for two USFS programs that are vitally important in protecting resilience of the Nation’s forests in the face of invasions by non-native pests and plants: Research and Development and Forest Health Management (in the State, Private, and Tribal lands division). The Trump Administration had – for the second year in a row – called for ending these programs’ specific appropriations.
Research and Development
In my testimony I had asked the Subcommittee to maintain funding for R&D at the Fiscal Year 2026 Continuing Resolution level of $308 million. Instead the Subcommittee ignored the Administration’s request and provided $295 million – a fairly small reduction under the circumstances. Funding for the Forest Inventory and Analysis (FIA) program continues to see small increases — to $34 million.
While there is no specific line item for invasive species in the R&D budget, the report does encourage the USFS to address high priority invasive species, pests, and diseases, including the emerald ash borer, an unspecified “bark beetle”, spotted lanternfly, and Spruce Budworm. The list also includes three invasive plant species: buckthorn, Amur honeysuckle, and Callery pear. This language is not tied to a specific program, so it is unclear what will actually result.
In the R&D section of the report, the Committee “recognizes the significant damage invasive species can cause throughout forests, including urban forests, and encourages the USFS to continue reforestation efforts, including through the management of woody invasive species & tree planting in urban areas.” Again, the wording seems somewhat misplaced since the R&D program does not carry out tree planting.
State, Private, and Tribal forests
I had asked the Interior Appropriations Subcommittee to maintain funding for State, Private, and Tribal forests program at the FY26 Continuing Resolution level of $310.6 million. Again, appropriators ignored the Administration’s request and provided $283,500,000 – a fairly small reduction. The Forest Health Management program was funded at $58 – of which $16 million is specified for efforts on federal lands, $42 million for helping state and tribal agencies and private landowners to manage pests on their lands.
The Subcommittee report emphasized the importance of working with Colorado to curtail spread of mountain pine beetle d associated wildfire risk. Music to my ears is the Committee’s statement encouraging the USFS to work with state & local agencies to counter the high rate of tree mortality due to the goldspotted oak borer infestation in Southern California. It advised prioritizing insect research, prevention, suppression, & mitigation projects that support community wildfire protection & State forest action plans. Since none of the members of the House Interior Appropriations Subcommittee is from California, I am pleasantly puzzled.
coast live oak (Quercus agrifolia) killed by goldspotted oak borer; Heisey County Park, San Diego County, California. Photo by F.T. Campbell
The Interior Appropriations Subcommittee expressed continued concern about poor regeneration of eastern white oak (Quercus alba). (Of course, several other tree species are also regenerating poorly but a strong lobby is tied to oaks due to their economic importance.
i’iwi – a formerly common Hawaiian honeycreeper badly suppressed by avian malaria; photo by by James Petruzzi
Hawaii’s endangered birds
I am very pleased that the House Interior Appropriations Committee has provided $1,250,000 is for continuing research to protect Hawaiian forest birds from the dire extinction threat arising from non-native mosquitoes carrying avian malaria & other pathogens.
USDA Animal and Plant Health Inspection Service
APHIS is responsible for preventing the introduction and spread of pests and invasive plants that harm agriculture, including forests. APHIS policy guides port inspections carried out by the DHS CBP. APHIS inspects imported live plants. Unlike the USFS, APHIS has the support of the Trump Administration, so funding levels have remained steady. Of course, continuing introductions of new pests and spread of established ones – and inflation – have increased the cost of countering invasions, so the agency continues to fall behind despite its relatively privileged position.
The House of Representatives adopted the FY27 Agriculture Appropriations Bill in early June. I apologize for the obscurity of the FY26 funding levels. Figures are in millions of dollars.
FY2025 enacted FY27
APHIS total $1,148 $1,157
Plant health subtotal $387.5 $387.6
Agric. quarantine $35.5 $35.5
Field crop and rangeland $12 $10
Pest detection $29 $29
Methods development $21.5 $21
Specialty crops $206.5 $209
Tree and wood pests $59 $58.6
In its report, the Subcommittee on Agriculture Appropriations did not express concern about the issues that I had raised in my testimony. Instead, it mentioned several agricultural pests, e.g., citrus greening, fruit flies, a non-native beetle threatening nut orchards, and spotted lanternfly (Lycorma delicatula). The Subcommittee also urged APHIS to work with the USDA Forest Service to counter the spread of two native wood-borers, mountain pine beetle (Dendroctonus ponderosae) in Colorado and southern pine beetle (Dendroctonus frontalis). Since both are native, APHIS’ role is unclear. The Subcommittee mentioned two invasive plants: glossy buckthorn (Frangula alnus) – saying it threatens biodiversity, especially in the Allegheny National Forest in Pennsylvania; and Carizzo cane (Arundo donax), saying it contributes to tick invasions in addition to hampering detection of human immigrants along the Rio Grande.
sounder graphic by Jack Mayer, Savannah River National Laboratory
The bill increases funding for the national feral swine management program by $500,000. (I cannot determine total the appropriation). The Agriculture Appropriations Subcommittee had urged APHIS Wildlife Services to prioritize states with the largest invasive populations – although this choice contradicts standard advice for managing invasive species, including feral swine.
In one action linked to our concerns about wood-borer introductions via wood packaging, the Subcommittee encouraged APHIS to recognize sulfuryl fluoride as a treatment for logs, wood products, & wood packaging. This fumigant has been accepted under the international (ISPM#15) since 2013.
wooden pallets discarded next to wooded border in Glacier National Park, Montana; photo by F.T. Campbell
Posted by Faith Campbell
We welcome comments that supplement or correct factual information, suggest new approaches, or promote thoughtful consideration. We post comments that disagree with us — but not those we judge to be not civil or inflammatory.
For a detailed discussion of the policies and practices that have allowed these pests to enter and spread – and that do not promote effective restoration strategies – review the Fading Forests report at http://treeimprovement.utk.edu/FadingForests.htm