Recent information raises several troubling/worrisome issues:
1. The overall collapse in trade and travel has severely cut into the collection of user fees. These fees pay for Agriculture Quarantine Inspectors, putting jobs at risk. Their inspections provide important incentives for importers to follow U.S. and international rules to limit pests.
2. The list of imports from China in 2020 includes $1 billion worth of nursery stock. This is down about 7% from 2019. However, from the perspective of preventing plant diseases and pests, these imports continue to be high risk and still not adequately addressed by U.S. policy.
3. Other Asian regions are gaining in import share. Thus we can expect to see more pests arriving from countries other than China, like Vietnam.
Loss of User Fees Could Mean Loss of Inspectors
The collapse of trade and travel has a more troubling result: severe reductions in user fees collected from travelers and importers to fund DHS/Customs and Border Protection Agriculture Quarantine Inspectors. In a recent opinion piece, several former administrators of APHIS warn that current user fee collections are insufficient to sustain inspectors’ employment. A reserve fund will also be depleted this month. APHIS estimates that it will require an appropriation of $630 million to fund these agricultural inspections through the next fiscal year (October 2020 – September 2021).
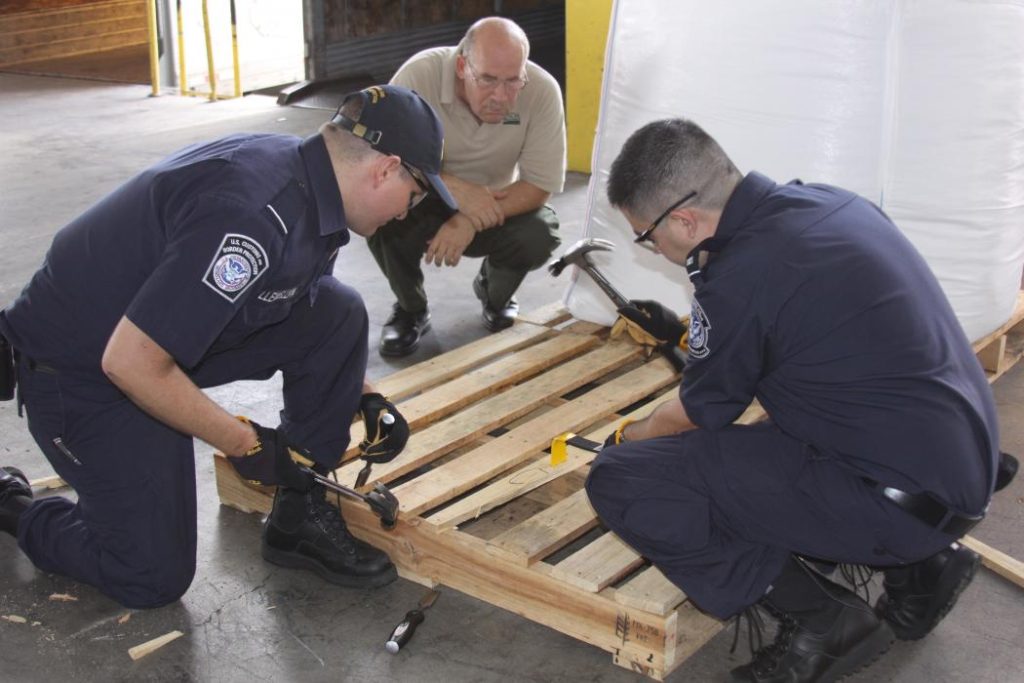
Agricultural inspectors focus on plant and animal imports – including horticultural stock, seeds, fruits, and vegetables – both in commercial shipments and in passengers’ baggage. They are also called in when CBP inspectors suspect pests are present in wood packaging.
I do not consider inspection to be the most effective strategy to prevent introductions. That is, I think inspections are less effective than regulations requiring treatments and pre-shipment pest-mitigation measures. However, losing inspectors – even temporarily – will undermine detection and enforcement as an incentive for importers to comply with U.S. and international rules. This funding crisis is therefore a serious concern. Please ask your senators and member of Congress to support increasing the appropriation for DHS CBP by $650 million to keep these inspectors on the job.
Imports from Asia Skyrocket
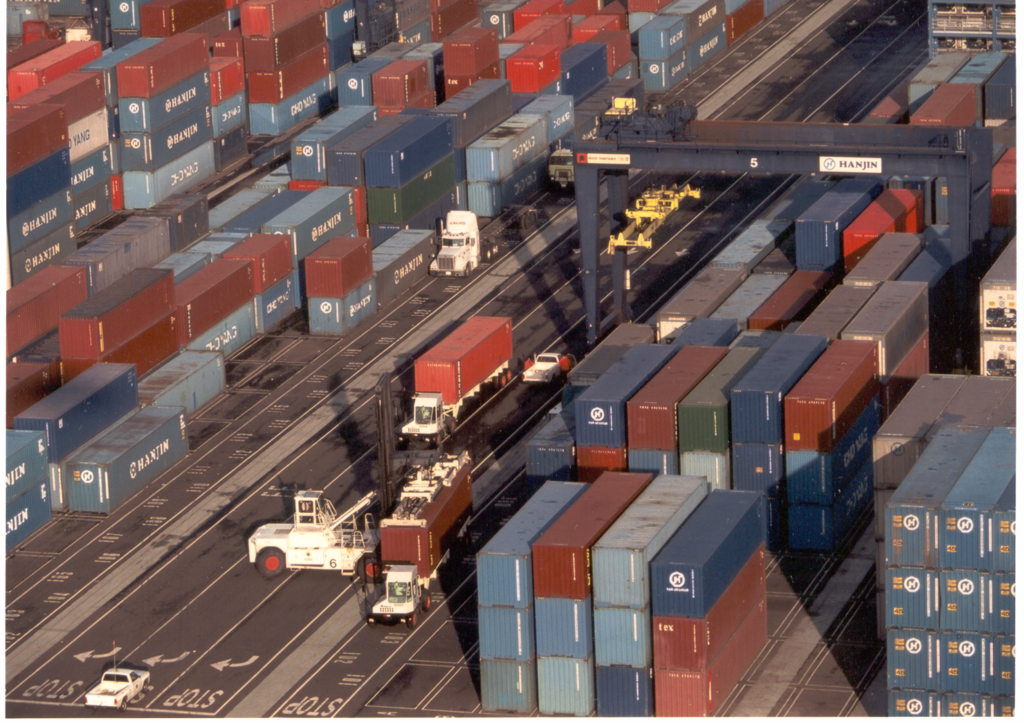
New data show that containerized US import volumes from Asia rocketed 91% between March and August. During the same five-month period a year ago, import volumes rose only 36% — so the 2020 increase is more than double the earlier pace. Numbers of incoming containers from Asia nearly doubled at the ports New York/New Jersey; Los Angeles/Long Beach, California; and Savannah, Georgia. The California ports are reported to be working nearly at capacity. This has resulted in higher handling costs and delays in trucking imports out of the port to their destinations.
Import volumes from Vietnam and India continue outpace the market generally.
Update: Imports from China Continue to Decline Relative to Other Source Regions
In August I posted a blog reporting a significant reduction in imports from China recently – first as a result of new tariffs in 2019, and second, as a result of the global economic crash associated with the Covid-19 virus.
Imports from China decreased by 16% in 2019 compared to 2018, then rose slightly in the first months of 2020. My focus then – and now – is on declining imports of heavy goods — the types of imports most likely to be packaged in wooden crates or on wooden pallets that can transport pests.
Import volumes from China rose later in the year, as the U.S. economy began to rebound. Official data from the U.S. Bureau of the Census shows US imports from China had more than doubled (by value) since March — from $19.8 billion in March to $40.7 billion in July. Still, imports of heavy items and most consumer items – other than computers – have decreased in 2020 compared to 2019.
Included in this list of imports is $1 billion worth of nursery stock – down about 7% from 2019. Nursery stock imports are rarely included in Census reports, so I value this information. Of course, these imports – even ‘though declining – still represent a series plant pest risks. One study showed that imported plants carry a pest risk 12 times higher than wood packaging material (Liebhold et al. 2012; see full reference at end of blog).
Important Shifts in Sources of U.S. Imports
Data show a broad and years-long decline in the share of U.S. imports that come from China. This decline is best seen in declining volumes of imports arriving at the ports of Los Angeles, Long Beach, Northwest Sea Alliance and another port in the region. Imports arriving at these ports declined 5.3% in May 2019 compared to May 2018. At that time, this decline was blamed on importers having stocked up in advance of threatened US tariffs on goods from China. Bureau of the Census data show a 2% reduction in loaded twenty-foot-long containers (TEUs) entering Long Beach in calendar year to date 2019 compared to calendar year to date 2020 (through August).
Commercial data sources indicate even larger declines. According to the Journal of Commerce, the twin ports of Los Angeles and Long Beach handled 37.7% of the loaded TEUs entering the United States in 2018. This fell to 33.5% in July 2020 — a drop of 4.2 percentage points in just 18 months. The author of this article said the reason was a fall in imports from East Asia (including China, Hong Kong, Japan, South Korea, and Taiwan) compared to Southeast Asia, Europe, then South America and, finally, South Asia (primarily India). The article provides a table quantifying shifting sources of U.S. imports:
Total US Market Share Imports by Source Region
SOURCE 2018 2019 2020YTD 2018-2020 change
East Asia 61.6% 58% 54.5% -7.1%
Europe 14.9% 15.8% 16.9% +1.9%
Southeast Asia 8.3% 10.5% 11.9% +3.6%
South America 8.2% 10.5% 11.9% +3.6%
South Asia 2.7% 3.1% 3.1% +0.5%
Other source regions – e.g., the Caribbean, Middle East, Pacific, Africa, and Atlantic – were all below 2% of total numbers of TEU in all three years, and changed not at all or minimally over this period.
As I noted in the earlier blog, the pest risk persists. First, imports from China continue, and the most recent data (for the period 2011-2016) indicate significant numbers of shipments continue to be in violation of requirements for wood packaging (APHIS database / pers. comm). Remember, USDA passed up an opportunity to raise the issue of non-compliant wood packaging with Chinese phytosanitary officials.
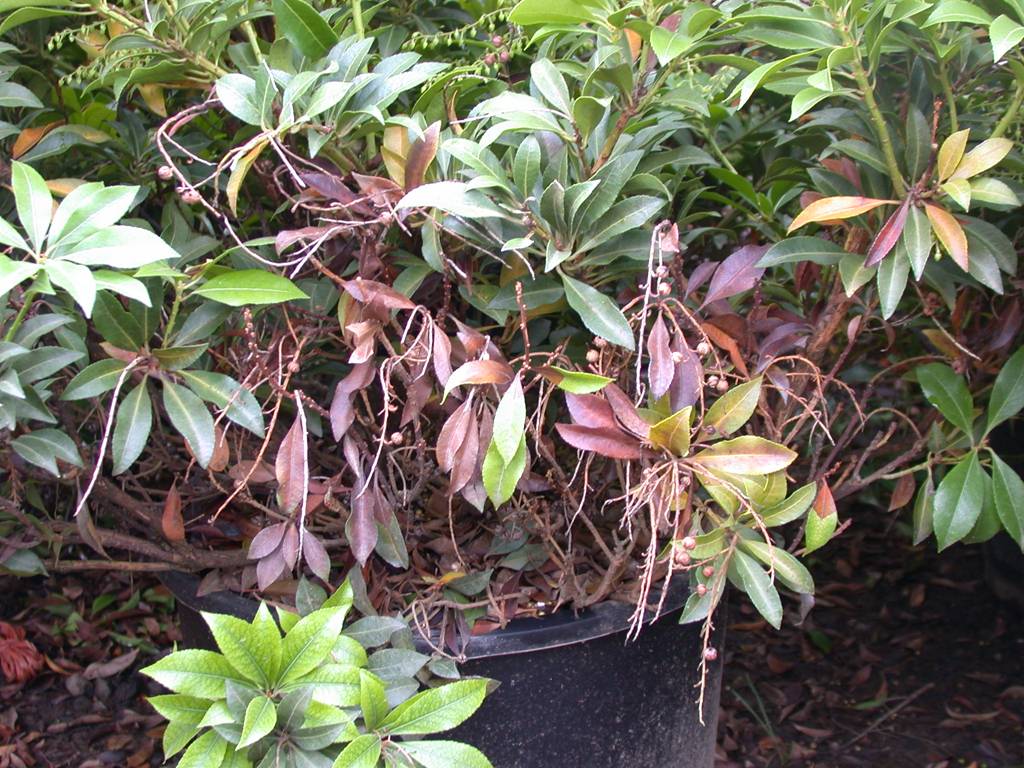
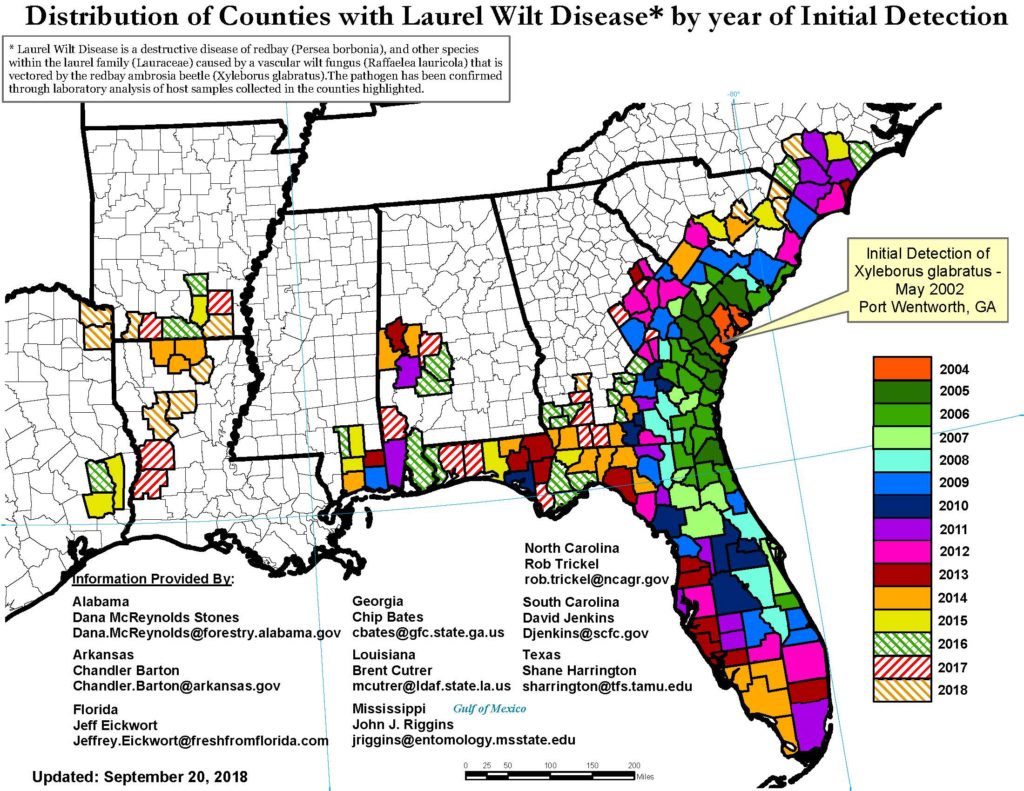
Plus other regions also are the source of pests. I wrote about the risk from Mexico in the previous blog. The region of Southeast Asia has already been the source of highly damaging pests, e.g., redbay ambrosia beetle and polyphagous shot hole borer.
Scientists have also detected numerous known and previously unknown species of the brown alga genus Phytophthora in Vietnam and Taiwan. Of course, this is the genus that includes the pathogens that cause sudden oak death, black ink disease, potato blight, and numerous other plant diseases. APHIS has not accepted my urging to undertake rapid assessments of the vulnerability of North American trees to these newly discovered microbes.
SOURCE
Liebhold, A.M., E.G. Brockerhoff, L.J. Garrett, J.L. Parke, and K.O. Britton. 2012. Live Plant Imports: the Major Pathway for Forest Insect and Pathogen Invasions of the US. www.frontiersinecology.org
Posted by Faith Campbell
We welcome comments that supplement or correct factual information, suggest new approaches, or promote thoughtful consideration. We post comments that disagree with us — but not those we judge to be not civil or inflammatory.
For a detailed discussion of the policies and practices that have allowed these pests to enter and spread – and that do not promote effective restoration strategies – review the Fading Forests report at http://treeimprovement.utk.edu/FadingForests.htm