I have blogged often about the pest risk of wood packaging associated with imports from Asia – especially China – and the shift in that risk arising from import volumes and ports at which they are arriving (increasing volumes entering country at ports along Atlantic and Gulf coasts). [See blogs posted on this site, under the “wood packaging” category (listed below the archives by date).] As noted, U.S. imports from Asia are at all-time highs: in the first three months of 2022, they reached 1.62 million TEU (shipping containers measured as twenty-foot equivalents). This was 31.1% higher than in the same period in pre-pandemic 2019 (Mogelluzzo, B. April 22, 2022).
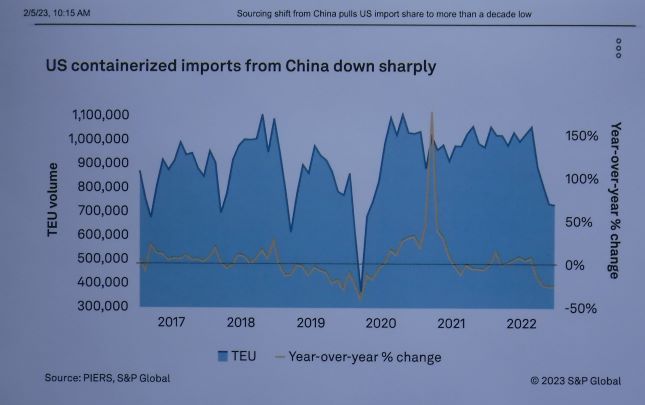
The most recent information (Szakonyi, M. 2023) confirms that U.S. importers are shifting suppliers to countries other than China, primarily because of lengthy shutdowns in Chinese factories linked to the “0 COVID” policy and some U.S. restrictions and tariffs. Over 2022 (full year), China – including Hong Kong – supplied 40.7% of U.S. imports. This is still a huge proportion, but lower than in 2021, when it was 42.4%. The Journal of Commerce calculates that the number of containers coming from China fell by 435,000. At the current rate of infestation in wood packaging from China calculated by Haack et al. 2022, that might mean about 1,200 fewer containers from China with infested wood packaging entering the U.S.
[Explanation of calculations: I divided 435,000 by 2 to convert 20-ft TEU into 40-ft containers that CBP encounters at the ports; multiplied the result by 0.75 – based on the decade-old Meissner estimate of % of containers that have SWPM; then multiplied the result by .0073 because that is infestation rate for China during 2010-2020 period]
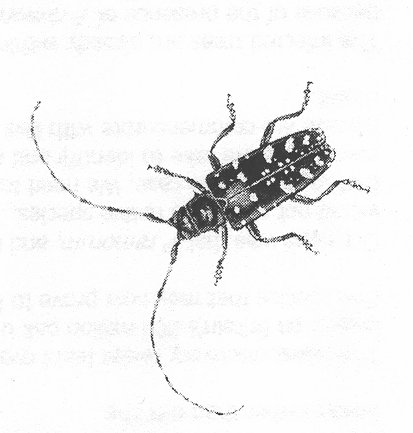
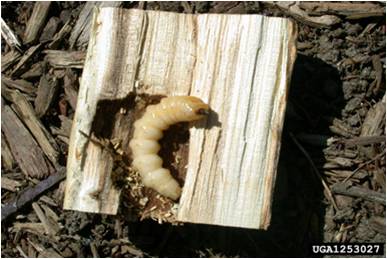
This might be progress. China continues to have a terrible record of non-compliant wood packaging 23 years after U.S. and Canada instituted phytosanitary requirements. According to Haack et al. (2022), packaging from China made up 4.6% of all shipments inspected under the terms of their analysis, but 22% of the 180 consignments with infested wood packaging. Thus the proportion of Chinese consignments with infested wood is five times greater than expected based on their proportion of the dataset. The rate of wood packaging from China that is infested has remained relatively steady = 1.26% during 2003–2004, 0.73% during 2010 – 2020. And the insects present belong to the group that causes the greatest damage: longhorned beetles (Cerambycids). Indeed, 78% of beetles in this family that were detected were from China.

There is some good news: some types of goods likely to be enclosed in crates have decreased notably. The proportion of furniture and other home items imported from China has declined from 71.6% of all U.S. imports in 2010 to 52.6% in 2022. As Haack et al. (2022) found, crates are the type of wood packaging where wood pests are most commonly found. While crates constituted only 7.5% of the wood packaging inspected, they made up 29.4% of the infested packaging – or four times greater than their proportion of the dataset.
The pest risk might not be changing significantly, however, because some of the new suppliers are also in Asia. Vietnam’s share of U.S. imports rose from 8.2% to 8.7%. The types of goods most often imported from Vietnam included electronics, shoes, and apparel. The U.S. has already been invaded by insect-pathogen complexes native to Vietnam, Taiwan, and other parts of southeast Asia – e.g., redbay ambrosia beetle and laurel wilt; invasive shot hole borers and Fusarium disease.
U.S. imports from South Korea, mostly electronics and autoparts, climbed from 3.8% to 4.1%. Imports from India also saw a tiny increase – from 3.8% to 3.9%. These shipments were primarily apparel and iron and steel components. These goods prompt concern because wood packaging associated with heavy materials are often infested by insects (Eyre et al. 2018). The Haack et al. (2022) analysis found two interceptions of wood packaging from Vietnam, one from Korea, and three from India.
Besides, the Journal of Commerce notes that shifts in suppliers cannot go far. These countries’ manufacturing capacity and transportation infrastructure are far below those of China (Szakonyi, M. 2023).
In February 2023, U.S. imports from Asia continued to decline from record levels in 2021 and 2022 to 1.09 million TEU. This level still exceeds by 25% the 869,091 TEU recorded in March 2020, at the beginning of the COVID-19 shutdown (Mongelluzzo, March 17, 2023).
[Reminder: higher shares of imports from Asia are going to ports along the Atlantic and Gulf coasts – spreading the risk. See earlier blogs. In early March the Port of Savannah posted an advertisement to the on-line Journal of Commerce, crowing that by July it will complete straightening the river at the Garden City Terminal (the container terminal). This fix will enable Savannah to raise its annual container processing capacity by 1.5 million TEU, to 7.5 million.]
The most hopeful finding is that imports from Mexico jumped 19.2% in the first 11 months of 2022 compared to the same period in 2021. Importers have their reasons: a desire to buy from producers closer to the U.S. market. These motivations have nothing to do with the risk of forest pest introductions. However, we can rejoice because Mexico has greatly improved the pest-infestation rates of its exports since 2009. The rate fell from 0.29% in 2003-2004 to 0.04% in 2010-2020 (Haack et al. (2022).
I remain outraged that U.S. agencies have not taken effective steps to deal with the nearly 25-year-long problem of Chinese noncompliance with our phytosanitary requirements. As I noted in my previous blog, link to blog 303 Customs and Border Protection officials are disappointed that their enhanced enforcement in 2017 and 2021 has not yet resulted in improved compliance.
I suggested that the U.S. and Canadian government agencies should penalize trade partners with high records of not complying with ISPM#15. Among steps they should consider are
- U.S. and Canada should refuse to accept wood packaging from foreign suppliers that have a record of repeated violations – whatever the apparent cause of the non-compliance. Institute severe penalties to deter foreign suppliers from taking devious steps to escape being associated with their violation record.
- APHIS and CBP and their Canadian counterparts should provide guidance to importers on which foreign treatment facilities have a record of poor compliance or suspected fraud – so they can avoid purchasing SWPM from them. I greatly regret that the death of Gary Lovett might put an end to the voluntary industry program he had been developing, described here.
- Encourage a rapid switch to materials that don’t transport wood-borers. Plastic is one such material. While no one wants to encourage production of more plastic, the Earth is drowning under discarded plastic. Some firms are recycling plastic waste into pallets.
Haack et al. 2022 fully describes the methodology used, the structure of USDA’s Agriculture Quarantine Inspection Monitoring (AQIM) program, detailed requirements of ISPM#15, the phases of U.S. implementation, etc. Also see the supplemental data sheet in Haack et al. (2022) that compares the methods used in each analysis.
SOURCES
Eyre, D., Macarthur, R., Haack, R.A., Lu, Y. and Krehan, H., 2018. Variation in inspection efficacy by member states of wood packaging material entering the European Union. Journal of Economic Entomology, 111(2), pp.707-715.
Haack RA, Hardin JA, Caton BP and Petrice TR (2022) Wood borer detection rates on wood packaging materials entering the United States during different phases of ISPM#15 implementation and regulatory changes. Frontiers in Forests and Global Change 5:1069117. doi: 10.3389/ffgc.2022.1069117
Meissner, H., A. Lemay, C. Bertone, K. Schwartzburg, L. Ferguson, L. Newton. 2009. Evaluation of Pathways for Exotic Plant Pest Movement into and within the Greater Caribbean Region. A slightly different version of this report is posted at 45th Annual Meeting of the Caribbean Food Crops Society https://econpapers.repec.org/paper/agscfcs09/256354.htm
Mongelluzzo, B. Q1 US imports from Asia show no slowing in consumer demand. Apr 22, 2022. https://www.joc.com/maritime-news/container-lines/q1-us-imports-asia-show-no-slowing-consumer-demand_20220422.html
Mongelluzzo, B. US imports from Asia hit three-year low in February: data. https://www.joc.com/article/us-imports-asia-hit-three-year-low-february-data_20230317.html
Szakonyi, M. 2023. Sourcing shift from China pulls US import share to more than a decade low. https://www.joc.com/article/sourcing-shift-china-pulls-us-import-share-more-decade-low_20230201.html
Posted by Faith Campbell
We welcome comments that supplement or correct factual information, suggest new approaches, or promote thoughtful consideration. We post comments that disagree with us — but not those we judge to be not civil or inflammatory.
For a detailed discussion of the policies and practices that have allowed these pests to enter and spread – and that do not promote effective restoration strategies – review the Fading Forests report at http://treeimprovement.utk.edu/FadingForests.htm
or