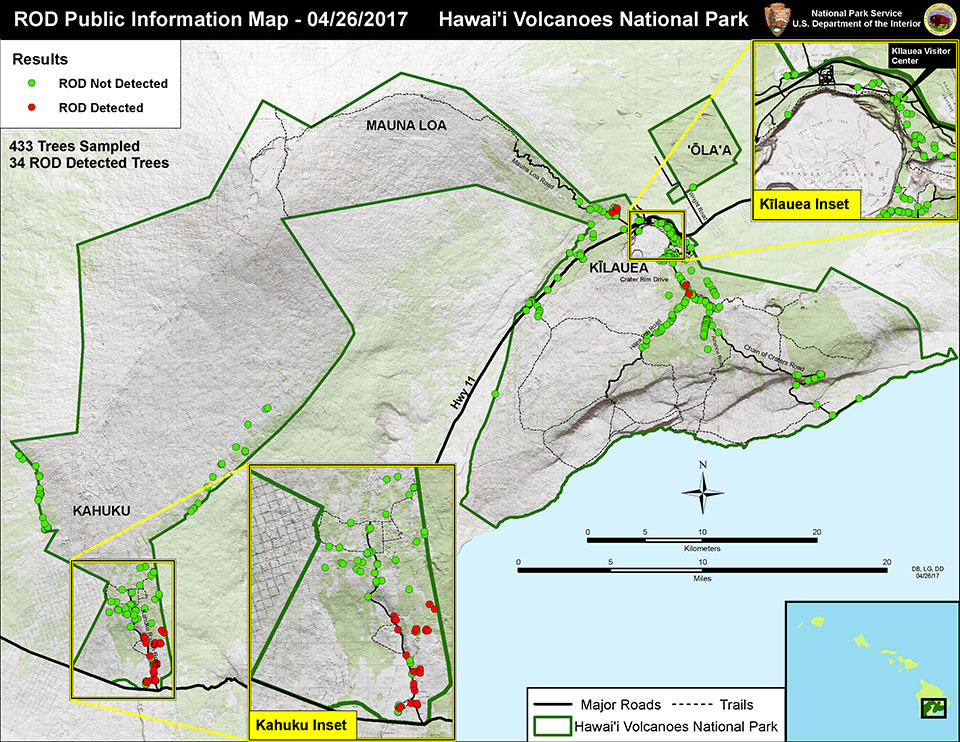
map showing locations in Hawaii Volcanoes National Park of ʻōhiʻa infested by rapid ʻōhiʻa death; NPS map available here
The U.S. Department of Agriculture’s adoption of a new list of plant species barred from importation pending pest risk assessment after a four-year wait (NAPPRA) [see my previous blog from June 21, here] prompts me to review what I know about pests associated with plant imports – and to appeal for collaboration among non-USDA scientists to improve our understanding of current risks. Therefore I’m sharing some pest import and establishment data. I welcome the opportunity to work with experts to evaluate the level of risk and other matters that might be extracted from these data. Contact me to explore how we might work together.
As was pointed out by Eschen et al. 2015 (see list of sources at the end of this blog), most countries’ data on the “plants for planting” pathway are inadequate to allow an assessment of phytosanitary measures’ efficacy in preventing pest introductions. The authors stressed the need for data on:
- plant imports at the level of genus, including plant type and origin;
- pest arrival rates on each of these categories of plant imports; and
- pest establishments.
In the apparent absence of agencies’ efforts to close these data gaps, I propose that we work together, using available information, to improve our understanding of the current level of risk. Perhaps we can agree on which pest species are real red flags; decide which pathways most need new policy approaches; and reach conclusions about the implications of holes in the data.
- What Do We Know About Plant Imports?
The U.S. imports approximately 2.5 billion plants each year. The plants most likely to transport insects or pathogens that would attack North American trees and shrubs are woody plants. According to Rebecca Epanchin-Niell, during the period FY2010-FY2012, Americans imported each year more than 300 million woody plant units, belonging to about 175 genera.
Marcel Colunga-Garcia and colleagues analyzed plant import data for the period 2010-2012. They studied maritime (ship-borne) containerized plant imports, which represented 64.4 percent of the total value of all “plants for planting” imported into the U.S. in 2010, excluding imports from Mexico and Canada. The types of plants shipped in this way include rooted plants in pots; bare root plants; bulbs and tubers; root fragments, root cuttings, rootlets or rhizomes; rooted cuttings; unrooted cuttings; and budwood/graftwood.
Measuring by the plants’ import values, Colunga and colleagues determined that New York and Los Angeles metropolitan areas together import 60 percent of these plants; not all plant imports are routed through Miami – as is often assumed.
Second, these data show which states are the ultimate destination for relatively large volumes of certain types of plants. Thus, the top five states for receipt of rhododendrons and azaleas were Michigan, Oregon, California, New York, and New Jersey. Michigan received almost twice as many plants (measured by value) as New Jersey. The top three states for receipt of “fruit and nut trees and shrubs” were Florida, Louisiana, and Washington – all at nearly $1 billion or higher. California and North Carolina ranked fourth and fifth, but at values of only $200,000. It is clear from these data that contaminated plants could deliver pests virtually anywhere in the country.
Because my focus is on insects or pathogens that threaten native trees, I wish to separate those from pests that attack primarily herbaceous plants. (Of course, herbaceous plants are important components of ecosystems, as well as premier agricultural and horticultural crops! I do not mean to imply that pest threats to herbaceous plants are not important.)
About nine million of the 300 million woody plants imported to the U.S. each year belong to genera which also contain species of trees native to North America. A larger number of plants – 224 million – were in the same family as a North American native tree (Epanchin-Niell 2017). In other words, about 75% of the woody plants imported each year were in the same family as at least one species of tree native to North America.
Since plants in the same genus are more likely to transport damaging pests that would attack North American trees and shrubs, some have suggested that all such imports should be prohibited temporarily, using the NAPPRA process.
- What Do We Know About Pest Arrivals? (Including Detection Difficulties)
Liebhold et al. 2012, relying on 2009 data, found that about 12 percent of incoming plant shipments had symptoms of pests – a rate more than 100 times greater than that for wood packaging — a pathway that has received far more international and U.S. regulatory attention for years. This finding is similar to that of a study in New Zealand, which found that 14 percent of consignments of plants were infested – primarily with pathogens (Epanchin-Niell 2017). Worse, though, Liebhold et al. found that a high percentage of pests associated with a plant shipment is not detected by the inspectors, although APHIS has disputed this finding.
At my request, APHIS analysts compiled a list of imported woody plant genera on which pests were detected during fiscal years 2011-2016. Of the 360 quarantine pests listed, only 34 were designated as “disease” (nine percent of the total). I suspect this is significantly below the actual number entering the country.
Table 1. Overall number of pest detections recorded*
| Fiscal Year | # of records | # of countries of origin for shipments found to be infested |
| 2011 | 133 | 16 |
| 2012 | 110 | 14 |
| 2013 | 42 | 12 |
| 2014 | 27 | 9 |
| 2015 | 45 | 12 |
| 2016 | 14 | 5 |
* My totals do not include shipments from Puerto Rico; there were six pest detections on plants from the Commonwealth.
I cannot explain why the total number of detections shown in Table 1 nor – especially – the number of countries from which these infested shipments arrived fell so dramatically in FY2016. If APHIS was focused on inspecting the highest-risk shipments in FY15 and FY16, shouldn’t the number of interceptions have risen?
Pathogens are probably undercounted in Table 2 because inspectors experience great difficulty in detecting pathogens during port-of-entry inspections. For example, the genus Phytophthora does not appear in the database of port interceptions, yet we know that Phytophthora are being introduced. Also, the database does not contain the genus Rhododendron. It seems unlikely that no quarantine pests were detected on a shipment of Rhododendron over that six-year period.
Table 2. Types of Pests Intercepted
Disease 34
Insect 290
Mite 20
Mollusk 23
Nematode 2
APHIS’s interception records are not designed as a statistically valid sample for determining the total number of pests on shipments because, for example, inspection priorities and resultant inspection criteria change over time. Since 2015 APHIS has focused more on higher-risk shipments. Before, a specified percentage of all imports was inspected. For these reasons, interception records cannot be used to evaluate the overall risk of pests being imported along with “plants for planting” in any given year. Nor can APHIS’ interception records be compared over time.
Obviously, the numbers of pests detected on a specific type of import will reflect several factors, especially the volume of imports and the intensity of inspection. This bias in the data is reflected in the high number of pest interceptions from Central American countries – from which the U.S. imports very large volumes of plants. Two hundred twenty of the 385 pest detections recorded over the six-year period (57 percent) were on plants shipped from Costa Rica or Guatemala. Canada ranked third, with 35 pest detections (nine percent of the total).
That said, each record reflects a detection of a taxon of animal or pathogen that APHIS considers to be a “plant pest”. Each time a particular species is detected in a shipment, it is recorded. If more than one species is detected in a shipment, each species is reported separately. Therefore,
- the number of detection records does not equal the number of shipments found to be infested;
- the records do not reveal the number of specimens of each named taxon – either in an individual shipment or in total; and
- the number of times a taxon appears in the database does indicate how many shipments were found to be infested by that taxon.
- Principal Threats to North America’s Native Trees and Shrubs
APHIS and I agree that our focus should be on those pests likely to have significant consequences if they are introduced. This risk of impact depends on climate, presence of probable hosts in the U.S., and other factors. Among the highest risk sources of imports for most the U.S. will be temperate countries, like those below. APHIS assigns a lower rating of risk to pests that are likely to be established in the U.S. already or to establish naturally – e.g., pests native to northern Mexico near the U.S. border.
Table 3. Main Temperate Countries of Origin for Infested Shipments by Year
FY2011: Germany, Japan, Turkey, Netherlands, France, Pakistan, Canada, New Zealand
FY2012: Israel, Canada, South Korea, China, Chile, Netherlands
FY2013: France, Canada, Belgium, China
FY2014: China, Canada, South Africa, Portugal
FY2015: China, Germany, Netherlands, Canada, France, Australia
FY2016: Canada
We can also look at the host plants on which pests are being intercepted to think about threats. Table 4 shows these. Presumably, the volume of trade in these genera, from the countries concerned, is sufficient to preclude any listing of these hosts under the NAPPRA regulatory process (see blog from June 21).
Table 4. Host Genera on which Pests Were Intercepted, Including only Genera Native
to North America or U.S. Islands or Important in Ornamental Plantings
Plant genus # records — countries of origin — types of pests
Acer 7 — primarily Canada; also Netherlands & Korea – 2 disease, 4 insect, 1 mite
Buxus 3 – all Canada – 2 insect, 1 mollusk
Camellia 2 – France – 1 disease, 1 mite
Chamaecyparis 1 – Canada; mite
Cycas revoluta 8 – Honduras, Costa Rica, Dom. Rep. – insects
Fagus 6 – Netherlands, Belgium; insects (aphids primarily)
Hibiscus 4 – France, Tahiti, Canada – 1 disease, 1 insect, 1 mite, 1 mollusk
Ilex 3 – Canada & NL – 2 insects, 1 disease
Liriodendron 2 – Canada – insects
Magnolia grandifolia 1 – South Africa – insect
Opuntia 6 – Mexico – insects
Picea 7 – Canada – insects (primarily aphids)
Thuja 6 – Canada – insects
Tilia 2 – Canada – mollusk
- What Else Do We Know?
If we look at pests introduced via all pathways, unlike those above, U.S. pest-establishment data show that plant pests continue to be introduced, but at a slower pace in recent years. In its Implementation Plan for Section 10201 of the Food, Conservation and Energy Act of 2008, USDA APHIS said that between 2001 and summer 2008, 212 pests were reported as new to the United States – an average of 30 new pest introductions each year. An APHIS database of plant pests “newly detected” during fiscal years 2009 – 2013 listed approximately 90 new taxa of plant pests as detected during this period – approximately 22 each year. In its annual report for 2016, the agency reported detecting 16 species of plant pests not previously detected in the U.S.
I think that approximately 37 of the 90 “new” pests detected over the 2009-2013 period were probably introduced via imports of plants, cuttings, or cut foliage or flowers. These include all the viruses, fungi, aphids and scales, whiteflies, and mites. I have asked APHIS to give me a database of newly detected plant pests for fiscal years 2014-2015, but the agency has not done so.
Among tree-killing pests introduced over the past 160 years, approximately 69% were introduced via the live plant trade. Liebhold et al. 2012 found that 95% of sap feeders, 89% of foliage-feeding insects, and 47% of pathogens were introduced via this pathway.
Pathogens are probably undercounted here, too, since those that do not cause massive damage are probably overlooked. Of the approximately 90 pests newly detected 2009-2013, ten were fungi, four were viruses, and two were rusts (18 percent of the total).
The genus Phytophthora does not appear in the database of “newly detected” pests. Yet we know that Phytophthora are being introduced. We know that, in 2012 a Phytophthora new to the United States — Phytophthora tentaculata — was detected on nursery-raised herbaceous plants in California. Follow-up studies have detected several additional Phytophthora taxa that might be new to the United States. One, P. quercina, had previously been reported only in Europe and Western Asia. The other putatively new taxa are still being evaluated as to whether they are previously unknown species or hybrids, and whether they are native to California or elsewhere in the United States, or are of alien origin.
The presence of the EU1 strain of Phytophthora ramorum in several nurseries in Washington, California, and most recently Oregon is also evidence that introductions of this species have continued since it was designated as a regulated pest in 2003.
Another pathogen that has apparently not been included in the official data is the fungus which causes rapid ʻōhiʻa death – a strain of Ceratocystis fimbriata. Scientists do not yet know whether this strain was introduced directly to Hawai`i on a recently-imported, asymptomatic plant; or whether the strain evolved from one or more different strains introduced to Hawaiʻi recently or longer ago.
Can you help evaluate the level of risk associated with various plant taxa, types, and origins? and other matters that might be extracted from these data. Perhaps we can agree on which pest species cause greatest concern; decide which pathways most need new policy approaches; and reach conclusions based on holes in the data. Can we use the data on pest taxa that underlie this summary – data which I have – to strengthen the case for USDA to promptly finalize revision of its “plants for planting” (“Q-37”) regulations (see my blog from June 21 and Chapter 4 of the Fading Forests report?
Contact me to explore how we might work together.
Posted by Faith Campbell
We welcome comments that supplement or correct factual information, suggest new approaches, or promote thoughtful consideration. We post comments that disagree with us — but not those we judge to be not civil or inflammatory.
SOURCES
Colunga-Garcia M, Haack RA, Magarey RD, Borchert DM (2013) Understanding trade pathways to target biosecurity surveillance. In: Kriticos DJ, Venette RC (Eds) Advancing risk assessment models to address climate change, economics and uncertainty. NeoBiota 18: 103–118. doi: 10.3897/neobiota.18.4019
Epanchin-Niel, R.S. 2017. Presentation to 28th USDA Interagency Research Forum on Invasive Species. January 2017.
Eschen, R., K. Britton, E. Brockerhoff, T. Burgess, V. Dalley, R.S. Epanchin-Niell, K. Gupta, G. Hardy, Y. Huang, M. Kenis, E. Kimani, H.-M. Li, S. Olsen, R. Ormrod, W. Otieno, C. Sadof, E. Tadeau, M. Theyse. 2015. International variation in phytosanitary legislation and regulations governing importation of plants for planting. Environmental Science and Policy 51 (2015) 228-237
Liebhold, A.M., E.G. Brockerhoff, L.J. Garrett, J.L. Parke, and K.O. Britton. 2012. Live Plant Imports: the Major Pathway for Forest Insect and Pathogen Invasions of the US. www.frontiersinecology.org