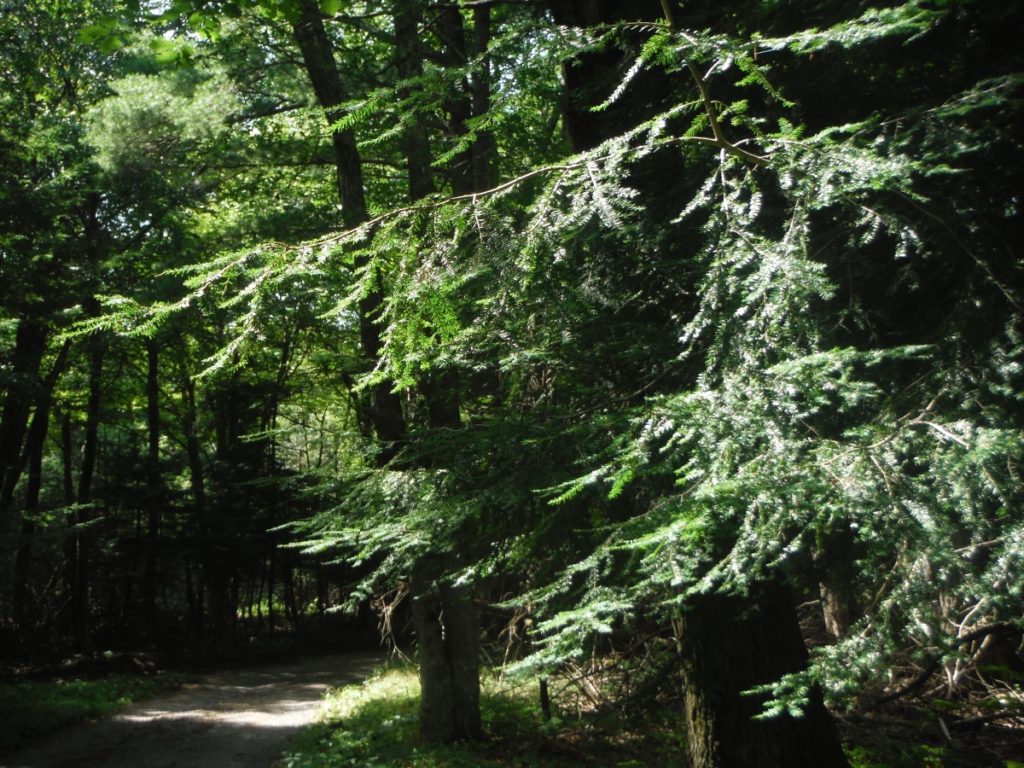
photo by Nate Siegert
As I reported in December, the USDA Forest Service Forest Health Management program has been issuing reports on the status of pest invasions, based on annual national Insect and Disease Surveys (IDS). This survey is carried out by low-level aerial surveys of statistically valid geographic units. (For a discussion of quadrat establishment, see the Introduction to the 2019 report here.
Here I compare the pest situation as it appeared in two recent years, based on these surveys: 2017 and 2018.
Of course, two years is too short a time to see trends. The second report provides USFS scientists attempt to provide context by analyzing 20 years of data (Chapter 6 of the 2019 report).
These reports are important sources of data on the status of non-native pests in our forests, but I raise several caveats that necessitate our continuing to rely on additional sources, some of which I have cited in previous blogs. I will address these in greater detail below. But in brief, these caveats are:
1) Major pests – both in extent and damage caused – are not adequately included (see below).
2) The survey technique resulted in delays in detecting mortality. It cannot be used as an early detection tool.
3) There is little analysis of the statistics cited.
Why Stakeholders Cannot Rely on These Two Survey Reports Alone
I hope stakeholders, analysts, and decision-makers will utilize the full range of reports and other data to evaluate the presence and impacts of various invasive pests and pathogens. Even the reports’ authors advise decision-makers to use other forest health indicators in addition to this report. It is not the “fault” of the authors that these reports cannot serve all needs. However, we all need to be aware this caveat.
1. Important Pests Not Adequately Included.
Many of the most damaging non-native pests caused extensive damage before these surveys were initiated. These include white pine blister rust, chestnut blight, Dutch elm disease, butternut canker, Port-Orford cedar root disease, European gypsy moth, and balsam woolly adelgid on Fraser fir. [For further discussion, see pest write-ups here and my earlier blogs reviewing 30 years of engagement and survey data from Shenandoah National Park.]
2. Major Damaging Pests Are Poorly Captured by the Survey Method. Morin found that non-native pests had caused a five percent increase in mortality nation-wide – as measured by tree volume. Three of the species suffering the highest rates of this “exacerbated mortality” are redbay, ash, and hemlock. The current studies’ authors concede all three are poorly detected by the survey methods. The aerial survey techniques are ill-suited to detect mortality of tree species that grow scattered throughout a diverse forest. Other seriously damaging pests that are poorly detected by aerial surveys are Dutch elm disease, white pine blister rust, and thousand cankers disease. Again, see the species write-ups here to be reminded about how great the pest’s impact are. Also review my earlier blog reviewing 30 years of my engagement with the issue and survey data from Shenandoah National Park.
photo by F.T. Campbell
Given these caveats above, what do these studies show us?
Areas surveyed.
Since 1999, the annual Insect and Disease Survey (IDS) has covered on average 266,655,000 ha, although the area varied from a maximum of 320,712,000 ha (in 2007) to a minimum of 202,170,000 ha (in 2017), then increased to 211,34,000 ha in 2018. For reasons not clear to me, the proportion of forested area in the lower 48 states surveyed actually declined from 2017 to 2018 – from 55.1% to 46.6%. In Alaska, the 2017 surveys covered about 7.3% of the total forested area but 12.7% of the forested area in 2018. In Hawai`i, the survey covered about 80.1% of the forested area in 2017, but only 69.4% of the State’s total tree canopy area in 2018.
Tree-Killing Insects and Pathogens Found.
The 2017 survey identified 63 mortality-causing agents and complexes that cumulatively affected 3.27 million ha in the lower 48 states – about 1.3% of the total 252 million ha of forested land in these states. Of these agents of tree mortality, 23 were detected killing trees on areas totaling larger than 5,000 ha each.
The 2018 survey identified seven fewer mortality-causing agents – only 56. These agents were detected on about 2.13 million ha across the lower 48 (slightly less than the combined land area of New Jersey and Rhode Island), or about 0.8% of the total forested area. Of the total, 22 agents were detected killing trees on areas totaling larger than 5,000 ha each.
The more recent report does not discuss these declines from the 2017 findings or whether they might be related to the smaller percentages of forested areas covered by the aerial survey in 2018.
In both 2017 and 2018, as well as in the 20-year trend analysis (Chapter 6 of the report published in 2020), overall mortality is greatest in the West due to the impact of several native western bark beetles. Overall mortality rates in other regions was considered low, despite severe impacts of some non-native species.
The 2017 survey found that the emerald ash borer (EAB) was the most widespread single agent, causing measurable tree mortality on 1.42 million ha. In 2018, the area of EAB damage was reduced by 76% — to just 338,000 ha. (Still, the latter figure represented 15.8% of the total area displaying mortality). These figures were probably underestimates – especially in areas outside North Central Region – because EAB is one of the pests poorly detected by the aerial survey technique – at least when ash are growing scattered in a diverse forest ecosystem. Although the USFS report doesn’t say so, this decline probably reflected the collapse of dead ash trees and reduction in numbers of still-alive but vulnerable ash trees as the EAB invasion wave matured.
The reports document a huge increase in mortality attributed to the sudden oak death pathogen between 2017 and 2018. (SOD is the only widespread non-native agent of mortality on the West coast.) The area affected increased nearly seven-fold – from 6,335 ha in the 2017 survey to 42,771 ha in the 2018 survey. This equated to causing mortality on 3.9% of the total Regional mortality area. This finding parallels finding reported by the California Oak Mortality Task Force. Note that SOD-related mortality was not detected by the aerial surveys until 2008 – 13 year or more after scientists working on the ground detected the presence of the then-unknown pathogen in the forests of California.
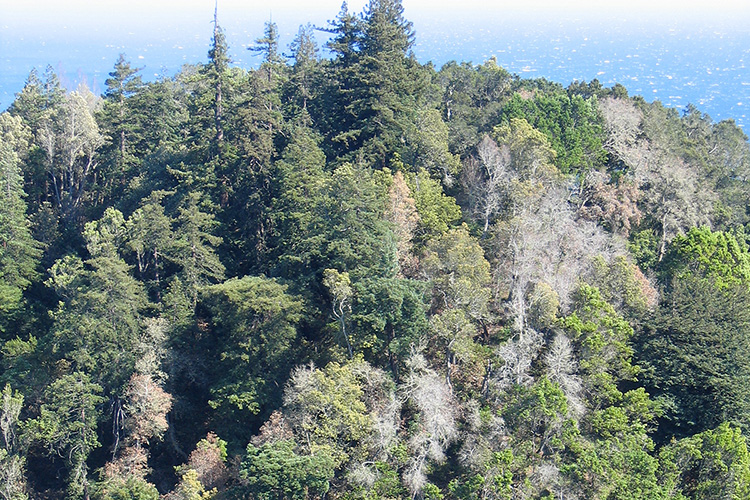
photo by Matteo Garbelotto
Another alarming increase detected in 2018 was that of balsam woolly adelgid (BWA) in the Interior West. BWA-caused mortality was evident on 44,000 ha – 8.4% of the total area with mortality. BWA impacts were especially severe in central Idaho. There are several native pests in the same area. (See BWA write-up here.) BWA was first detected in Idaho in 1983 – 35 years earlier.
Geographic Hot Spots
The EAB caused the principal hot spots in the East. In the USFS North Central Region, 91% of the area suffering tree mortality in 2017 was attributed to the EAB. The EAB was also causing mortality across 10,346 ha (16% of the total areas suffering mortality) in the Northeast (especially Connecticut) and more than 5,000 ha in the South (especially Kentucky). (See my December blog for a discussion of the puzzling situation in several Great Plains ecoregions, where mortality was attributed largely to drought rather than either EAB or Dutch elm disease.)
Another mortality agent in the Northeastern Region was the European gypsy moth. In 2018, it was responsible for tree death on 31% of the total 70,000 ha affected area.
Another hot spot was in Hawai`i. In 2017, about 37,000 ha of mortality was detected. By 2018, the dead zone had increased to 46,000 ha – despite a 12% decrease in the area surveyed. In both years, the data collectors officially called the cause unknown. The reports’ authors stated that the probable cause was they rapid ‘ōhi‘a death fungi. (I ask why the surveyors did not state the cause since rapid ‘ōhi‘a death was identified on the Big Island in 2014.)
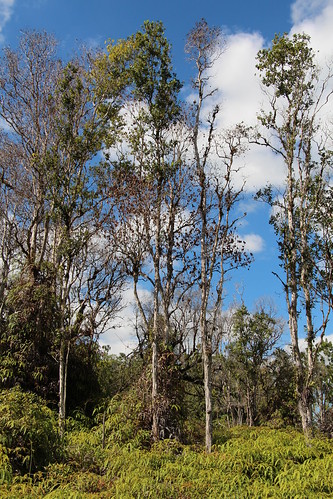
photo by J.B. Friday
Other non-native pests that affected more than 5,000 ha in the lower 48 states in 2017 were the BWA outbreak in the Northeast (20,758 ha, primarily in Maine); beech bark disease (12,222 ha, primarily in the North Central Region), and oak wilt (9,573 ha, primarily in the North Central Region and Texas).
In the Southern Region, mortality agents were detected on 1% or less of the forested area in 2017. In 2018, EAB-caused mortality was detected on 9.7% of the total 13,000 ha area experiencing mortality. An earlier gypsy moth outbreak had apparently calmed. I remind you that the report authors have conceded that laurel wilt and hemlock woolly adelgid are poorly detected by the survey technique.
DEFOLIATORS
The 2017 survey detected defoliation caused by 50 agents and complexes across the lower 48. These impacted 2.3 million ha. The 2018 survey identified six more defoliation agents and complexes (56), but they affected a much smaller area – about 1.72 million ha.
Unsurprisingly, the most widespread was the European gypsy moth. The data demonstrated the gypsy moth’s boom/bust cycle. In 2017, gypsy moth impacts were detected on 39% of the total forested area of the lower 48 states (913,000 ha) in 2017. By 2018, the total area affected by the gyspy moth had fallen to 156,000 ha.
In both years, gypsy moth defoliation was particularly severe in the Northeast Region. In 2018, a second non-native species, browntail moth (Euproctis chrysorrhoea) was also causing severe defoliation in the region, primarily in Maine.
In the South, the European gypsy moth affected only 5.8% of the total area of defoliation; native defoliators predominated.
The report does not discuss the relationship between gypsy-moth caused defoliation and mortality. True, there must be repeated defoliations to cause tree mortality.
Other non-native defoliation agents affecting more than 5,000 ha in the lower 48 in 2017 were the larch casebearer (25,891 ha in the North Central Region and another 7,400 ha in the West Coast Region); and winter moth (12,760 ha in the Northeast Region). Is the decline of winter moth in 2018 data related to introduction of a biocontrol agent?
In 2018, the Larch casebearer (Coleophora laricella) continued to be a significant defoliator, affected 3.1% of the North Central Region’s total defoliated area. A new agent, the balsam woolly adelgid (BWA), was detected defoliating firs in the West Coast Region. The affected area was 15,000 ha – 5% of the total affected area Again, there was no discussion of as to whether defoliation precedes mortality. Admittedly, the progression of BWA damage in firs is extremely complicated.
Alaskan forests suffered widespread defoliation, mostly by native species. The survey detected an unknown canker on quaking aspen (Populus tremuloides).
Twenty Years of Data: Trends
In addition to reporting on the 2018 survey, the more recent report contains an analysis (in Chapter 6) of data over 20 years. The analysis is intended to be used in analyses required under the Resource Protection Act (RPA). The RPA analysis uses the same set of Insect and Disease Survey data, although it groups them in four rather than five regions.
The authors grouped the annual data into four five-year windows (1996-2001; 2002-2006; 2007–2011; 2012-2016).
An overview comprising all mortality agents across the nation found a major “spurt” in area exposed to mortality-causing agents in 2002-2006. The 14.2 million ha was 4.5 times greater than the 3.1 million ha affected in the preceding 1997-2001 period. This was attributed, in part, to a sampling change. The mortality footprint fell slowly in later periods – to 9.9 million ha in 2007-2011 and 6.9 million ha in 2012-2016. Other than during the 2002-2006 period, mortality was relatively low in the Northern Region – despite EAB – especially when compared to high mortality in the Rocky Mountain and Pacific Coast Regions attributed to bark beetles.
The mortality area attributed to pathogens was also highest in 2002-2006. This was due to three pests: a root diseases-bark beetle complex killing subalpine fir, oak wilt, and beech bark disease.
Very little disease mortality was reported in the South during any of the five-year periods – an alarming failure given damage to redbay by laurel wilt. The lapse is more confusing because past IDS reports have listed redbay as heavily damaged (see USDA FS FHTET 2014).
The Pacific states saw a modest increase over time. The sudden oak death infestation was first detected by the IDS survey in 2008 – approximately 13years after it was detected on the ground.
Over the 20 years, non-native species caused mortality on an average of 500,000 ha in each five-year period except 2002-2006 (described above). The proportion of the total mortality footprint associated with non-native species was14.8% in 1997-2001, 34.4% in 2002-2006, 3.6% in 2007-2011 & 7.4% in 2012-2016.
Only in the Northern Region was a large proportion of the mortality footprint consistently attributed to non-native species – 35.1% in 1997-2011 to 98.5% in 2002-2006. The suite of species changed over time. In the first period (1997-2001), the principal species were beech bark disease, European gypsy moth, oak wilt, and hemlock woolly adelgid. During two periods – 2002-2006 and 2007-2011 – those present earlier were joined by BWA, EAB, and Dutch elm disease. By the final period – 2012-2016 – the principal agents were EAB and red pine scale.
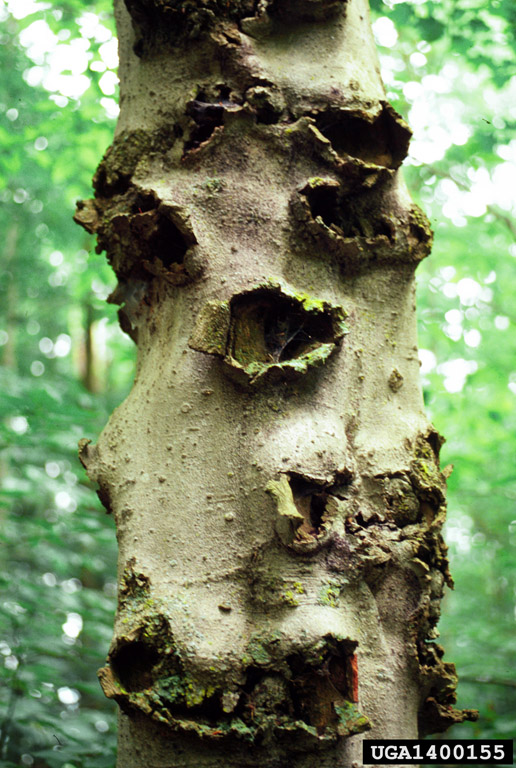
Photo by Linda Haugen
courtesy of Bugwood
Non-native mortality agents detected in the South included hemlock woolly agelgid and oak wilt. HWA affected 71.8% of the affected area in 2006 – 2012, 21.9% in 2012-2016. EAB was first detected by the aerial survey in 2016.
In the two western regions, non-native agents had low footprints. The highest impacts were associated with BWA and white pine blister rust in the Rocky Mountain Region, Port-Orford cedar root disease and SOD in the Pacific Region, with the addition of BWA in some years and ROD in 2015 and 2016.
(All these pests are described here.)
Generally, woodborers have caused the highest mortality levels, seconded by pathogens. Only in the 2002-2006 period did another insect feeding guild exceed 10% of total mortality area – when BWA (a sap feeder) reached 18.7% of detected mortality – on balsam fir in Maine.
In the Western regions, the disease white pine blister rust was second to the subalpine fir mortality complex. Even this ranking fails to reflect widespread mortality of lower-elevation five-needle pines in previous decades.
In the Northern Region, a disease – beech bark disease – was most important in the first five-year period. It was replaced by a wood-boring beetle – EAB. I have noted the importance of the BWA (a sap-feeder) infestation during 2002-2006.
In the Southern Region, native bark beetles usually predominated. There were outbreaks of the foliage-feeding European gypsy moth in2007-2011 and hemlock woolly adelgid (sap-feeder) in 2012-2016.
The authors of the report note that the South might be underrepresented for several reasons – but without mentioning the severe impacts on the understory trees redbay and more recently sassafras.
SOURCES
Bailey, R.G.. 1995. Descriptions of the ecoregions of the United States. 2d ed. Miscellaneous Publication No. 1391. Washington, D.C.: U.S. Department of Agriculture Forest Service. 108 p.
Fei, S., R.S. Morin, C.M. Oswalt, and A.M. 2019. Biomass losses resulting from insect and disease invasions in United States forests
Guo, Q., S. Feib, K.M. Potter, A.M. Liebhold, and J. Wenf. 2019. Tree diversity regulates forest pest invasion. PNAS. www.pnas.org/cgi/doi/10.1073/pnas.1821039116
Morin, R.S., K.W. Gottschalk, M.E. Ostry, A.M. Liebhold. 2018. Regional patterns of declining butternut (Juglans cinerea L.) suggest site characteristics for restoration. Ecology and Evolution.2018;8:546-559
Morin, R. A. Liebhold, S. Pugh, and S. Fie. 2019. Current Status of Hosts and Future Risk of EAB Across the Range of Ash: Online Tools for Broad-Scale Impact Assessment. Presentation at the 81st Northeastern Forest Pest Council, West Chester, PA, March 14, 2019
Potter, K.M., B.S. Crane, W.W. Hargrove. 2017. A US national prioritization framework for tree species vulnerability to climate change. New Forests (2017) 48:275–300 DOI 10.1007/s11056-017-9569-5
Potter, K.M., M.E. Escanferla, R.M. Jetton, and G. Man. 2019a. Important Insect and Disease Threats to United States Tree Species and Geographic Patterns of Their Potential Impacts. Forests. 2019 10 304.
Potter, K.M., M.E. Escanferla, R.M. Jetton, G. Man, and B.S. Crane. 2019b. Prioritizing the conservation needs of United States tree species: Evaluating vulnerability to forest insect and disease threats. Global Ecology and Conservation. (2019)
USDA Forest Service. Forest Health Monitoring: National Status, Trends, and Analysis 2018. General Technical Report SRS-239. June 2019. Editors Kevin M. Potter Barbara L. Conkling
USDA Forest Service. Forest Health Technology Enterprise Team. 2014. 2013-2027 National Insect and Disease Forest Risk Assessment. FHTET-14-01
Posted by Faith Campbell
We welcome comments that supplement or correct factual information, suggest new approaches, or promote thoughtful consideration. We post comments that disagree with us — but not those we judge to be not civil or inflammatory.
For a detailed discussion of the policies and practices that have allowed these pests to enter and spread – and that do not promote effective restoration strategies – review the Fading Forests report at http://treeimprovement.utk.edu/FadingForests.htm