In 2018, China supplied 21.2% of all U.S. imports of goods. Import volumes had been rising rapidly: 427% since China joined WTO in 2001 (17 years!).
However, volumes of U.S. imports from China dropped significantly following imposition of tariffs in the second half of 2019. See a graph published in the Washington Post. U.S. Census Bureau data show U.S. imports from China declined 16% in 2019 compared to 2018 (from $539 billion to $452 billion). The Post graph shows imports from China have begun to rise again in 2020, although they are still far below levels in 2016-2018.
What might this imply for imports of pests?
2019 Imports from China
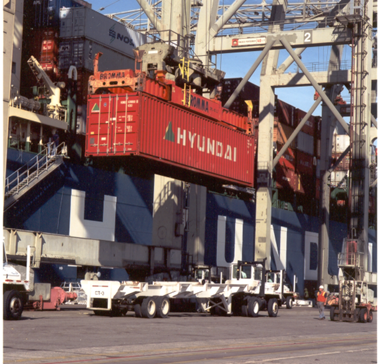
Heavy goods – are the ones most likely to be packaged in wooden crates or on wooden pallets that can transport pests. These include metal and stone products (including tile); machinery (such as automobile parts and farm equipment); electronics; bulk food shipments; and finished wood articles
Many goods imported from China are heavy so their packaging might facilitate pest invasions. Unfortunately, the various websites combine types of imports in different categories, so it is difficult to compare data from the various years. Worse, while I easily found data for 2019 and 2020, I could not find 2018 data (it must be there somewhere!). Still, six of the top eleven categories in 2019 appear to fall into the “heavy” categories.
Source of these data
| Type of Import | 2019 import values in billions |
| Computers & electronics | $186.5 |
| Electrical equipment | $49.9 |
| Miscellaneous manufacturing | $44.0 |
| Machinery | $38.7 |
| Clothing | $29.8 |
| Fabricated metal | $26.5 |
| Furniture | $25.8 |
| Transportation equipment | $21.7 |
| Chemicals | $21.4 |
| Plastic & rubber products | $20.2 |
| Leather & similar goods | $20.0 |
Also, China is the third largest supplier of agricultural imports, primarily processed fruits and vegetables, including juices (together, about $1.5 billion), snack foods ($222 million), spices ($167) million, and fresh vegetables ($160 million).
Trade from Hong Kong is reported separately, but it is not a significant amount – $6.3 billion in 2018; and is declining. Electrical machinery is the largest category, at $980 million.
2020 Imports from China
Import volumes declined substantially during the first five months of 2020, compared to the same period in 2019:
Cell phones & related equipment fell 18.53%
Computers fell 4.86%
Miscellaneous textile rose 300%
Motor vehicle parts fell 26%
Seats excluding medical and dental fell 32.5%
The principal sea ports receiving goods from China during the period January – May 2020 were
Los Angeles $35.27 billion – fell 31.9%
Long Beach $10.61 billion – fell 22%
Newark $9.21 billion – fell 28%
Savannah $8.38 billion
Oakland $4.94 billion
Houston $4.29 billion
Pest Implications
These reduced volume of imports would seem to promise a reduced pest risk. Other factors point in the same direction.

Mode of transport is also significant, that is, air freight versus sea or land transport. In the first five months of 2020, https://ustr.gov/countries-regions/china-mongolia-taiwan/peoples-republic-china a quarter of U.S. imports from China, or $36 billion, entered through just four airports: Chicago’s O’Hare, Los Angeles, Anchorage, and JFK in New York. It is also encouraging that the volumes shipped by air apparently rose. The data show that at O’Hare imports rose 8.4%; at Los Angeles they rose 22%. The website does not provide data for Anchorage or New York. This could be a temporary fluke, for example, if importers were trying to acquire supplies quickly, before new tariffs took effect.
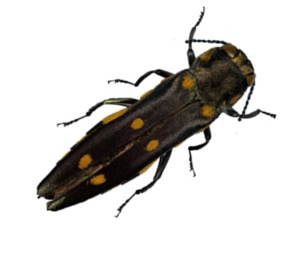
A larger proportion of goods shipped by air might result in a lower approach rate for wood-boring insects, since airborne goods are probably less likely to be packaged in wood. More than a decade ago, Meissner et al. (2009) found that only a third of air shipments (from all countries) were packaged in wood, compared to three-quarters of maritime shipments. I wonder if this is the reason that they found that shipments from China were only half as likely to be enclosed in wood packaging as were shipments from other exporting countries.
Even if China is cutting its imports in quantity, significant problems with quality persist. China consistently ranks second (to Mexico) in the number of shipments containing wood packaging that does not comply with international and U.S. regulations. Over the period 2011-2016, shipments from China constituted 11% of shipments detected by the Bureau of Customs and Border Protection as non-compliant (APHIS database / pers. comm).
So the pest risk persists. Remember that in 1986 – about the time the Asian longhorned beetle and the emerald ash borer were introduced from China – the U.S. imported only $3.8 billion worth of goods from that country. Of course, the U.S. did not require treatment of wood packaging from China until January 1999. My previous blogs have frequently documented the continuing presence of pests in wood packaging from China. To see the series, visit www.nivemnic.us, scroll down below archives to “categories”, click on “wood packaging”.
Because Mexico has an even worse record of compliance with wood packaging regulations than does China, it is good news that U.S. imports from there fell even more precipitously (see graph here). Pests that might be introduced in wood from Mexico generally pose less of a risk, but the risk is not zero! Three woodborers from Mexico – goldspotted oak borer, soapberry borer, and walnut twig beetle – have proved lethal to naïve species growing in the U.S. Each is described here.
Conclusion
Although the presumably temporary collapse of global trade might provide a respite from pest introductions, it is not a long-term strategy. Furthermore, resulting decreases in user fees will reduce the CBP’s inspection staff. I call again for revision of the international phytosanitary system to focus on preventing the movement of plant pests. The designation of 2020 as the International Year of Plant Health means now is the appropriate time to initiate such action.
Posted by Faith Campbell
We welcome comments that supplement or correct factual information, suggest new approaches, or promote thoughtful consideration. We post comments that disagree with us — but not those we judge to be not civil or inflammatory.
For a detailed discussion of the policies and practices that have allowed these pests to enter and spread – and that do not promote effective restoration strategies – review the Fading Forests report at http://treeimprovement.utk.edu/FadingForests.htm
SOURCES
Haack, R.A., F. Herard, and J. Sun, and J.J. Turgeon. 2010. Managing Invasive populations of Asian longhorned beetle and citrus longhorned beetle: a worldwide perspective. Annual Review of Entomology 55: 521-546.
Meissner, H., A. Lemay, C. Bertone, K. Schwartzburg, L. Ferguson, L. Newton. 2009. Evaluation of Pathways for Exotic Plant Pest Movement into and within the Greater Caribbean Region. Caribbean Invasive Species Working Group (CISWG) and USDA APHIS Plant Epidemiology and Risk Analysis Laboratory