 control of multiflora rose
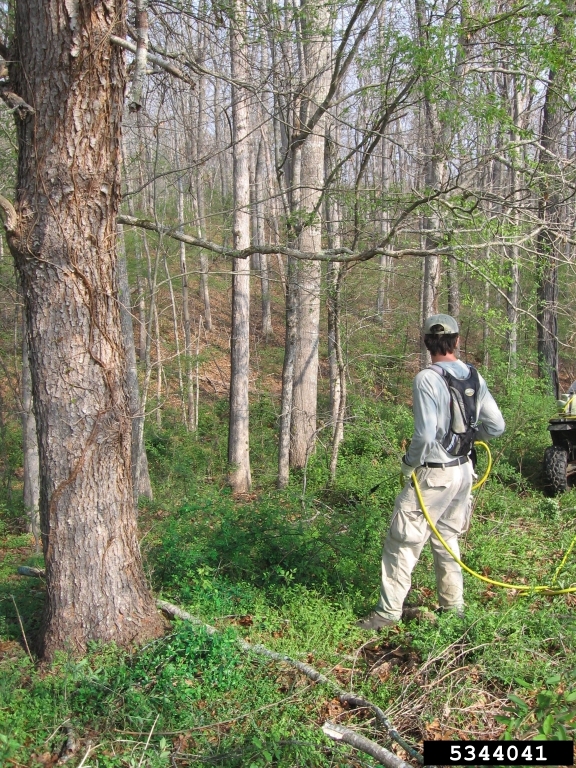
Nancy Dagli, USDI National Park Service, Bugwood.org
Nearly two years ago I posted a blog based on a study by Christopher Oswalt and colleagues (2016; source/link provided at end of blog) using data from the national Forest Inventory and Analysis (FIA) program of the United States Forest Service to determine what proportion of American forests are invaded by non-native plants. Nationwide, 39% of forested plots sampled contained at least one invasive species. Eastern forests are second in the density of invasive plants to Hawai`i, with 46% of plots invaded by at least one plant species.
FIA sampling plots are randomly located across the country. Plots are inventoried once every 5–7 years in the eastern U.S. and once every 10 years in the western U.S. The program inventories only plots that are at least 10% stocked by trees. Phase 2 (P2) plots represent approximately 6,000 acres; Phase 3 (P3) plots represent about 96,000 acres, except in some states and National Forests where there is a regional intensification of plots. Invasive plant species are measured on a subset of the field plots – on the P2 invasive plots, invasive plants of interest are recorded; on the P3 plots, all plant species (invasive, exotic, and native) are recorded.
The US Forest Service Northern Region (Region 9) has issued a report providing details for 50 invasive plant species on plots in the 24 states of the Region. (These states reach from Maine to the Dakotas, south to Kansas, then across to Delaware.) For this report, in states where both P2 invasive and P3 data were collected, the invasives data from the P3 plots were folded into the P2 invasive plots. When there were no P2 invasive plots for a particular inventory or species, the IPS data were calculated solely from P3 plots. In addition, the taxa reported varied over time and in some cases from state to state. Finally, the inventories took place over a period of years; the most recent inventories included in the report date from 2010. Presumably, the extent and intensity of plant invasions have increased in the intervening seven years. [The report is posted here.
Given the variety of plots inventoried, changes in taxa recorded, and time lag, the report cannot provide an up-to-date and detailed picture of any one site. However, it does allow us to get an overall picture that is more detailed than the nation-wide summary provided by Oswalt et al. 2016 and reported in Faith’s blog from spring 2016.
The report contains a wealth of data on the 50 individual species – a page for each, providing background, characteristics, distribution, monitoring data, and regulatory status in the various states. Also, there are 10 pages of summary tables. Since FIA inventories are conducted on the schedule of five to seven years, future reports based on these “[r]epeated measurements will help determine factors … associated with the presence of these species” and that the data can help “educate individuals of potential risk species”.
Our Interpretation
It is unfortunate that the USFS Southern Region has not prepared a similar report so that we could understand the extent of invasion by the individual taxa across the entire eastern deciduous forest. This is especially unfortunate because the Northern Region report found that the number of invasive plant species on a plot is higher in the southeastern portion of the Region (i.e., the states of West Virginia, Maryland, and Delaware). The arbitrary boundary between the Northern and Southern regions prevent our getting a true regional picture for the Mid-Atlantic states. The Oswalt et al. 2016 summary does allow some comparisons.
Still … we found it striking that seven of the 15 invasive plant species ranked highest in terms of proportion of plots invaded are shrub or vine species that were deliberately planted for improving wildlife habitat, horticulture, or other purposes.
Detailed Findings
The report does not state the proportion of all survey plots invaded by at least one invasive plant species for the region as a whole. Table 3 does report the proportion of plots in specific states. This varies from a high of 93% of plots in Ohio to a low of about 11% in Minnesota and New Hampshire. Several other Midwestern states also experience high levels of invasion: Iowa 81%, Indiana 79%, Illinois 72%, and Missouri 46%. Plots in Mid-Atlantic states and southern New England also are heavily invaded: West Virginia 79%, Maryland 65%, Pennsylvania 61%, Connecticut 54%, Rhode Island 51%, New York 49%, New Jersey 48%, Delaware 47%, Massachusetts 44%. In general, states in the far north have lower rates of invasion, like Minnesota and New Hampshire (above): Vermont 18%, South Dakota 15%, Michigan 14%, Maine 12%. However, North Dakota, at 29%, and Wisconsin, at 28%, differ from this generalization.
The most frequently recorded invasive plant is multiflora rose. According to the report, it is present in 39 states and five Canadian provinces. Across the region, multiflora rose is present on 16.6% of surveyed plots. It is the most common invasive plant in 10 of the 24 states of the region. It is almost ubiquitous in some states; in Ohio 85% of the plots were invaded. Oswalt reports that “roses” were the third most common invasive plants in the USFS Southern Region.
The third most frequently recorded invasive plant species is garlic mustard. It is reported to be present in 36 states and five Canadian provinces. Across the region, garlic mustard is present on 4.5% of the surveyed plots. Several states report high levels of infestation. In Ohio, garlic mustard is present on 30% of the plots; in Maryland, on 27% of the plots; in Pennsylvania, on 22% of the plots; in New Jersey, on 20%.
The fourth most frequently recorded invasive is common or European buckthorn. It is reported to be present in 34 states and eight Canadian provinces. Buckthorn is present on 4.4% of survey plots across the northeastern region – about a quarter of the plots on which multiflora rose is found. The highest proportion is in New York, where the invasive shrub is found on 16.8% of the plots.
Several bush honeysuckles rank high in the survey. Because of their close relationship and similar ecological impacts, we will discuss them together. Morrow’s honeysuckle is the fifth most commonly detected invasive plant species. This species is found on 3.8% of plots across the region. Amur honeysuckle ranks tenth; it is found on 3.1% of plots. Tatarian honeysuckle ranks sixteenth; it occurs on 1.5% of plots across the region. The hybrid showy fly, or Bell’s, honeysuckle ranks eighteenth; it occurs on 1.1% of plots. The data do not indicate whether there is much overlap in the plots invaded by the various species, so we cannot determine an overall invasion extent for bush honeysuckles – although clearly they occupy a significant proportion of the forest of the region. If there is almost no overlap, bush honeysuckles occupy 9.5% of all surveyed plots – second only to multiflora ros. During the first year of the survey, bush honeysuckles were recorded by genus – but only in four Midwestern states. In that survey, the genus was found on 6.5% of the plots surveyed.
The sixth most frequently recorded plant species is also an Asian honeysuckle – the vine Japanese honeysuckle, which is found on 3.6% of survey plots across the region. Oswalt et al. 2016 report that Japanese honeysuckle is the most common invasive plants in forests in the Southern region.
The second and seventh most frequently recorded plant species are native to parts of the region surveyed – although they have spread. These are black locust and reed canarygrass. We are confused as to how many of the reported plots actually represent invasions by these species since several states with high proportions of plots bearing black locust, for example, are in or next to the Appalachian mountains and the Ozarks, where the species is native.
The eighth and eleventh most frequently recorded invasive plant species are thistles — Canada thistle is eighth, bull thistle is eleventh. Both are found in more than 40 states and all 10 of the Canadian provinces. Each is present on approximately three percent of the plots, with concentrations in the upper Midwest.
The ninth and twelfth highest ranking invasive plant species in the region are additional shrubs which were deliberately planted for various purposes. Autumn olive ranks ninth; it occurs on approximately three percent of plots across the region. It is particularly dense in West Virginia, where it occurs on one fifth of all plots surveyed. Japanese barberry ranks 12th. It occurs on 2.4% of the plots across the region. In Connecticut, barberry is found on one-third of the plots.
The thirteenth most common species is common burdock – found on 2.2% of the plots. Again, the highest densities are found on forest plots in the upper Midwest along the edge of the prairie.
The fourteenth most commonly reported species is Nepalese browntop or Japanese stiltgrass. Stiltgrass has spread without much artificial assistance. Although stiltgrass is more common in the Southeast (outside the study region), it still occupies 2.1% of surveyed plots in the Northern region. Owald et al. 2016 report that stiltgrass is the fifth most common invasive plant in the Southern region.
Additional Studies Needed
- The USFS Northern and Southern regions should coordinate their reports so that at least some use compatible methods and combine their findings so can see the picture for the entire Eastern forest.
- USFS scientists should collaborate with other programs that map invasive plants – e.g., EDDMapS, the National Park Service, and Invasive Plant Councils – in both selection of species to target and developing an overall picture. As noted in Faith’s earlier blog, the Mid-Atlantic Invasive Plant Council has a list of 285 invasive plants in the region. Does the subset of 50 species selected for the FIA inventories provide an accurate picture of plant invasions in this sub-region?
- Scientists should cooperate to evaluate the relative importance of propagule pressure v. forest fragmentation as factors in facilitating invasions. Their relative roles probably vary by species, receiving forest, etc.
- We welcome the attention to invasions of interior forests – a topic previously neglected. Nevertheless, forest “edges” are also important ecologically – and – based on what we see in the Mid-Atlantic region – are even more heavily invaded. What impact does a wall of vines have on wildlife and plant species that evolved to live in area of greater light and temperature variation of trees, shrubs, herbaceous species that made up the edge before invasion?
Actions to Counter Plant Invasions
- Those who sell plants for any use – ornamental horticulture, ground cover, livestock forage, soil amelioration, wildlife habitat management, biofuels – should commit to avoiding species that are known or suspected to be invasive in the region.
- Voluntary efforts to limit sales of invasive plants have fallen by the wayside. The various Invasive Plant Councils should work with industry groups and others to renew this effort. Also, the Councils should propose a joint list of additional plants for APHIS regulation under NAPPRA (see below).
- Those who buy plants for these various uses should make a similar commitment – especially large, institutional buyers like state highway departments.
- Concerned citizens should lobby their state governments and the Congress to fund “noxious weed” programs and to ensure that these programs include plant species that threaten natural areas, not just weeds of agriculture.
- Concerned citizens should lobby the Congress to increase funding for federal agencies’ invasive plant control programs, especially those addressing natural areas, and especially in Hawai’i and the eastern United States. Also, the U.S. Department of Agriculture needs to adopt procedures that enable APHIS to act more quickly to curtail introduction and human-assisted spread of invasive plants.
In June 2017, APHIS finalized its May 2013 proposal to restrict importation of 22 potentially invasive plant species – as provide by its NAPPRA program. (For a description of this program and the recent action, visit Faith’s blog here. APHIS should be empowered to use this program more aggressively to list additional plant taxa that appear likely to be invasive.
Source
Christopher M. Oswalt, Songlin Fei, Qinfeng Guo, Basil V. Iannone III, Sonja N. Oswalt, Bryan C. Pijanowski, Kevin M. Potter 2016. A subcontinental view of forest plant invasions. NeoBiota. 24: 49-54 http://www.srs.fs.usda.gov/pubs/48489
posted by Faith Campbell & guest Jil Swearingen
We welcome comments that supplement or correct factual information, suggest new approaches, or promote thoughtful consideration. We post comments that disagree with us — but not those we judge to be not civil or inflammatory.