Plants Depend on Animals – and They are Disappearing

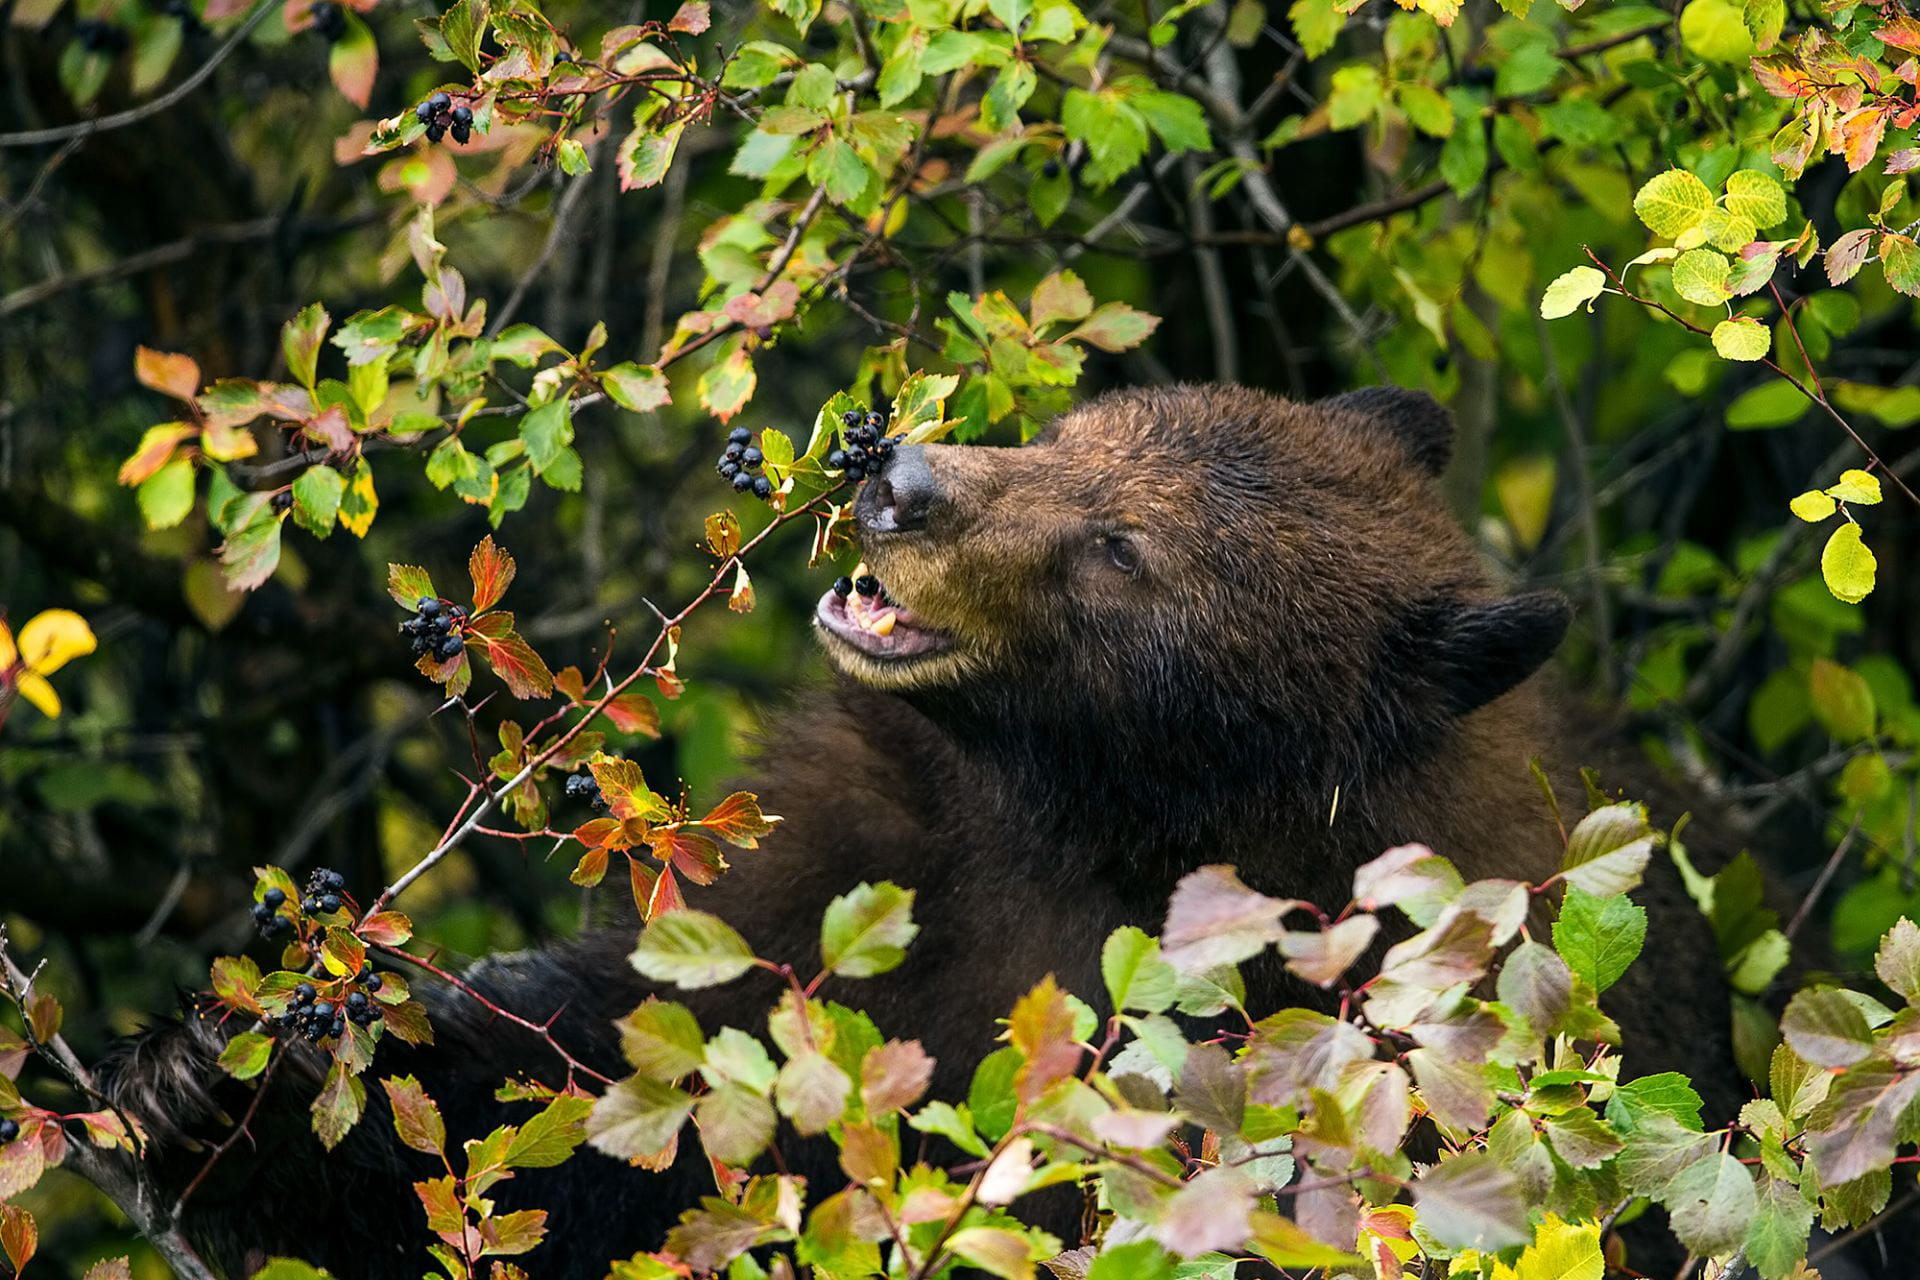
black berry eating hawthorn berries; photo by Paul D. Vitucci

Articles by Evan Fricke and colleagues remind us to look more broadly at bioinvasion to consider the impact on ecosystem function and evolution. They focus on animal interactions with plants in the shared environment, especially animals’ role as seed dispersers.

The authors also remind us that natural barriers explain why there are different species in different areas and thus how evolution and speciation follow different paths in different places. Think of Galapagos finches evolving in isolation from a few ancestors that somehow made it over the ocean from mainland South America.

These points are made in two recent articles.

In the first, Fricke and Svenning 2020 (full citation at end of this blog) note that about half of all plant species depend on animals to disperse their seeds. Animal seed dispersal is influenced by several drivers of global change, including local or generalized extinction (= defaunation); bioinvasion; and habitat fragmentation. The decline of large vertebrates has a particularly important role in these interactions.

Their study focused on fleshy-fruited plants that are dispersed by animals. (The study does not include nuts, e.g., acorns, which are presumably subject to some of the same pressures.) They expect evolution of the affected plants and animals to proceed differently as a result of the new partnerships, but they did not study any such interactions.

Their study covered animal seed-dispersal interactions with plants at 410 locations. The data encompassed 24,455 unique animal-plant pairs involving 1,631 animal and 3,208 plant species. Three quarters of the animals were birds; most of the rest were mammals, primarily bats and primates. Only 1% were in other animal groups – lizards, tortoises, or fish.

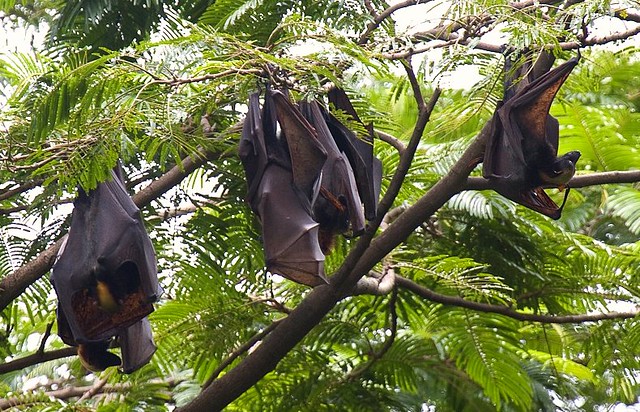
fruit bats on Luzon, Philippines; photo by Francesco Vernonesi; Flickr.com

They found that introduced plants and animals are twice as likely as native species to interact with introduced partners. The resulting interactions are likely to amplify biotic homogenization in future ecosystems. Already, introduced species have largely replaced missing native frugivore species in some places. In fact, mutualisms in which either or both the plant and animal is an introduced species are now about seven times higher than decades ago.

These mutual-benefit interactions of introduced species are even more prevalent in areas where human modification of the environment is greater. The proportion of introduced species and of novel interactions caused by introduced plant or animal species was higher for oceanic island systems than for continental bioregions. This finding adds a new dimension to the already recognized heightened susceptibility of remote islands to invasion and their loss of native species. Continental bioregions’ networks typically had few introduced animals and a greater prevalence of intro plants than animals.

Fricke and colleagues think plant-frugivore networks are likely to increasingly favor a relatively few introduced generalists over many native species, reducing the uniqueness of future biotas. The result might be to reduce resilience of terrestrial ecosystems by, first, allowing perturbations to propagate more quickly; and, second, by exposing disparate ecosystems to similar drivers. They called for giving higher priority to managing increasing ecological homogenization.

In the second article, Fricke, Ordonez, Rogers, and Svenning (2022) note that climate change requires many plant species to shift their populations hundreds of meters to tens of kilometers per year to track their climatic niche. Earth is also experiencing the formation of novel communities as species introductions and shifting ranges result in co-occurrence of species that do not share co-evolutionary history. They conclude that the novel mutualistic interaction networks will influence whether certain plant species persist and spread.

These authors examined four scenarios to assess how current long-distance dispersal has been affected by past defaunation and invasion and how it is threatened by species endangerment. These scenarios are as follows:

1st scenario (current scenario) = natural and introduced ranges of extant species today.

2nd scenario (natural scenario) = mammal and bird ranges as they would be if unaffected by extinctions, range contractions, or introductions.

3rd scenario (extinction scenario) = those bird and mammal species listed as vulnerable or endangered by the IUCN go extinct.

4th scenario (extirpation of introduced species scenario) = introduced species are extirpated.

Fricke and colleagues estimate that extinction of at least local populations of seed-dispersing mammals and birds has already reduced the capacity of plants to track climate change by 60% globally. The effect is strongest in temperate regions and regions with little topographic complexity. Two examples are eastern North America and Europe. These regions face a double threat: rapid climate change and loss of large mammals that provided long-distance dispersal.

The extinction scenario is most evident in Southeast Asia and Madagascar. The remaining animal seed dispersers are already threatened or endangered. Fricke and colleagues project that future loss of vulnerable and endangered species from their current ranges would result in a further reduction of 15% in the capacity of plants to track climate change.

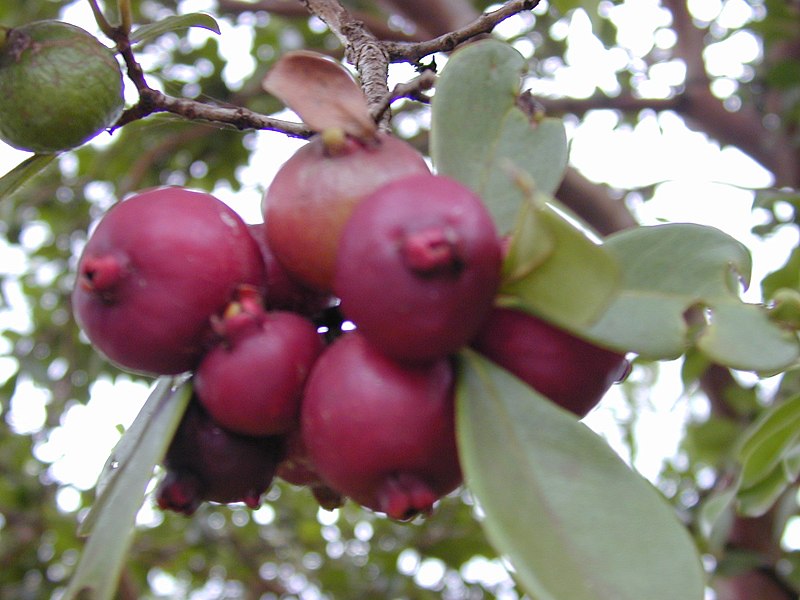
The contrary situation is found on islands which have few native mammals. Introduced species are now important long-distance seed dispersers. In some cases, the introduced animals are dispersing invasive plant seeds, e.g., on Hawai`i feral hogs are spreading the invasive plant strawberry guava (Psidium cattleianum).

strawberry guava on Maui; photo by Forest and Kim Starr

People’s actions have resulted in ecoregions disproportionately losing the species that provide long-distance seed dispersal function, i.e., large mammals. In other words, human activities have caused not only rapid climate change—requiring broad-scale range shifts by plants—but also defaunation of the birds and mammals needed by plants to do so. Habitat fragmentation and other land-use changes will likely amplify existing constraints on plant range shifts.

Fricke and colleagues say their findings emphasize the importance of not only promoting habitat connectivity to maximize the functional potential of current seed dispersers but also restoring biotic connectivity through the recovery of large-bodied animals to increase the resilience of vegetation communities under climate change.

SOURCES

Fricke, E. C., & Svenning, J. C. (2020). Accelerating homogenization of the global plant–frugivore meta-network. Nature585(7823), 74-78. https://www.nature.com/articles/s41586-020-2640-y

Fricke, E. C., Ordonez, A., Rogers, H. S., & Svenning, J. C. (2022). The effects of defaunation on plants’ capacity to track climate change. Science375(6577), 210-214. https://www.science.org/doi/full/10.1126/science.abk3510

Posted by Faith Campbell

We welcome comments that supplement or correct factual information, suggest new approaches, or promote thoughtful consideration. We post comments that disagree with us — but not those we judge to be not civil or inflammatory.

For a detailed discussion of the policies and practices that have allowed these pests to enter and spread – and that do not promote effective restoration strategies – review the Fading Forests report at http://treeimprovement.utk.edu/FadingForests.htm

What Do Invasive Species Cost?

brown tree snake Boiga irregularis; via Wikimedia; one of the species on which the most money is spent on preventive efforts

In recent years a group of scientists have attempted to determine how much invasive species are costing worldwide. See Daigne et al. 2020 here.

Some of these scientists have now gone further in evaluating these data. Cuthbert et al. (2022) [full citation at end of blog] see management of steadily increasing numbers of invasive, alien species as a major societal challenge for the 21st Century. They undertook their study of invasive species-related costs and expenditures because rising numbers and impacts of bioinvasions are placing growing pressure on the management of ecological and economic systems and they expect this burden to continue to rise (citing Seebens et al., 2021; full citation at end of blog).

They relied on a database of economic costs (InvaCost; see “methods” section of Cuthbert et al.) It is the best there is but Cuthbert et al. note several gaps:

  • Only 83 countries reported management costs; of those, only 24 reported costs specifically associated with pre-invasion (prevention) efforts.
  • Data comparing regional costs do not incorporate consideration of varying purchasing power of the reporting countries’ currencies.  
  • Data available are patchy so global management costs are probably substantially underestimated. For example, forest insects and pathogens account for less than 1% of the records in the InvaCost database, but constitute 25% of total annual costs ($43.4 billion) (Williams et al., in prep.) .

Still, their findings fit widespread expectations.  

These data point to a total cost associated with invasive species – including both realized damage and management costs – of about $1.5 trillion since 1960.  North America and Oceania spent by far the greatest amount of all global money countering bioinvasions. North America spent 54% of the total expenditure of $95.3 billion; Oceania spent 30%. The remaining regions each spent less than $5 billion.

Cuthbert et al. set out to compare management expenditures to losses/damage; to compare management expenditures pre-invasion (prevention) to post-invasion (control); and to determine potential savings if management had been more timely.

Economic Data Show Global Efforts Could Be – But Aren’t — Cost-Effective

The authors conclude that countries are making insufficient investments in invasive species management — particularly preventive management. This failure is demonstrated by the fact thatreported management expenditures ($95.3 billion) are only 8% of total damage costs from invasions ($1.13 trillion). While both cost or losses and management expenditures have risen over time, even in recent decades, losses were more than ten times larger than reported management expenditures. This discrepancy was true across all regions except the Antarctic-Subantarctic. The discrepancy was especially noteworthy in Asia, where damages were 77-times higher than management expenditures.

Furthermore, only a tiny fraction of overall management spending goes to prevention. Of the $95.3 billion in total spending on management, only $2.8 billion – less than 3%  – has been spent on pre-invasion management. Again, this pattern is true for all geographic regions except the Antarctic-Subantarctic. The divergence is greatest in Africa, where post-introduction control is funded at more than 1400 times preventive efforts. It is also significant for Asia and South America.

Even in North America – where preventative actions were most generously funded – post-introduction management is funded at 16 times that of prevention.

Cuthbert et al. worry particularly about the low level of funding for prevention in the Global South. They note that these conservation managers operate under severe budgetary constraints. At least some of the bioinvasion-caused losses suffered by resources under their stewardship could have been avoided if the invaders’ introduction and establishment had been successfully prevented.

While in the body of the article Cuthbert et al. seem uncertain about why funding for preventive actions is so low, in their conclusions they offer a convincing (to me) explanation. They note that people are intrinsically inclined to react when impact becomes apparent. It is therefore difficult to motivate proactive investment when impacts are seemingly absent in the short-term, incurred by other sectors, or in different regions, and when other demands on limited funds may seem more pressing. Plus efficient proactive management will prevent any impact, paradoxically undermining evidence of the value of this action!

Aedes aegypti mosquito; one of the species on which the most money is spent for post-introduction control; photo by James Gathany; via Flickr

Delay Costs Money

The reports contained in the InvaCost database indicate that management is delayed an average of 11 years after damage was first been reported. Cuthbert et al. estimate that these delays have caused an additional cost of about $1.2 trillion worldwide. Each $1 of management was estimated to reduce damage by $53.5 in this study. This finding, they argue, supports the value of timely invasive species management.

They point out that the Supplementary Materials contain many examples of bioinvasions that entail large and sustained late-stage expenditures that would have been avoided had management interventions begun earlier.

Although Cuthbert et al. are not as clear as I would wish, they seem to recognize also that stakeholders’ varying perceptions of whether an introduced species is causing a detrimental “impact” might also complicate reporting – not just whether any management action is taken

Cuthbert et al. are encouraged by two recent trends: growing investments in preventative actions and research, and shrinking delays in initiating management. However, these hopeful trends are unequal among the geographic regions.

Which Taxonomic Groups Get the Most Money?

About 42% of management costs ($39.9 billion) were spent on diverse or unspecified taxonomic groups. Of the costs that were taxonomically defined, 58% ($32.1 billion) was spent on invertebrates [see above re: forest pests]; 27% ($14.8 billion) on plants; 12% ($6.7 billion) on vertebrates; and 3% ($1.8 billion) on “other” taxa, i.e. fungi, chromists, and pathogens. For all of these defined taxonomic groups, post-invasion management dominated over pre-invasion management.  

When considering the invaded habitats, 69% of overall management spending was on terrestrial species ($66.1 billion); 7% on semi-aquatic species ($6.7 billion); 2% on aquatic species ($2.0 billion); the remainder was “diverse/unspecified”. For pre-invasion management (prevention programs), terrestrial species were still highest ($840.4 million). However, a relatively large share of investments was allocated to aquatic invaders ($624.2 million).

Considering costs attributed to individual species, the top 10 targetted for preventive efforts were four insects, three mammals, two reptiles, and one alga. Top expenditures for post-invasion investments went to eight insects [including Asian longhorned beetle], one mammal, and one bird.

Asian longhorned beetle

Just two of the costliest species were in both categories: insects red imported fire ant(Solenopsis invicta) and Mediterranean fruitfly (Ceratitis capitate). None of the species with the highest pre-invasion investment was among the top 10 costliest invaders in terms of damages. However, note the lack of data on fungi, chromists, and pathogens. (I wrote about this problem in an earlier blog.)

Discussion and Recommendations

Cuthbert et al. conclude that damage costs and post-invasion spending are probably growing substantially faster than pre-invasion investment. Therefore, they call for a stronger commitment to enhancing biosecurity and for more reliance on regional efforts rather than ones by individual countries. Their examples of opportunities come from Europe.

Drawing parallels to climate action, the authors also call for greater emphasis on during decision-making to act collectively and proactively to solve a growing global and inter-generational problem.

Cuthbert et al. focus many of their recommendations on improving reporting. One point I found particularly interesting: given the uneven and rapidly changing nature of invasive species data, they think it likely that future invasions could involve a new suite of geographic origins, pathways or vectors, taxonomic groups, and habitats. These could require different management approaches than those in use today.

As regards data and reporting, Cuthbert et al. recommend:

1) reducing bias in cost data by increasing funding for reporting of underreported taxa and regions;

2) addressing ambiguities in data by adopting a harmonized framework for reporting expenditures. For example, agriculture and public health officials refer to “pest species” without differentiating introduced from native species. (An earlier blog also discussed the challenge arising from  these fields’ different purposes and cultures.)

3) urging colleagues to try harder to collect and integrate cost information, especially across sectors;

4) urging countries to report separately costs and expenditures associated with different categories, i.e., prevention separately from post-invasion management; damage separately from management efforts; and.

5) creating a formal repository for information about the efficacy of management expenditures.

While the InvaCost database is incomplete (a result of poor accounting by the countries, not lack of effort by the compilers!), analysis of these data points to some obvious ways to improve global efforts to contain bioinvasion. I hope countries will adjust their efforts based on these findings.

SOURCE

Cuthbert, R.N., C. Diagne, E.J. Hudgins, A. Turbelin, D.A. Ahmed, C. Albert, T.W. Bodey, E. Briski, F. Essl, P. J. Haubrock, R.E. Gozlan, N. Kirichenko, M. Kourantidou, A.M. Kramer, F. Courchamp. 2022. Bioinvasion costs reveal insufficient proactive management worldwide. Science of The Total Environment Volume 819, 1 May 2022, 153404

Seebens, H. S. Bacher, T.M. Blackburn, C. Capinha, W. Dawson, S. Dullinger, P. Genovesi, P.E. Hulme, M.van Kleunen, I. Kühn, J.M. Jeschke, B. Lenzner, A.M. Liebhold, Z. Pattison, J. Perg, P. Pyšek, M. Winter, F. Essl. 2021. Projecting the continental accumulation of alien species through to 2050. Glob Change Biol. 2021;27:970-982.

Williams, G.M., M.D. Ginzel, Z. Ma, D.C. Adams, F.T. Campbell, G.M. Lovett, M. Belén Pildain, K.F. Raffa, K.J.K. Gandhi, A. Santini, R.A. Sniezko, M.J. Wingfield, and P. Bonello 2022. The Global Forest Health Crisis: A Public Good Social Dilemma in Need of International Collective Action. submitted

Posted by Faith Campbell

We welcome comments that supplement or correct factual information, suggest new approaches, or promote thoughtful consideration. We post comments that disagree with us — but not those we judge to be not civil or inflammatory.

For a detailed discussion of the policies and practices that have allowed these pests to enter and spread – and that do not promote effective restoration strategies – review the Fading Forests report at http://treeimprovement.utk.edu/FadingForests.htm

Global Loss of Floristic Uniqueness

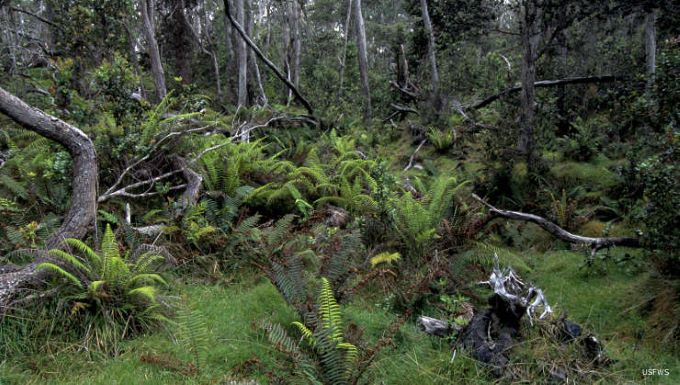
Hakalau Forest, Hawai“i; nearly 90% of Hawaiian flora is unique to the Islands

A recent article by Yang et al. 2021 (full citation at the end of this blog) seeks to determine the extent to which introduced plants reduce the uniqueness of regional floras. They analyzed data from 658 regions covering about 65.7% of the Earth’s ice-free land surface and about 62.3% of the planet’s known plant species.

They found strong homogenization of plant species’ taxonomic and phylogenetic diversity results from introductions of plant species to ecosystems beyond their native range. Homogenization caused by regional extinctions of native floral species occurs much less frequently.

There are two aspects of a region’s floral uniqueness. One is the number of species that it shares with other regions. This is taxonomic uniqueness. The other is the distinctiveness of the evolutionary history of the region. When several species are endemic to a region’s flora, and lack close relatives in other regions, that equals phylogenetic uniqueness.

The effect of a species introduction differs depending on which of these aspects one focuses on. Thus, naturalization of a species closely related to native species (e.g., a congeneric species) will have less impact on the phylogenetic floristic uniqueness of the region than naturalization by a distantly related species. Taxonomic uniqueness, however, will be affected to the same degree, irrespective of the phylogenetic distance between the naturalized and native species.

Yang et al. found strong homogenization of plant diversity. They found that species introductions increased the taxonomic similarity in 90.7% of all regional pairs and phylogenetic similarity in 77.2% of all region pairs. Most homogenization results from introductions of plant species to ecosystems beyond their native range. Homogenization caused by regional extinctions of native floral species occurs much less frequently.

This loss of regional biotic uniqueness or distinctiveness changes biotic interactions and species assemblages. These, in turn, have ecological and evolutionary consequences at larger scales and higher levels.

The degree of homogenization between regions’ floras depends on three factors:

1) The distance between the donor and recipient regions. Since nearby regions share more species, an introduction from a more distant origin is more likely to be a novel species and so contribute to homogenization of “donor” and “receiving” floras.

2) Climatic similarity, especially temperature. A plant species introduced from a climatically similar but geographically distant place is more likely to establish than a species from a different climatic zone. As a result, the recipient area’s flora is changed to more closely resemble the flora of the donor region with which it shares climatic conditions – regardless of the distance between them.

3) The level of exchange of goods and people between two regions. The higher the rate of exchange between two regions, the greater the chance that a species will be introduced and become established. Yang et al. used the existence of current or past administrative relationships (e.g., colonial relationship) between two regions as a proxy for intensity of trade and transport between donor and recipient regions. They found that floras of regions with current or past administrative links have taxonomically become more similar to each other than the floras of regions with no such links.

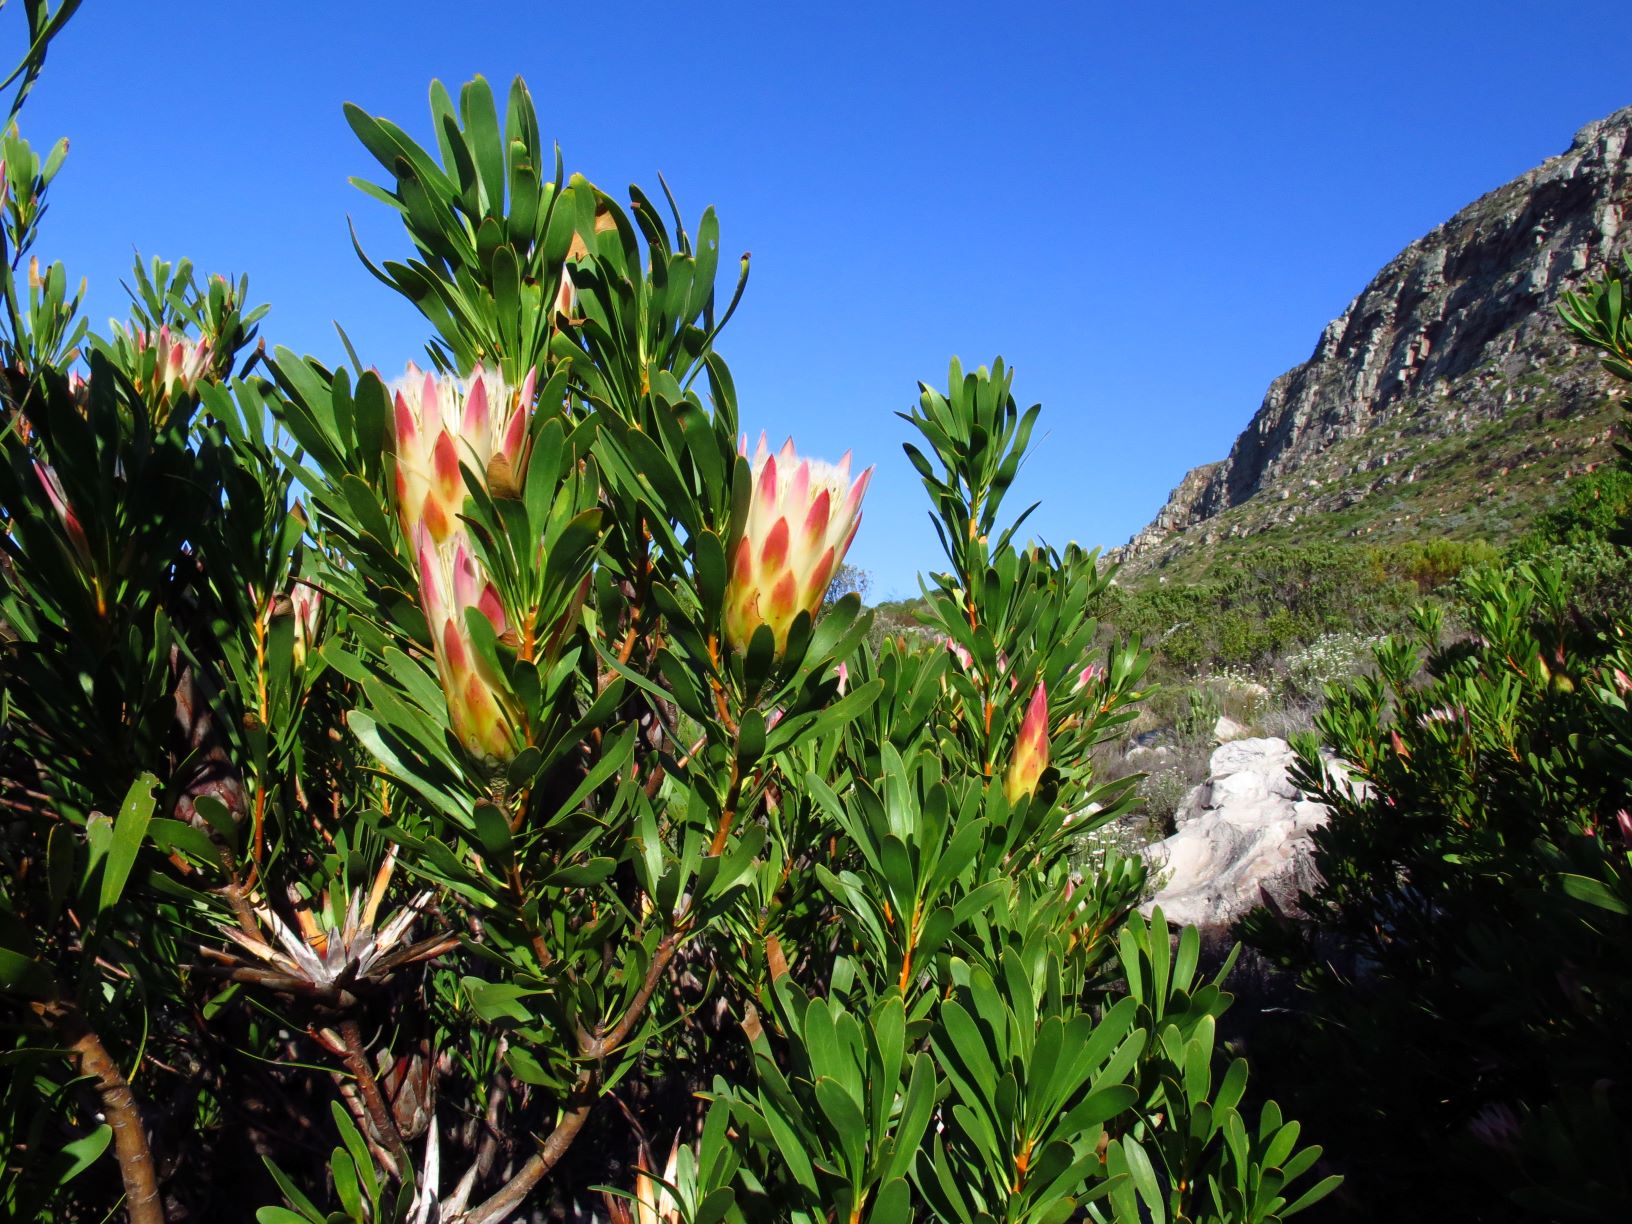
flora of the Cape Floral Kingdom – South Africa; photo from Michael Wingfield

Establishment of introduced species can increase floristic similarity of the donor and recipient regions (= floristic homogenization) when the species is native to one of the two regions and naturalizes in the other, or when it is not native to both regions and naturalizes in both. On the other hand, a species introduction can decrease the floristic similarity of the two regions (i.e., enhance floristic differentiation) when the species is not native to both regions but naturalized in only one.  

Homogenization hotspots differed slightly depending on whether one focused on taxonomic or phylogenetic aspects.

The regions with the greatest average increase in taxonomic similarity with other regions due to naturalized alien species were New Zealand, portions of Australia, and many oceanic islands. The Australasian situation probably reflects its long biogeographic isolation from other parts of the globe and its highly unique native flora. As a result, nearly all non-native plants introduced to Australasia strongly increase levels of its floristic similarity to the rest of the world. Oceanic islands have species-poor floras with large proportions of unique endemics. They have also received high numbers of naturalized alien plants.

Hotspots of phylogenetic homogenization on continents are the same as those for taxonomic homogenization, but this is not true for islands. Yang et al. think this is because islands’ native floras were established by natural colonization from nearby continental floras so – despite subsequent speciation – they retain their phylogenetic relationship to the donor areas’ floras.  

Yang et al. concede that they lacked high-quality data on native and naturalized alien species lists for a third of Earth’s ice-free terrestrial surface, especially Africa, Eastern Europe, and tropical Asia. They believe, however, that data from these regions are unlikely to change the overall finding.  (Scientists are beginning to compile lists of forest pests in Africa). link to blog

Yang et al. note that introduction and naturalization of alien species are likely to increase in the future, thusaccelerating floristic homogenization. The ecological, evolutionary and socioeconomic consequences are largely unknown.They call for stronger biosecurity regulations of trade and transport and other measures to protect native vegetation.

SOURCE

Yang, Q., P. Weigelt, T.S. Fristoe, Z. Zhang, H. Kreft, A. Stein, H. Seebens, W. Dawson, F. Essl, C. König, B. Lenzner, J. Pergl, R. Pouteau, P. Pyšek, M. Winter, A.L. Ebel, N. Fuentes, E.L.H. Giehl, J. Kartesz, P. Krestov, T. Kukk, M. Nishino, A. Kupriyanov, J.L. Villaseñor, J.J. Wieringa, A. Zeddam, E. Zykova  and M. van Kleunen. 2021. The global loss of floristic uniqueness. NATURE COMMUNICATIONS (2021) 12:7290. https://doi.org/10.1038/s41467-021-27603-y

Posted by Faith Campbell

We welcome comments that supplement or correct factual information, suggest new approaches, or promote thoughtful consideration. We post comments that disagree with us — but not those we judge to be not civil or inflammatory.

For a detailed discussion of the policies and practices that have allowed these pests to enter and spread – and that do not promote effective restoration strategies – review the Fading Forests report at http://treeimprovement.utk.edu/FadingForests.htm

A Case Study Documents Forest Losses due to White Pine Blister Rust

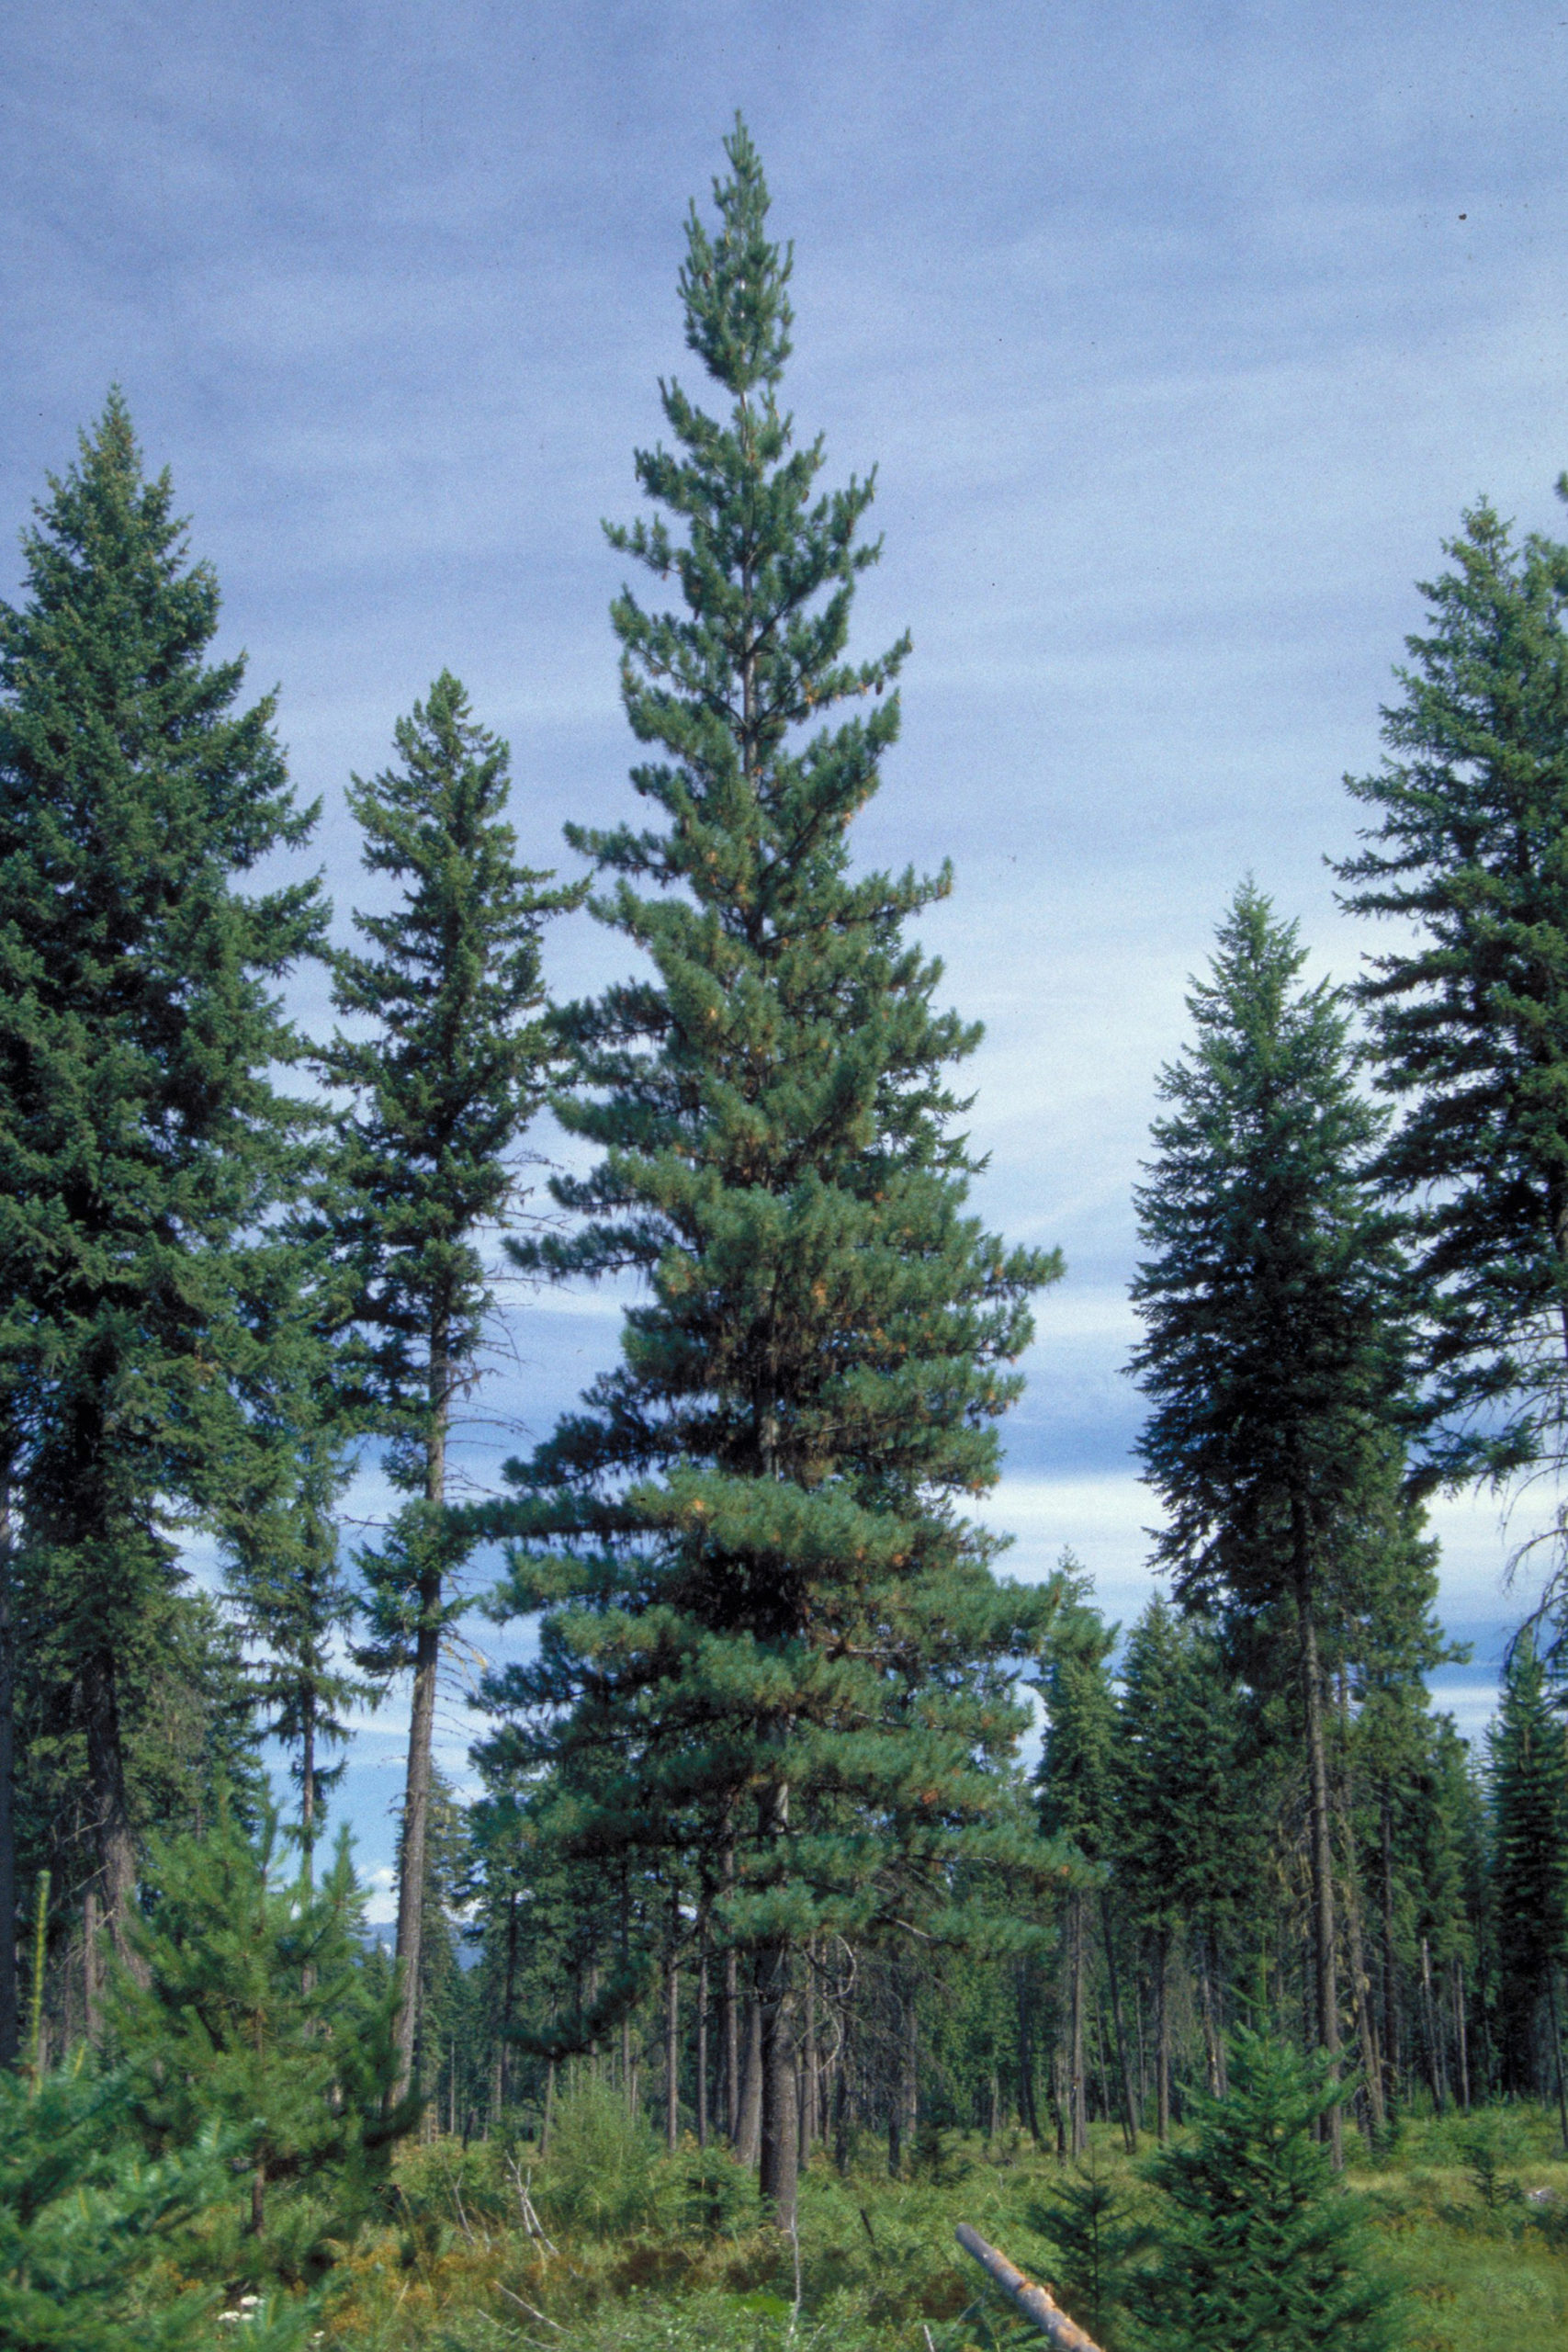
western white pine in Idaho; photo by Chris Schnepf, #1171053 Bugwood

In this blog I will use one site-specific study to demonstrate what forest resources we are losing as a result of non-native pest introductions – in this case, the pathogen causing white pine blister rust.

The study was carried out nearly a decade ago by two eminent USFS pathologists working in the forests of southwest Oregon (Coos, Curry, Douglas, Jackson, Josephine, and Lane counties). Ellen and Don Goheen analyzed the current and past presence of two giants of western forests, sugar pine (Pinus lambertiana) and western white pine (P. monticola), changes in their status, and causes of mortality.

Southwest Oregon is a region of high climatic, geologic, and floristic diversity. Its forests contain 26 species of conifers including three species of five-needle pines: sugar pine, western white pine, and whitebark pine (P. albicaulis). Of these, sugar pine is widely distributed in mixed conifer forests on a variety of sites but primarily at lower elevations or otherwise with warmer climates. Western white pine is more widely distributed, including at higher elevations and on ultramafic soils (defined here) in the Siskiyou Mountains. Whitebark pine is limited to the highest elevations on the Cascade crest and in scattered island populations in the Siskiyou Mountains.

Sugar and western white pines have great aesthetic, ecological, and economic value. They are large: 50% of the live sugar pines and 18% of the western white pines sampled in the study are 30 inches dbh or greater. They can reach heights for 200 feet. In the study area, sugar pines constituted just 5% of the live trees, but 17% of the basal area. These large trees provide important nesting cavities for wildlife.

All three five-needle pines are vulnerable to white pine blister rust (WPBR), which is caused by the introduced pathogen Cronartium ribicola. They are also vulnerable to lethal levels of infestation by the native mountain pine beetle (MPB; Dendroctonus ponderosae). What have been the combined impacts of these major pests?

As of the first decade of the 21st Century, WPBR and MPB are causing substantial mortality in all size classes, from saplings to large trees. Half of the total basal area of western white pine, 30% of the total basal area of sugar pines is comprised dead trees. The impact of MPB has been exacerbated by substantial increases in tree densities arising from decades of fire exclusion.

sugar pine in the Sierra Nevada; photo by S. Rae, via Flickr

Status Now

Looking at all forests in Oregon and Washington, sugar, western white, and whitebark pines, combined, were reported on 14% of  plots (a total of 2,128 plots) included in the Forest Inventory and Analysis (FIA) monitoring program. On these plots, western white was found on a little more than half (58%); sugar pine on one-third; and whitebark pine on only 16%.

Dead pines were found on a quarter of these 2,128 plots. Three quarters of the dead pines showed symptoms of WPBR, while 86% showed evidence of mountain pine beetle infestation. Among living pines, 32% were infected with WPBR, 10% had bark beetle attacks.

The intensive study of five-needle pines in southwest Oregon was based on both the FIA plots and other plots laid out as part of a separate Continuous Vegetation Survey. (See the methods section of the source.) Thus, the total for this study was 2,749 plots. In this study area, five-needle pines were more common than in the wider region. The three species grew on 31% of the 2,749 permanent plots examined — twice as high as the average for all of Oregon and Washington. Sugar pine grew on 64% of the five-needle pine plots; western white pine on 53%; whitebark on only 0.5%.

Agents of Mortality in Southwest Oregon

WPBR was ubiquitous – in more than 93% of pine stands surveyed. Already, 13% of the sugar pines and 17% of western white pines were dead. This proportion is far higher than the 5% of trees of all tree species in the same stands that were dead. In both hosts, 80 – 90% of dead seedlings and saplings had been killed by WPBR. Additional losses are probable: most of the surviving pole-sized and smaller trees had cankers near their boles, so the scientists thought they would probably soon succumb.

The mountain pine beetle’s impact is even worse, especially on larger trees. Trees killed by MPB attacks were encountered in 84% of surveyed stands. MPB had infested 73% of dead large sugar pines (> 20 cm (8 in) dbh), 69% of dead large western white pines.

Other agents, including root diseases, dwarf mistletoes, and pine engraver beetles influence five-needle pine health in southwest Oregon to a much lesser extent than WPBR or MPB. The exception is the Siskiyou Mountains, where the ultramafic soils provide suboptimal growing conditions. These agents might weaken trees to some extent, thus predisposing them to MPB infestation. WPBR infections might have similar effects by killing tops and numerous branches of large trees.

Specifics

1. Mountain pine beetle is native to southwest Oregon. Levels of infestation have varied over the decades since measurements began in the 1950s. Infestations have probably increased substantially in recent decades, linked to the cooler, shaded conditions found in dense stands that have resulted from fire suppression. In addition to the infestations on western white and sugar pines described above, MPBs have caused significant mortality in mature whitebark pines. There is evidence of infestation on 31% of all dead whitebark pines.

In southwest Oregon, MPB have killed five-needle pines in most years; here, they are less closely tied to drought than in other parts of the West.

2. White pine blister rust probably reached southwest Oregon in the 1920s. Its presence and intensity is greatly influenced by climate and environmental conditions. Southwest Oregon has a Mediterranean climate that is less favorable to rust spread — yet, the disease is widespread and devastating. The combination of microsites supporting cooler and moister conditions – perhaps especially where fogs linger – mean that disease is most prevalent on flat or gently sloping areas and northern aspects, at higher elevations.

Blister rust requires an alternate host, usually gooseberry (Ribes spp), to complete its life cycle. Perhaps surprisingly, in southwest Oregon it is not necessary for Ribes to be close to the pines for the trees to become infected. One reason is probably the presence of other alternate hosts in the Castilleja (paintbrushes) and Pedicularis (louseworts) genera. The other likely explanation is transport by fog banks of spores from Ribes in canyons and valleys to the higher-elevation slopes.

Despite the high levels of mortality caused by WPBR and MPB, there is substantial regeneration of both western white and sugar pines. However, the numerous seedlings are unlikely to grow into dominant trees unless released from the competition found in overstocked, dense stands. Therefore, even in the absence of WPBR, the Goheens consider the seedlings’ futures to be tenuous if they are not eventually exposed to more sunlight through management or natural disturbance.

These Threats Have Been Present for Decades

The Goheens compared their findings to those of several past studies; the results confirm that five-needle pines have suffered high levels of mortality since the 1950s due to WPBR and other factors. All the western white pines had disappeared from two of four sites. Significant declines were observed at the two other sites in the Umpqua and Rogue River National forests.

Forest stands in 10 “Areas of Special Interest” that in 1825 were open, park-like stands with widely spaced trees had become dense dominated by Douglas-fir, true firs, and incense-cedar.

Sugar pines, which in 1825 had made up as much as a third of the trees in the low elevation stands had been reduced to very low numbers.

The Goheens note that all these threats are directly caused or greatly influenced by human activities. Noting that sugar and western white pines provide many values in the forests of southwest Oregon, they called for management using appropriate, integrated, silvicultural prescriptions to ensure the future of western white and sugar pines in southwest Oregon.

SOURCE

Goheen, E.M. and D.J. Goheen. 2014. Status of Sugar and Western White Pines on Federal Forest Lands in SW OR: Inventory Query and Natural Stand Survey Results. USDA Forest Service Pacific Northwest Region. SWOFIDSC-14-01 January 2014

Posted by Faith Campbell

We welcome comments that supplement or correct factual information, suggest new approaches, or promote thoughtful consideration. We post comments that disagree with us — but not those we judge to be not civil or inflammatory.

For a detailed discussion of the policies and practices that have allowed these pests to enter and spread – and that do not promote effective restoration strategies – review the Fading Forests report at http://treeimprovement.utk.edu/FadingForests.htm

New Asian Defoliator – a Threat to Elms?

symptomatic feeding by EZM larva; photo by Gyorgy Csoka via Bugwood

The elm zigzag sawfly (EZM; Aproceros leucopoda) was reported in the Western Hemisphere for the first time in Quebec in July 2020.

In 2021, only a year later, the sawfly was confirmed in northern Virginia [David Gianino, State Plant Regulatory Official (SPRO) of Virginia, pers. comm.]  

There is 700 miles between Quebec and Virginia.

In September 2022, the sawfly was detected in St. Lawrence County, New York — just across the St. Lawrence River from Canada, where the insect has been known for two years. There is no information yet on impacts. [Brynda, S. “New pest affecting elm trees in St. Lawrence County.” October 3, 2022.

Impact in Europe

Elm zigzag sawfly is native to Eastern Asia — Japan and China for certain and, possibly Far Eastern Russia. There it is considered a minor pest. Serious localized defoliation, though, has been reported at least once, on the island of Hokkaido (Blank et al. 2021).

The sawfly was first detected outside its native range in Hungary and Poland in 2003. By 2010, the outbreak was revealed to be present over an area of 1,700 km, from eastern Ukraine to Austria. Other countries reporting the sawfly were Hungary, Poland, Romania, and Slovakia (Blank et al. 2010). Spread continued. By 2013 or 2014 elm zigzag sawfly was also reported in Belgium, Netherlands, and Germany — apparently the result of separate instances of human-assisted transport. German scientists calculated a natural spread rate of 45–90 km/yr. By 2018 the insect had reached the United Kingdom.

Severe localized defoliation by the species has been recorded on elms in a variety of situations across Europe. In some countries, defoliation has reached 74% or higher, even 100%. However, in other countries, such as Bulgaria, defoliation rates appear to be much lower (1-2%). Aproceros leucopoda showed no preference for host trees of a particular age. Heavily defoliated trees in Hungary did not seem to be dying (Blank et al. 2010).

The fear – in Europe and North America – is that elms already severely depleted by Dutch elm disease will be unable to sustain any decline in vigor caused by defoliation (Blank et al. 2010)

Probable Hosts

On the European continent, the sawfly has fed on several elms, including Ulmus minor, U. pumila and U. pumila var. arborea, U. glabra, and possibly. U. laevis (Blank et al. 2010). In the United Kingdom, it has fed on English elm (Ulmus procera), wych elm (U. glabra) and field elm (U. minor).

In Japan, collaborators in the Blank et al. (2010) study collected sawfly larvae on U. japonica and U. pumila.

In Virginia, larvae were collected from Chinese elm (U. parvifola).   However, all species of elm trees native to North America are considered at risk. Also threatened are the native elm-browsing insects which might be out-competed by elm zigzag sawfly.

How the Sawfly Is Moved

Some have suggested that the EZS is transported on plants for planting, but they have not reported observations.  Because elms are usually moved while dormant, it is more likely that the cryptic wintering cocoons are transported in leaf litter accompanying the trees rather than on the trees themselves.

American elms in Arlington County, Va; photo by F.T. Campbell

Worrying Traits

The elm zigzag sawfly matures very rapidly. The total time from oviposition to emergence of mature individuals is 24–29 days (Blank et al. 2010). They can produce up to six or seven generations per year. The sawfly is also parthenogenic, so it can reproduce in the absence of males. As a result, populations can build up rapidly. No specific predators are known. The impact of generalist native parasitoids in Europe has not yet been studied.

Also, EZS tolerates a wide range of climates. Conditions on Hokkaido are similar to those in Central Europe. However, Hokkaido’s winters are usually colder, summers warmer, and annual precipitation higher. Blank et al. (2010) did not know limiting temperature and humidity but thought it probable that this species could spread into northern and south-western Europe wherever elms grow. In North America, the Canadian Food Inspection Agency expressed concern that EZS would be able to withstand temperatures as low as –30 °C which includes much of Canada.

While the elm zigzag sawfly was on the Alert List on the European and Mediterranean Plant Protection Organization (EPPO), in 2015 it was removed since no EPPO member country had requested international action (Blank et al. 2010).

SOURCES

Blank, S.M., H. Hara, J. Mikulas, G. Csoka, C. Ciornei, R. constantineanu, I. Constantineanu, L. Roller, E. Altemhofer, T. Huflejt, G. Vetek. 2010. Aproceros leucopoda (Hymenoptera: Argidae): An East Asian pest of elms (Ulmus spp.) invading Europe. European Journal of Entomology · March 2010

DOI: 10.14411/eje.2010.045

Blank, S.M., T. Köhler, T. Pfannenstill, N. Neuenfeldt, B. Zimmer, E. Jansen, A. Taeger, A.D. Liston. Zig-zagging across Central Europe: recent range extension, dispersal speed and larval hosts of Aproceros leucopoda (Hymenoptera, Argidae) in Germany. https://jhr.pensoft.net/articles.php?id=4395

Sinon, S.  First confirmed sighting of a new invasive in North America: elm zigzag sawfly – Invasive Species Centre. https://www.invasivespeciescentre.ca/first-confirmed-sighting-of-a-new-invasive-in-north-america-elm-zigzag-sawfly/

(United Kingdom) Forest Research Elm zigzag sawfly (Aproceros leucopoda) https://www.forestresearch.gov.uk/tools-and-resources/fthr/pest-and-disease-resources/elm-zigzag-sawfly/

Posted by Faith Campbell

We welcome comments that supplement or correct factual information, suggest new approaches, or promote thoughtful consideration. We post comments that disagree with us — but not those we judge to be not civil or inflammatory.

For a detailed discussion of the policies and practices that have allowed these pests to enter and spread – and that do not promote effective restoration strategies – review the Fading Forests report at http://treeimprovement.utk.edu/FadingForests.htm

In the News: Big, Colorful Joro Spider

Joro spider; photo by Dorothy Kozlowski, University of Georgia

Lately there has been lots of media attention to an introduced spider which has attracted attention because it is large and showy – and very numerous in 2021. The Joro spider, (Trichonephila (formerly Nephila) clavata) is — like so many introduced organisms — from East Asia (Japan, China, Korea, and Taiwan) (Hoebeke, Huffmaster and Freeman 2015; full citation at the end of the blog).

The spider was originally found in 2013 at several locations in three counties of northeast Georgia. All were near warehouses and other facilities associated with Interstate-85, a major transport corridor (Hoebeke, Huffmaster and Freeman 2015).

The Joro spider is one of about 60 species of non-indigenous spiders (Araneae) that have been detected in North America. The majority originated in Europe and Asia (species list posted here; see Araneae).

The Joro spider is one of the golden orb-web spiders, a group with conspicuously large and colorful females that weave exceptionally large, impressive webs. One species of the genus, N. clavipes (L.), occurs in the Western Hemisphere. It is found throughout Florida, the West Indies, as far north as North Carolina, across the Gulf States, through Central America, and into South America as far south as Argentina. It is also known as the “banana spider” or “golden silk spider.” (Hoebeke, Huffmaster and Freeman 2015)

Hoebeke, Huffmaster and Freeman (2015) describe both the spider’s discovery in Georgia (by Huffmaster) and how to distinguish it from other large spiders in the southeastern U.S. South Carolina has posted a fact sheet here.

In Asia and northeast Georgia, the spider apparently overwinters as eggs. Spiderlings emerge from the egg cocoons in the spring. Males reach maturity by late August. Females become sexually mature in September and early October. Oviposition occurs from mid-October to November resulting in the production of only a single egg sac. Large, mature females were first observed beginning in late September and persisted until mid-November when temperatures began to cool significantly. Most spiders were found in large webs attached to the exterior of homes near porch lights, on wooden decks, or among shrubs and flowering bushes near homes (Hoebeke, Huffmaster and Freeman 2015). By 2021 the webs were so numerous as to be consider major nuisances.

Probable Introduction Pathways

Hoebeke, Huffmaster and Freeman (2015) think the spiders are frequently transported (as adults or egg masses) in cargo containers, on plant nursery stock, and on crates and pallets. If accidental transport were to occur in late August to early October from East Asia, then the spiders’ reproduction would be at its height and there would be a greater likelihood that egg masses might be deposited on structures or plant material being exported.

This thought is supported by an email sent to Hoebeke in 2016 that a Joro spider had been seen on the outside of a freight container in Tacoma, Washington.  There has been no report of additional sightings in Washington State (Hoebeke pers. comm.)

Spread within the United States

By 2021, the Joro spider had been detected in at least 30 counties in north and central Georgia, adjacent South Carolina; Hamilton and Bradley counties in Tennessee; and Rutherford and Jackson counties in North Carolina (Hoebeke pers. comm.).  See the map here.

Spread in the United States is probably associated with major transport routes. The original detections were 64 km northeast of Atlanta near a thriving business location on the I-85 business corridor,

It is also possible that spiderlings balloon, that is, ride air currents to move some distance. This distance can be miles, depends on the spider’s mass and posture, air currents, and on the drag of the silk parachute (Hoebeke, Huffmaster and Freeman 2015). The 2014 Madison County detection in northeast Georgia was not near transport corridors but in a rural mixed farm landscape, downwind from the other sites. Males also use ballooning to find females for mating (Gavriles 2020).

How might the Joro spider affect the local ecosystem?

Many questions exist about the Joro spiders’ impact. Will they outcompete other orb weaving spiders – either native or nonnative? Will they reduce other insect populations through predation? Scientists do not yet see  indication of displacement of native spiders or depletion of prey species (Gavriles 2020; Hoebeke pers. comm.) 

Potential Range – update

In March 2022, two University of Georgia scientists (Andy Davis and Benjamin Frick) published a study that evaluated the Joro spider’s cold tolerance by studying the spider’s physiology and survival during a brief (2 minute) freeze. They found that the Joro spider’s more rapid metabolic and heart rates means it could probably survive throughout most of the Eastern Seaboard. The scientists reiterate earlier information that the Joro spider does not appear to have much of an effect on local food webs or ecosystems.

SOURCES

Cannon, J. Palm-sized, invasive spiders are spinning golden webs across Georgia in ‘extreme numbers’ https://www.usatoday.com/story/news/nation/2021/09/29/scientists-say-invasive-joro-spiders-here-stay-georgia/5917913001/  accessed 21-11/5

Gavrilles, B. Like it or not, Joro spiders are here to stay. October 26, 2020 https://news.uga.edu/joro-spiders-are-here-to-stay/

Hoebeke, E. Richard. University of Georgia Department of Entomology

Hoebeke, E.R., W. Huffmaster, and B.J. Freeman. 2015 Nephila clavata L. Koch, the Joro Spider of East Asia, newly recorded from North America (Araneae: Nephilidae) PeerJ https://peerj.com/articles/763/#

Posted by Faith Campbell

We welcome comments that supplement or correct factual information, suggest new approaches, or promote thoughtful consideration. We post comments that disagree with us — but not those we judge to be not civil or inflammatory.

For a detailed discussion of the policies and practices that have allowed these pests to enter and spread – and that do not promote effective restoration strategies – review the Fading Forests report at http://treeimprovement.utk.edu/FadingForests.htm

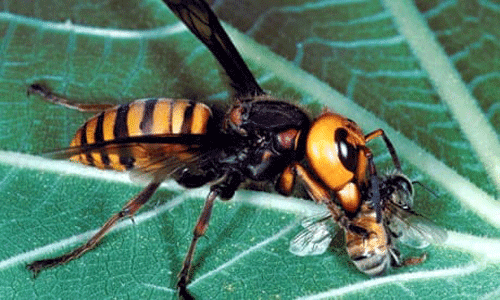
Asian giant hornet in Washington State: Update

Asian giant hornet; photo by Yasunori Koide; Wikimedia commons

They’re still here … and perhaps more widespread than thought last year. What officials have learned is that colonies are often high up in trees, not in the ground, as expected based on behavior in Asia. This makes detection and control especially difficult.

In June a citizen found a dead Asian giant hornet (AGH) male in Snohomish County. This county in the Seattle metropolitan area is separated from Whatcom County (site of last year’s detections) by a third county, Skagit County. The Washington State Department of Agriculture (WSDA) responded by setting up traps in Snohomish and King counties, and urging citizens to be alert and report any hornet sightings.

Equally worrying, the dead wasp was determined by appearance and genetics to be unrelated to the colonies detected in 2019 and 2020 in Washington and British Columbia. Trapping in the areas found no additional specimens (S. Spichiger pers. comm.)

In July, WSDA designated the hornet genus Vespa as a quarantine pest; this action confirms WSDA authority to control access to nest sites.

nest eradication; WSDA photo

Nests Found and Destroyed

Starting in late summer, citizens began reporting sightings and officials succeeded in tracking hornets to their nests. However, it was not easy! Eradicating Asian giant hornets demands lots of resources and commitment. While all these nests were in Whatcom County – site of last year’s detections — it is clear that several colonies had been established. It seems to me highly unlikely that they have all been detected.

Detection of the first nest in 2021 came in August, following several visual detections of the hornets attacking nests of paper wasps. WSDA staff captured and tagged three hornets over a couple of days. They succeeded in tracking the third hornet when it reappeared a week later. The nest was destroyed (after removal of all hornets) on August 25th. This nest held nine layers of comb with 292 eggs, 422 larvae, and 563 prepuae. Nearly 200 adult hornets were killed. One queen was found. [Hornet Herald 21.07 Sept. 8 2021]  The nest was at the base of a dead alder tree in rural Whatcom County, east of Blaine, just 400 metres south of the Canadian border.

The second and third nests were detected on September 8 and 10, 2021. In these cases, tagging and tracking the hornets was easier than in August. Nest eradication was not easy, however. Both nests were high inside dead alder trees, making access difficult. Both nests held multiple combs with hundreds of larvae, eggs, and pupae. Fortunately, only one queen was found in each. [Hornet Herald 21.08; October 5, 2021]

No detections have occurred since these.

WSDA also collected data on foraging behaviors of wasps in the third nest. Data include information on periods during the day when the wasps are active, and what materials they bring back to the nest – which includes wood pulp for nest comb construction and insect thoraces for feeding the pupae. [Hornet Herald 21.08; October 5, 2021]

It is encouraging that only one queen was found in each nest; in 2020, the single nest officials destroyed held 200 queens!

Trapping in British Columbia

Although British Columbia officials increased the number of traps in 2021, and urged citizens to also set out traps, no confirmed AGH finds were made in British Columbia until early November, when one was caught in a trap set for Japanese beetles. This hornet was on the border with Washington, so officials are trying to determine whether it came from one of the nests already discovered there.

There were a couple of unconfirmed sightings. On October 22 a single, aged specimen was found in a Japanese beetle trap about 1.2 km north of the first hornet nest extracted this year in Washington. The beetle trap had been serviced one month earlier. Canadian government entomologists are analyzing the DNA of this specimen to see if it was related to the Washington State nests.

At least one citizen said he had seen an Asian giant hornet in July, but officials said they could not investigate until they had either a picture or a specimen.

Asian giant hornet with radio tag developed by USDA APHIS scientists

Intriguing wrinkle

Mattila et al. (2021) describe an “impressive array of strategies” Asian honey bees use to protect nests from attacks by hornets in the genus Vespa, including a previously unknown use of auditory and perhaps chemical signals to warn nest mates.  The authors suggest that this diverse alarm repertoire is similar to alarms issued by socially complex vertebrates such as primates and birds.

SOURCES OF INFORMATION

USDA Agriculture Research Service:  https://scientificdiscoveries.ars.usda.gov/highlights/asian-giant-hornet/

Washington State Department of Agriculture https://agr.wa.gov/hornets

Mattila, H.R., H.G. Kernen, G.W. Otis, L.T.P. Nguyen, H.E. Pham, O.M. Knight, N.T. Phan. 2021.

Giant hornet (Vespa soror) attacks trigger frenetic antipredator signalling in honeybee (Apis cerana) colonies. R. Soc. Open Sci. 8: 211215. https://doi.org/10.1098/rsos.211215

Posted by Faith Campbell

We welcome comments that supplement or correct factual information, suggest new approaches, or promote thoughtful consideration. We post comments that disagree with us — but not those we judge to be not civil or inflammatory.

For a detailed discussion of the policies and practices that have allowed tree-killing pests to enter and spread – and that do not promote effective restoration strategies – review the Fading Forests report at http://treeimprovement.utk.edu/FadingForests.htm

Threats to Oaks – Update

Quercus lobata in Alameda County, California; photo by Belinda Lo via Flickr

Five years ago I posted a blog about the threat to oak trees from non-native insects and pathogens. I am prompted to update what I said then by the publication of a monumental new analysis of endangered oak species (Beckman et al. 2021; full citation at end of blog). This report is packed with maps and graphics displaying centers of endemism, geographic areas with highest threat levels, etc., and individual profiles of all species it deems at risk.

The new study, led by the Morton Arboretum, says there are more than 200 oak species in North America – including Mexico; but only 91 species native to the United States. Of these, 28 species qualify as “of conservation concern” – defined as facing a moderate or greater threat. The principal threats to oak species are small populations or ranges and conversion of habitats for human use. Overall, 10 (36%) of the oak species “of conservation concern” have some actual or potential exposure to established non-native pests.

The report states that two species are significantly threatened by a non-native pathogen: Shreve oak (Quercus parvula) by the sudden oak death pathogen Phytophthora ramorum and Ogelthorp oak (Q. ogelthorpensis) by the chestnut blight pathogen Cryphonectria parasitica. 

Several other California oaks are under some level of attack by the polyphagous and Kuroshio shot hole borers. The goldspotted oak borer (GSOB) is mentioned only in the individual species’ profiles, and largely as a potential or undetermined threat. For example, Engelmann oak (Quercus engelmannii) is reported to have suffered some damage from GSOB but that mortality is “likely a result of a complex of factors (e.g., drought and root diseases).” The potential threat from both SOD and oak wilt is mentioned for several of the oaks that are in the red oak subgenus (Erythrobalanus).

The Morton Arboretum’s determination is based on the fact that the non-native insects and pathogens that I described five years ago are attacking primarily widespread species and have not – to date – caused sufficient damage to imperil those species. This situation contrasts sharply with certain Lauraceae (e.g., redbay) threatened by laurel wilt disease; five-needle pines killed by white pine blister rust; eastern or Canadian hemlock killed by hemlock woolly adelgid; and American beech, which now faces threats from beech bark disease, beech leaf disease, and possibly European beech leaf weevil.

Meanwhile, the non-native pests of oaks that I described five years ago continue to spread.

My Update Incorporating Morton Arboretum’s Analysis: Threats in the East

In the East (from the Atlantic Ocean to the Great Plains), oaks are under serious attack from two non-native pests; a third pest has been suppressed by biological control.

oaks killed by European gypsy moth, Shenandoah National Park; photo by F.T. Campbell
  • The European gypsy moth (Lymantria dispar). The APHIS quarantine map shows its spread to be largely contained. The moth is currently present throughout the Northeast as far west as Wisconsin and neighboring parts of Minnesota and Illinois; and as far south as Currituck and Dare counties in North Carolina. The European gypsy moth continues to be the target of major containment and suppression programs operated by USDA Animal and Plant Health Inspection Service (APHIS), the US Forest Service and the states. For years US Forest Service spent half of its entire budget for studying and managing non-native pests on the European gypsy moth. By FY2021, this allocation had been reduced to a quarter of the total budget.  The European gypsy moth is the most widespread non-native pest (see map, linked to above) and attacks a wide range of tree and shrub species. Still, it rarely causes death of the trees.
  • Oak wilt (caused by the fungus Ceratocystis fagacearum) is widespread from central Pennsylvania to eastern Minnesota and across Iowa, down the Appalachians in West Virginia and North Carolina-Tennessee border, in northern Arkansas and with large areas affected in central Texas. There are several outbreaks in New York State. The most recent map I can find is from 2016 so it is difficult to assess more recent status. In that year, the US Forest Service called oak wilt one of the most serious tree diseases in the eastern U.S. It attacks primarily red oaks and live oaks. It is spread by both bark-boring beetles and root grafts.

In 2016 I also listed the winter moth (Operophtera brumata) as a threat. Now, its presence in coastal areas of New England and Nova Scotia (and British Columbia) has been reduced to almost nuisance levels by action of the biological control agent Cyzenis albicans. (See this report.)

SOD-infested rhododendron plant; photo by Indiana Department of Natural Resources

The most significant potential threat to eastern oaks identified to date is the sudden oak death (SOD) pathogen, Phytophthora ramorum. Several oak species have been shown in laboratory studies to be vulnerable to infection by this pathogen. Furthermore, the climate in extensive parts of the East is considered conducive to supporting the disease. SOD has not been established in the East. However, too frequently SOD-infected plants have been shipped to eastern nurseries, where some are sold to homeowners before regulatory officials learn about the situation and act to destroy the plants.

My Update Incorporating Morton Arboretum’s Analysis: Threats in the West

In the West, millions of oaks have been killed by several pathogens and insects that are established and spreading. Another has been introduced since my earlier blog (see Mediterranean oak beetle, below). Additional threats loom, especially Asian species of tussock moths.

  • Coast live oaks, canyon live oaks, California black oaks, Shreve’s oaks, and tanoaks growing in coastal forests from Monterey County north to southern Oregon that catch fog/rain are being killed by sudden oak death (SOD). In this region, SOD has killed an estimated 50 million trees. While the preponderance of dead trees are not true oaks, but tanoaks (Notholithocarpus densiflorus), significant numbers of coast live oak (Quercus agrifolia), Shreve oak (Q. parvula var. shrevei), and California black oaks (Q. kelloggii) have also been killed. SOD continues to intensify in this region, and to expand.  Sixteen California counties are now infected, and the infection in Curry County, Oregon has spread farther North. More worrying, two additional strains of the pathogen have been detected in forests of the region.

The Morton Arboretum analysis singled out Q. parvula as particularly threatened by SOD. Californians note that it is the subspecies Q. parvula var. shrevei that is threatened by SOD; the other subspecies, Q. parvula var. parvula (Santa Cruz Island oak) is – so far – outside the area infested by SOD.

California black oak killed by GSOB; photo by F.T. Campbell
  • Also in California, coast live oaks, black oaks, and canyon oaks in the southern part of the state are being killed by goldspotted oak borer.  Confirmed infestations are now in San Diego, Orange, Riverside, San Bernardino, and Los Angeles counties. See the map here. At least 100,000 black oaks have been killed in less than 20 years. Neither the State of California nor USDA APHIS has adopted regulations aimed at preventing spread of the goldspotted oak borer.

The Morton Arboretum analysis considers California black oak (Q. kellogii) to be secure.

  • Two more wood-boring beetles threaten oaks in southern California – the Polyphagous and Kuroshio shot hole borers. One or both of the invasive shot hole borers are known to be present in San Diego, Orange, Los Angeles, Riverside, San Bernardino, Ventura, and Santa Barbara counties. The beetles feed on coast live oaks, canyon live oaks, Engelmann oaks, and valley oaks – as well as many other kinds of trees. In the process, the beetles transmit a fungus that kills the tree. Many of the vulnerable tree species anchor the region’s riparian areas and urban plantings. See a map of the shot hole borers’ distribution here.
  • In November 2019, scientists discovered a new ambrosia beetle in symptomatic valley oaks (Quercus lobata) trees in Calistoga, Napa County. The insect was determined to be a European species, Xyleborus monographus. The common name is Mediterranean oak borer, or MOB. Within a few months it was known that this beetle is fairly widespread in Napa and neighboring Lake counties. The beetle had never been intercepted at ports in California or found in traps designed to detect bark beetles deployed in the San Francisco Bay area but not including Napa or Sonoma. Like other beetles in the Scolytinae subfamily, MOB can transmit fungi. One of the fungal species detected in the Calistoga infestation is Raffaelea montetyi, which is reported to be pathogenic on at least one European oak species.

The California Department of Food and Agriculture proposed assigning a pest rank to the beetle in December 2020.  In their draft document ranking risk, state officials note that a proven host — Q. lobata — is widespread in California and the insect is probably capable of establishing over much of the state. The possible economic impact was described as possibly affecting production of oaks in California nurseries and triggering quarantines. 

Therefore, X. monographus could exacerbate the effects of SOD on California oaks.

The Morton Arboretum has singled out Q. lobata as at risk because of conversion of more than 90% of its habitat to agriculture.

Asian gypsy moths swarm a ship in Nakhodka, Russian Far East; USDA APHIS photo

A looming potential threat to oaks on the West coast is the risk that tussock (gypsy) moths could be introduced to the area. The risk is two-fold – the Asian gypsy moth continually is carried to the area on ships bearing imports from Asia (as discussed in my blog in April). The European gypsy moth is sometimes taken across the country from its widespread introduced range in the East on travellers’ vehicles, outdoor furniture, or firewood. Both the West Coast states and USDA search vigilantly for any signs of gypsy moth arrival.

SOURCES

Beckman, E., Meyer, A., Denvir, A., Gill, D., Man, G., Pivorunas, D., Shaw, K., & Westwood, M. (2019). Conservation Gap Analysis of Native U.S. Oaks. Lisle, IL: The Morton Arboretum. https://mortonarb.org/app/uploads/2021/05/conservation-gap-analysis-of-native-US-oaks_sm.pdf

Posted by Faith Campbell

We welcome comments that supplement or correct factual information, suggest new approaches, or promote thoughtful consideration. We post comments that disagree with us — but not those we judge to be not civil or inflammatory.

For a detailed discussion of the policies and practices that have allowed these pests to enter and spread – and that do not promote effective restoration strategies – review the Fading Forests report at http://treeimprovement.utk.edu/FadingForests.htm

Invasive Plants – an Overview

It’s everywhere! multiflora rose (photo by Famartin)

The United States is overrun with introduced plants. Five years ago, Rod Randall’s database listed more than 9,700 non-native plant species as naturalized in the U.S. Not all of these species were “invasive”.

At that time, regional invasive plant groups listed the following numbers of invasive species in their regions:

  • Southeast Exotic Plant Pest Council – approximately 400 invasive plants
  • Mid-Atlantic Invasive Plants Council – 285 invasive plants
  • Midwest Invasive Plants Network reported that state agencies or state-level invasive plant councils in its region listed more than 270 plant species as invasive, noxious, or pest species
  • California Invasive Plants Council listed 208 species.
  • Texas Invasives reported more than 800 non-native plant species in the state, of which 20 were considered invasive.

Species – Rankings and Extents

We know that these invaders are affecting wide swaths of many ecosystems. A recent study based on Forest Inventory and Analysis (FIA) data (explained here) showed that nation-wide, 39% of forested plots sampled contained at least one invasive species.  Hawai`i was first, at 70%. Eastern forests were second, at 46%. In the West overall, 11% of plots contained at least one invasive species. Plots in both Alaska and the Intermountain states were at 6% of plots invaded.  A different study (Barrett and Robertson 2021; full citation at end of blog) reported the proportion of Western forest covered by invasive plants. This approach resulted in different numbers, but the same general ranking: Hawai`i again “led” at 46%; Pacific Coast states at 3.3%; Rocky Mountain states at 0.75%; coastal Alaska at 0.01%.

In more arid regions, data from the Bureau of Land Management showed that invaded acreage had more than doubled between 2009 and 2015.

buffelgrass removal in Tucson; Photo by Julia Rowe, Arizona Sonora Desert Museum

The situation is expected to get worse: a study of just one small portion of U.S. naturalized plants found that non-native plant species were more widely distributed than native species and that the average invasive plant inhabited only about 50% of its expected range. Furthermore, human actions were more important in facilitating spread than the species’ biological attributes.

Most of the detailed studies have been conducted in the Northeast – by both Forest Service and National Park Service scientists. The USFS’ Northern Region (Region 9) contains 24 states, from Maine to Minnesota, from Delaware to Missouri. A review of forest inventory (FIA) data (Oswalt et al. 2015) provided details on 50 plant species.   (Unfortunately, the Southern Region [Region 8] has chosen to report in different formats, so it is hard to get an overall picture of invasive plants throughout the forests of the entire East. This is especially annoying to those of us who live in Mid-Atlantic states, which are divided between the two regions.)

Oswalt et al. (2015) provided data on the percentage of FIA plots in each state that were reported to have at least one invasive plant species. The northern Midwest ranked highest – e.g., one state (Ohio) at 93%; one state (Iowa) at 81%; two states (Indiana and Illinois) above 70%. Parts of the Mid-Atlantic region were almost as invaded – West Virginia at 79% and Maryland at 65%.  The Northern plains states ranked lowest in invasions – North Dakota at 29% and South Dakota at 15%.

A study by the National Park Service of part of the Northeast (from Virginia and West Virginia to Maine) found a situation similar to that found by USFS researchers. In 35 of 39 park units, more than half of the plots had at least one invasive plant species when the 2015-2018 survey began. In 10 parks (a quarter of those surveyed), every plot had at least one. Invasions are worsening: 80% of the park units showed there was a significant increase in at least one trend measuring abundance.

Japanese stiltgrass in Shenandoah National Park; Photo by J. Hughes

The USFS and NPS report different species to be most widespread. In the National Park Service-managed units, Japanese stiltgrass (Microstegium vimineum) was found on 30% of all plots, in more than 75% of all NPS-managed  units in the study. This magnitude comes despite the species not being found north of 41o N latitude. In forest plots inventoried by the USDA Forest Service, Japanese stiltgrass was the 14th most widespread species in the Northern region. I speculate that the species might not be common in the upper Midwest, which was not included in the NPS study. Oswalt et al. (2015) noted that Japanese stiltgrass was the 5th most common invasive plant in the Southern region.

Both studies agreed that garlic mustard (Alliaria petiolata) is widespread. The NPS study found it to be the most frequently detected non-grass herbaceous species, detected in 20% of plots throughout the study area (Virginia and West Virginia to Maine). On forest plots monitored by the USFS, garlic mustard was the 3rd most frequently detected species, on 4.5% of the surveyed plots. The species is reported to be present in 36 states & 5 provinces.

Why do Studies Ignore Deliberate Planting as a Factor?

Both USFS & NPS found shrubs and vines to be highly widespread. NPS specified Japanese barberry (Berberis thunbergii), Japanese honeysuckle (Lonicera japonica), multiflora rose (Rosa multiflora), and wineberry (Rubus phoenicolasius). USFS FIA data showed multiflora rose to be the most frequently recorded invasive plant, present on 16.6% of surveyed plots. It is otherwise recorded in 39 states and 5 provinces. Multiflora rose is almost ubiquitous in some states; in Ohio it is recorded on 85% of the plots. “Roses” were reported to be the 3rd most common invasive plant in the Southern Region. Other shrubs also dominated FIA plot detections: European buckthorn was 4th most frequently detected species, present on 4.4% of survey plots; or in 34 states and 8 provinces. Its presence is highest in New York, at 16.8% of plots. If the plots invaded by the various bush honeysuckle species do not overlap, these shrubs occupy 9.5% of all surveyed plots – second to multiflora rose. The vine Japanese honeysuckle ranked 6th – present on 3.6% of survey plots across the region. Japanese honeysuckle is reported to be the most common invasive plant in the Southern region. Other shrubs ranking 12th or above included Autumn olive and Japanese barberry

Tree-of-heaven (Ailanthus altissima) was the most common invasive tree found in National parks, again, despite not growing north of 41o N latitude. It is found in 9% of plots.

Ailanthus

I will say that I find it extremely annoying that the scientists carrying out these studies never mention that virtually all these shrub species had been deliberately planted in forests or nearby lands! Instead, they focus on such factors as histories of agriculture and other disturbances and fragmentation.  It is well documented (e.g., Lehan et al. 2013) that the vast majority of shrub species introduced to the U.S. were introduced deliberately. Furthermore, more than 500 plant species invasive in some region are being sold on-line globally.

Deliberate planting of species that turn out to be invasive is also rarely recognized in the West, e.g., Pearson et. al. There, the motivation for planting might be livestock forage or erosion control rather than wildlife habitat “enhancement” or ornamental horticulture.

I am pleased that the most recent study (Barrett and Robertson 2021) differs somewhat by noting (sometimes) both invasions by forage grasses and the appearance in the mesic forests of Pacific states such planted species as Armenian blackberry. However, while this report notes the potential that pathogens might be transported to new areas by restoration planting and “assisted migration”, it does not mention the concomitant risk of introducing plant species that might prove invasive in the naïve ecosystems.

English ivy invading forest in Washington State; photo from Washington Noxious Weed Board

[Go to the earlier blogs linked here and the Western forests report for discussions of management strategies.]

Annual reports from the NPS Invasive Plant Management Teams (IPMTs; before FY19, “Exotic”, so EPMTs) provide some information about the agency’s efforts to control invasive Plants. Go to Invasive Plant Management Teams – Biological Resources Division (U.S. National Park Service) (nps.gov) . Scroll down to the short paragraph under the heading “Learn about how the teams are actively working …” This link takes you to reports from FYs 2016 – 2018. Reports from FY19 and FY20 will be added soon. Currently at FY 2019 is at https://irma.nps.gov/DataStore/Reference/Profile/2286813  & FY 2020 is at  https://irma.nps.gov/DataStore/Reference/Profile/2286814

New Information from Study of Forests in the West

Barrett and Robertson (2021) state that although invasive plants are increasing in extent and intensity in Western forests, they are usually considered to be contributing factors rather than as proximate causes. However, they note two caveats: 1) determining the ultimate causes and resulting implications of these recent increases is more difficult; and 2) data are particularly poor on plant species’ presence. Indeed, the FIA survey process link is ineffective for early detection and tactical monitoring [that is, identifying particular species in specific habitats of concern] of plant invasions.

Of the 23.4 M ha of forested lands that have experienced a disturbance over a five-year window (the time frame for FIA), only 600,000 ha was affected by the combined categories of geologic, vegetation, and other disturbances. (This is 10% of the area affected by either insects or pathogens.) Cheatgrass (Bromus tectorum) was by far the most abundant species in Western forests, covering 480,000 ha, or about 0.49%cover of all forested land in the conterminous Western United States. Because of the difficulties of surveying, Barrett and Robertson (2021) conclude that the area covered by IAS plants on the Pacific Coast and Rocky Mountains could be twice recorded values.

FIA surveys detected the highest number of non-native plant species in the forests of the continental Pacific states — 259 species. Many were grasses (although different species than in the Rockies), but shrubs and other forbs were also present. In the Rocky Mountain states the surveys detected a total of 195 non-native species, primarily grasses. FIA surveys in Hawai`i detected 136 non-native species. The most abundant was strawberry guava, which was detected on 9% of the forested area in the state. Surveys of FIA plots in coastal Alaska detected only 8 non-native plant species; common dandelion was the most abundant. Except in Hawai`i, the plants were expected to have substantially lower impacts than in eastern forests

I note that the US Geological Service (Simpson and Eyler, 2018) reports there are approximately 1,754 non-native plants in Hawai`i and 424 in Alaska. Not all are necessarily invasive. And the USGS study covered all of Alaska, not just the southeastern coastal region.

Barrett and Robertson (2021) found that plant invasions are less extensive in older forest stands, mesic stands in contrast to drier areas and those with sparse or open tree canopies, and farther from roads. Thus, invasive plant cover was higher in hardwood and low-elevation and dry conifer forest types than in high-elevation and moist conifer types. In Hawai`i, mean plant cover was more than 40 % in all forest types except cloud forest, where it was 7.8 %. Again, proximity to roads was mentioned in the context of the likelihood of disturbance but no mention was made of the fact that households and businesses (e.g., tourist facilities, even agency facilities!) might deliberately introduce plants – e.g., horticulture.

Barrett and Robertson (2021) expect the impacts of NIS plants on forest lands to increase in the future, due to both additional introductions (despite efforts to prevent such) and spread of established species. They note that every disturbance creates an opportunity for the many ruderal and graminoid species to establish – facilitated by their abundance nearby. They note the significant challenge presented by secondary invaders, which often respond to space made available by “weed control” projects better than natives.

I welcome their concern about shade-tolerant plants apparently increasing in wetter areas of the Pacific coast states. They note that the presence of non-native plants in a forest is less obvious, and the impacts might be more subtle, perhaps primarily affecting tree regeneration through competition or other effects (e.g., promoting fire). Barrett and Robertson (2021) note that many of the shade-tolerant non-native species abundant in temperate Eastern U.S. forests (e.g., garlic mustard) are present in the West and are likely to become important.

SOURCES

Barrett, T.M. and G.C. Robertson, Editors. 2021. Disturbance and Sustainability in Forests of the Western US. USDA Forest Service Pacific Northwest Research Station. General Technical Report PNW-GTR-992

March 2021

Simpson, A., and Eyler, M.C., 2018, First comprehensive list of non-native species established in three major regions of the United States: U.S. Geological Survey Open-File Report 2018-1156, 15 p., https://doi.org/10.3133/ofr20181156.

ISSN 2331-1258 (online)

Posted by Faith Campbell

We welcome comments that supplement or correct factual information, suggest new approaches, or promote thoughtful consideration. We post comments that disagree with us — but not those we judge to be not civil or inflammatory.

For a detailed discussion of the policies and practices that have allowed tree-killing pests to enter and spread – and that do not promote effective restoration strategies – review the Fading Forests report at http://treeimprovement.utk.edu/FadingForests.htm  (These reports do not discuss invasive plants.)

Tuning in to the News – Mostly Depressing

In late July I participated in the annual meeting of the National Plant Board (NPB) – the organization representing the states’ phytosanitary agencies. USDA’s APHIS, DHS’ Bureau of Customs and Border Protection (CBP), and various industry associations also participated in the meeting. As usual, I learned lots of depressing developments.

A. Old problems continue to vex:

rhododendron plant infested by P. ramorum; photo by Jennifer Parke, Oregon State University

1) Sudden Oak Death in the Nursery Trade – Again!!!

As you might remember, spring 2019 saw an alarming number of plants infested by the sudden oak death pathogen (Phytophthora ramorum) shipped from west coast nurseries to nurseries in 18 states. Another major incident occurred in 2021. The California Oak Mortality Task Force (COMTF) newsletter for June 2021 reports that one nursery in Oregon shipped plants exposed to P. ramorum to big-box stores in 36 states — twice the number of states that received pathogen-exposed plants in 2019.

The first such incident was in 2004 – 17 years ago! Officials of the states that receive these infested plants are angry that every few years they must divert their resources from other duties to inspect nurseries in their states that have been exposed to the pathogen. They note that these “trace-forward” projects cost state governments money and prevent their carrying out other duties; they also impose significant costs on the in-state nurseries due to holds on sales. When infested plants are found, all these costs rise substantially.

The plant health official from Alabama noted that a single west coast nursery that had repeatedly been found to have infected plants shipped 29 lots of host plants to her state in spring 2021. As is clear from the COMTF article, other states also received thousands of plants that had been exposed to the pathogen. The Alabama official questioned why APHIS tilts so far toward a regulatory system that makes it possible for the “exporting” nurseries to ship. The result – too often – is that an infection at one small business can (repeatedly) impose high costs on hundreds of receiving nurseries and states. [I wonder whether anyone has considered a lawsuit against the source nurseries claiming damages? Would that be successful if the regulatory agencies approved the shipments because – at that time – their inspections had failed to detect the problem?]

Officials from the three west coast states, however, want to support their own nurseries’ efforts to relax regulations and maintain or open markets in the central and eastern states. They point to their own considerable efforts to inspect and certify the pest-free status of nurseries in their states.

Because of the different points of view among the states, the National Plant Board per se has never taken a position on the issue.

However, many states – and even APHIS Deputy Administrator El-Lissy – agree that something is not working. So APHIS is in the midst of reviewing its program, with input from NPB members. Such program reviews have been undertaken several times over the past 18 years. So far, they have never produced a program that effectively stops sales of pathogen-infested plants.

2) Contaminated Wood Packaging

Kevin Harriger of CBP reported that over the nine-month period October 2020 – June 2021, CBP intercepted 1,563 shipments that were in violation of ISPM#15, the international rule that requires that wood packaging be treated to kill pests. Most, or 1,148 shipments (73%), lacked the required mark certifying treatment. Four hundred fifteen (26%) of the total number of shipments had a live pest present. Nearly three quarters of the non-compliant shipments transported miscellaneous cargo. This is not a surprise: all of these characteristics are in keeping with past experience.

Meanwhile, APHIS Deputy Director El-Lissy said APHIS was working with importers, exporting countries’ departments of agriculture, and others to improve compliance. Apparently there were two high-profile incidents when shipments of car components were rejected because of ISPM#15 issues. I am trying to learn more about these incidents.

I recently blogged about the pest risk associated with incoming shipping containers and dunnage.  

3) Asian Gypsy Moths (Tussock moths) Still Infesting Ships

Harriger also said that the period 2019-2020 saw the largest number of ships infested by Asian tussock moth eggs since the program began in 2012.  [I am aware that the Entomological Society is searching for a new name for this group of insects.] On average, 12 of 100 approaching vessels was infested. CBP is using sophisticated models to identify regions within Asian ports where conditions exacerbate the risk of moth contamination. CBP can match individual ships’ loading records to this information to pinpoint which are most likely to be infested.

Oregon and Washington continue to find both Asian and European tussock moths in traps along the Columbia River. Such detections prompt eradication programs of varying expense and disruption.

[In April, I blogged about a report evaluating the risk posed by several Asian tussock moths; the report was prepared by experts under the auspices of the North American Plant Protection Organization.]

B. In addition to the arrival of new pests, there is an alarming spread of established ones:

1) Beech leaf disease

State phytosanitary officials reported detections of beech leaf disease (BLD) in Maine and Virginia. The devastating impact of BLD on this hard mast tree species is described here. BLD has now spread through much of southern New England (Connecticut, Rhode Island, Massachusetts) and up the coast to Maine. Connecticut reports that trees of all sizes are affected. Maine reports that the disease is widespread in the central coastal region.

beech trees in Prince William Forest Park

Virginia reported that the disease has been detected in Prince William Forest Park, a forested area south of Washington, D.C., managed by the National Park Service. This detection is too recent to say how widespread it is.

2) Laurel wilt

Kentucky’s plant health officer reported that laurel wilt disease has been detected on sassafras trees in Louisville, at the northern tip of the state and across the river from Ohio. He noted that a second host plant, spice bush, is in the nursery trade. While laurel wilt is not regulated, officials are concerned about its impact in natural forests. Neighboring states are concerned.

sassafras in northern Virginia; photo by F.T. Campbell

I learned by looking at the map that laurel wilt has also been detected in Sullivan County, Tennessee, on the Virginia border.

3) Spotted Lanternfly

This pest of grapes, tree fruits, and a wide variety of native trees is spreading in Pennsylvania, Delaware, New Jersey, and Maryland. It has also been found in Ithaca, NY, and in Connecticut. The populations in Virginia and West Virginia also continue to spread; a disjunct outbreak has been detected in Prince William County, VA. (south of D.C.). Most alarming are disjunct populations in Ohio on the West Virginia border and in Indiana on the Ohio River border with northern Kentucky. See map here.

The Indiana population has been present for several years. The affected woodland is close to RV parks and other facilities that make further spread likely.

California has established an external quarantine targetting the spotted lanternfly .

C. Wrestling with Continuing Issues:

1) States try to compensate for APHIS’ end of regulating the emerald ash borer and firewood

The members of the NPB have spent years discussing the pros and cons of continuing to regulate ash wood to contain the emerald ash borer (EAB). As I blogged earlier, APHIS has ended its regulatory program. One state – Minnesota – is seeking to use an APHIS procedure to get APHIS’ continued protection from importation of EAB-infested wood (presumably from Canada). Under the Federally Recognized State Managed Phytosanitary Program (FRSMP), a state petitions APHIS to recognize its program for a specific pest. If APHIS grants that recognition, the agency will support the state by continuing to regulate imports of that pest or commodities that might transport the pest when they are destined for the regulating state.

The states have also tried to formulate a system to maintain regulation of firewood (nearly all states’ firewood regulations were based on the federal regulation of all hardwoods to prevent transport of the EAB). As part of this process, the NPB developed guidelines for adoption of regulations by the individual states (available here).  The NPB members are just beginning to explore whether  states might set up third-party certification system(s). Among the challenges to any harmonization are states’ differing legal authorities and disagreement on what threat levels should be applied, and for how long.

2) New information about the Asian longhorned beetle in South Carolina

ALB in South Carolina; photo by R. Brad Thompson, APHIS

South Carolina authorities reported that dendrological studies indicated Asian longhorned beetle (ALB) had been present near Charleston, S.C. since 2012, and possibly earlier. The population has the same genetic makeup as the outbreak in Ohio. This might be explained by either transport of infested wood from Clermont County, Ohio, or that wood packaging entering Charleston harbor came from the same part of China. (Charleston is an important port.) In South Carolina, ALB attacks primarily red maple – as is true at the other infestation sites. However, maple densities are much lower in the swamps of South Carolina and scientists don’t know whether the ALB will fly farther or intensify attacks on other host species. Other questions raised by differences between South Carolina and other, more northern, outbreak sites include possible changes in the beetle’s life cycle and flight periods.

Authorities noted the extremely difficult conditions, which impede survey and control efforts – which I described in an earlier blog.

One innovation was sharing of resources: staff from the North Carolina and Tennessee departments of agriculture went to South Carolina to help with surveys. The Resource Sharing Initiative was started a few years ago as a collaborative effort of APHIS and the NPB. This was the first time states tried it. There were several issues that had to be worked out. One issue was the long time it takes to train people to recognize ALB symptoms. All three states’ officials said the project was worthwhile.

black walnut in Fairfax County, VA — in an area where thousand cankers disease has been present for more than a decade; photo by FT Campbell

3) Recinding quarantines of thousand cankers disease of walnut

States which adopted quarantines targetting this insect/pathogen complex a decade ago now think that it poses little risk to black walnut (Juglans nigra) growing in its native range (as distinct from trees planted in the West). Several are in the process of rescinding their quarantines. I think these states have considered the science carefully and are taking the appropriate action.

4) Nursery self-certification – System Set Up; Will Nurseries Participate? Will Customers Support the Process?

Craig Regelbrugge of AmericanHort noted that the SANC program has now been officially launched – it has graduated from being a pilot program. [SANC stands for Systems Approach to Nursery Certification] Participants are exploring incentives to recruit wider participation by nurseries that produce plants and how to get support from plant retailers. SANC is conceived as an elite program for the best nurseries and marketplace leaders. It was never intended to be a remedial program to clean up problem issues such as the P. ramorum debacle. To work, it seems to me, SANC will need to find a way to persuade customers to want to pay more for quality plants. Hence the critical importance of getting retailers involved.

Posted by Faith Campbell

We welcome comments that supplement or correct factual information, suggest new approaches, or promote thoughtful consideration. We post comments that disagree with us — but not those we judge to be not civil or inflammatory.

For a detailed discussion of the policies and practices that have allowed these pests to enter and spread – and that do not promote effective restoration strategies – review the Fading Forests report at http://treeimprovement.utk.edu/FadingForests.htm