West Coast Responding to EAB

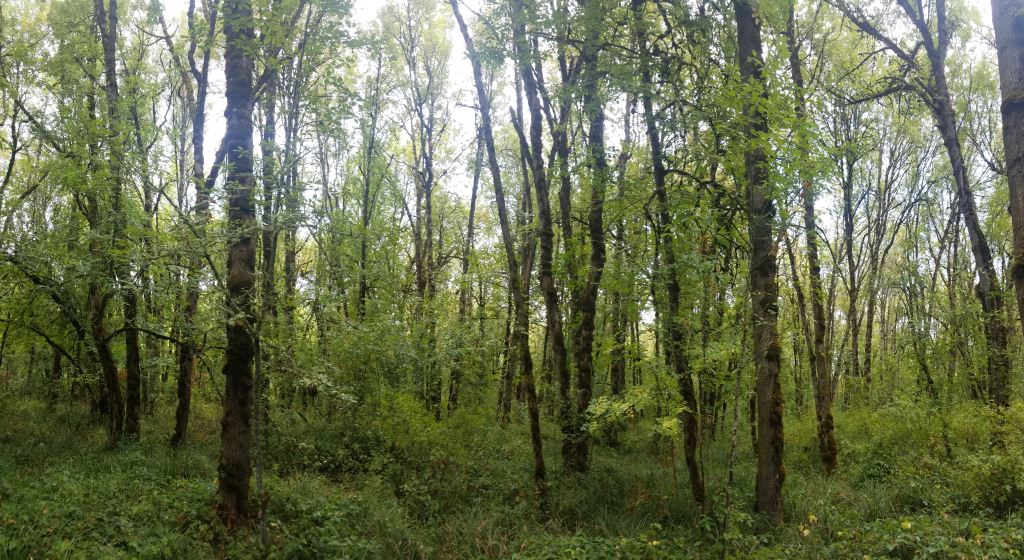
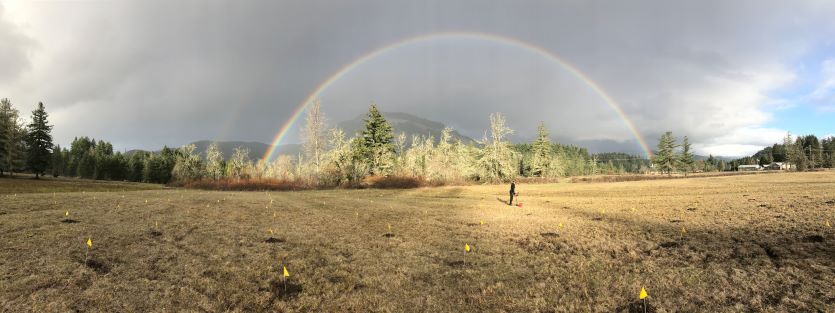
nearly pure stand of Oregon ash in Ankeny National Wildlife Refuge, Oregon; photo by Wyatt Williams, Oregon Department of Forestry

While Michiganders document the impacts of the emerald ash borer (EAB) there, conservationists on the West Coast are jump-starting efforts to save their regional species, Oregon ash (Fraxinus latifolia). Earlier field tests in the Midwest showed that EAB will attack Oregon ash (press release) – something West Coast state would like to counter as early and effectively as possible.

Oregon ash is a wide-ranging species, occurring from California to Washington and possibly into British Columbia. The species has not been studied extensively (it is not a timber species!), but it is clearly an imponearlrtant component of riparian forests. In wetter parts of the Willamette Valley, ash is the predominant tree species. See the photo of the riparian forest in the Ankeny National Wildlife Refuge; this forest is nearly 100% Oregon ash (ODA/ODF EAB Response Plan).

As is true in the Midwest, ash provides important food and habitat resources along creeks and rivers where seasonally high water-tables can exclude nearly all other tree species. Standing and fallen dead ash biomass can alter soil chemistry and affect rates of decomposition, nutrient, and water cycling, i.e., nutrient resource availability for the remaining trees. Gaps in tree canopy can increase soil erosion, stormwater runoff and elevated stream temperatures. In dense stands of Oregon ash, understory vegetation is often sparse, consisting primarily of sedges. The authors of the Response Plan anticipate invasion by non-native plants into canopy gaps caused by the loss of ash trees as a result of an EAB invasion. In Michigan, though, it is the sedges that dominate these gaps.

The Oregon Department of Forestry, the state Department of Agriculture, and other entities have actively participated in “don’t move firewood” campaigns for at least a decade. The Departments of Forestry and Agriculture also led a team that prepared the EAB Response Plan in 2018 (full citation at the end of this blog). It lays out in considerable detail the roles of both government agencies and non-governmental stakeholders. Oregon’s quarantine is broad, covering all insects not on an approved list (Williams, pers. comm.)
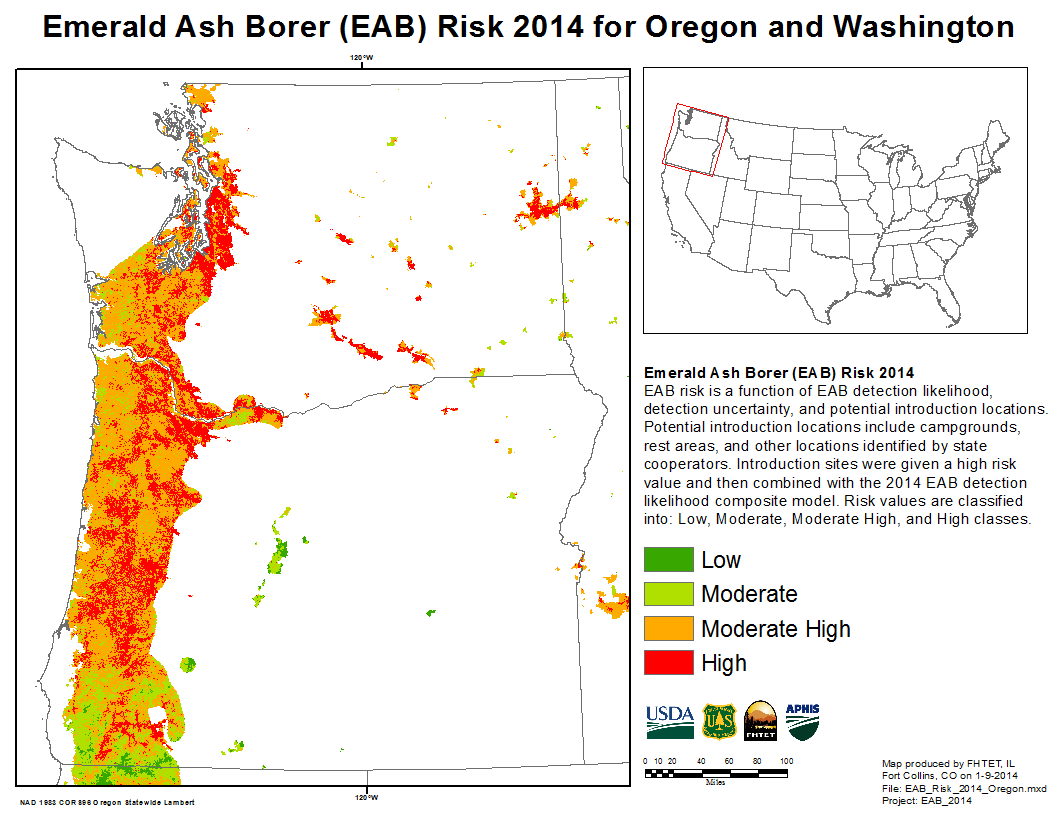
California has inspected incoming firewood for years. In April 2021 – after APHIS terminated the federal quarantine on EAB — California Department of Food and Agriculture established a state quarantine on the beetle and articles that could transport it into the state. In doing so, CDFA noted that commercially grown olive trees might also be at risk to EAB.

Washington State operates a statewide trapping program for invasive insects. There has also been significant attention to non-native insect threats to urban forests. These have included a study in 2016 led by the Washington Invasive Species Council (WISC). It involved a partnership of WISC with the Washington Department of Natural Resources Urban and Community Forestry Program as well as and statewide stakeholder meetings [Bush, pers. comm.].

Of these various state-wide initiatives, the institutions in Oregon appear to be most pro-active. The Tualatin Soil and Water Conservation District provided $10,000 to fund some of the genetics work and testing for EAB resistance. Other funding came from the USDA Forest Service Forest Health Protection unit of State and Private Forestry (not from USFS’ Research Program). As described by USFS geneticist Richard Sneizko in an article in the publication TreeLine (full citation at end of blog), participants hope to find at least some level of genetic resistance to EAB. Any such resistance might be deployed in several ways: 1) promoting reproduction by resistant trees to enhance their numbers before EAB gets to Oregon; 2) using seeds from resistant trees for restoration of natural areas; or 3) cross-breeding resistant trees to build genetically diverse stocks of resistant trees for future restoration.

Participants think it is vitally important to work from seeds collected over much of the range of Oregon ash – first, to search for probably very rare resistant trees; and second, to preserve the full diversity of the tree species’ genome so that restored ash will be adapted to the wide variety of conditions in which ash grow.

Participants in this effort include the forest genetics/tree improvement community – specifically, the USDA Forest Service Dorena Genetic Resource Center (located in Cottage Grove, Oregon) and Washington State University at Puyallup Research & Extension Center. Also engaged is the public gardens community, specifically the Huntington Botanical Gardens in San Marino, Los Angeles County.  The garden is collecting seed of Oregon and other western ashes from California and Washington State.

The first step in assessing resistance is collecting seed from ash trees across the range of Oregon ash. This began in 2019. Carried out by, inter alia, some USFS and Interior’s Bureau of Land Management units, Oregon State University, citizen scientists [Sniezko] and the Oregon Department of Forestry [press release & Sniezko pers. comm.] Also, some seeds were collected in Washington State in 2020. Additional collections in Oregon are scheduled for 2022.

The collected seeds have been evaluated for vitality and stored by the USFS Dorena Center and at the USFS National Seed Lab (Macon, GA).
Oregon ash planting at Dorena; photo by Emily Boes

The USFS Dorena Center and Washington State University have begun germinating and growing some of the seedlings for various tests of possible resistance. There is concern that the 2021 drought might have killed some of the seedlings in Oregon; those in Washington are not affected. The initial seedlings are mostly from Oregon but there is space to add additional families from a wider geographical area. Experimenters plan to collect data annually on bud break, yearly growth, and any diseases or pests that develop on the trees. (Chastagner pers. comm.)

The next step is systematic testing whether some of the ash show genetic resistance to EAB. Richard Sneizko has sent seedlings of 17 ash families to USFS colleague Dr. Jennifer Koch. She operates a breeding facility in northern Ohio where they can be tested for resistance. Testing is expected to begin this year. [Tree Line]

The Dorena Center is also helping a researcher at Penn State University, Dr. Jill Hamilton, to set up a landscape genomics project. She will evaluate the genetic variability in the species by using leaf samples from about 20 trees from many populations across the Oregon ash’s range (California to British Columbia).  This potentially includes a collection from the Dorena population of ash in late Spring 2022. [Sniezko]

These various ash plantings can also be “sentinel” plantings to assist in early detection of newly arriving EAB. [Tree Line]

SOURCES

Bush J. Executive Coordinator | Washington Invasive Species Council

ODF and ODA Emerald Ash Borer Readiness and Response Plan. 2018. 

ODF press release Feb 24, 2022

Treeline Newsletter May 13, 2021. Richard Sniezko. Is There a Future for Oregon Ash? Forest Genetics to the Rescue? Genetic & Emerald Ash Borer Resistance Projects https://www.nnrg.org/wp-content/uploads/2022/02/Treeline_newsletter-June-2021.pdf

The newsletter is issued by Bonneville Environmental Foundation for a consortium of conservation agencies

Sniezko pers comm Feb 2022  22-2/24

A video explaining the campaign to save Oregon ash is at https://youtu.be/uZmfLrxEA7g or https://youtu.be/S8y-XK285S8

Posted by Faith Campbell

We welcome comments that supplement or correct factual information, suggest new approaches, or promote thoughtful consideration. We post comments that disagree with us — but not those we judge to be not civil or inflammatory.

For a detailed discussion of the policies and practices that have allowed these pests to enter and spread – and that do not promote effective restoration strategies – review the Fading Forests report at http://treeimprovement.utk.edu/FadingForests.htm
In Michigan: Devastating News for Black Ash; Merely Bad News for Green Ash

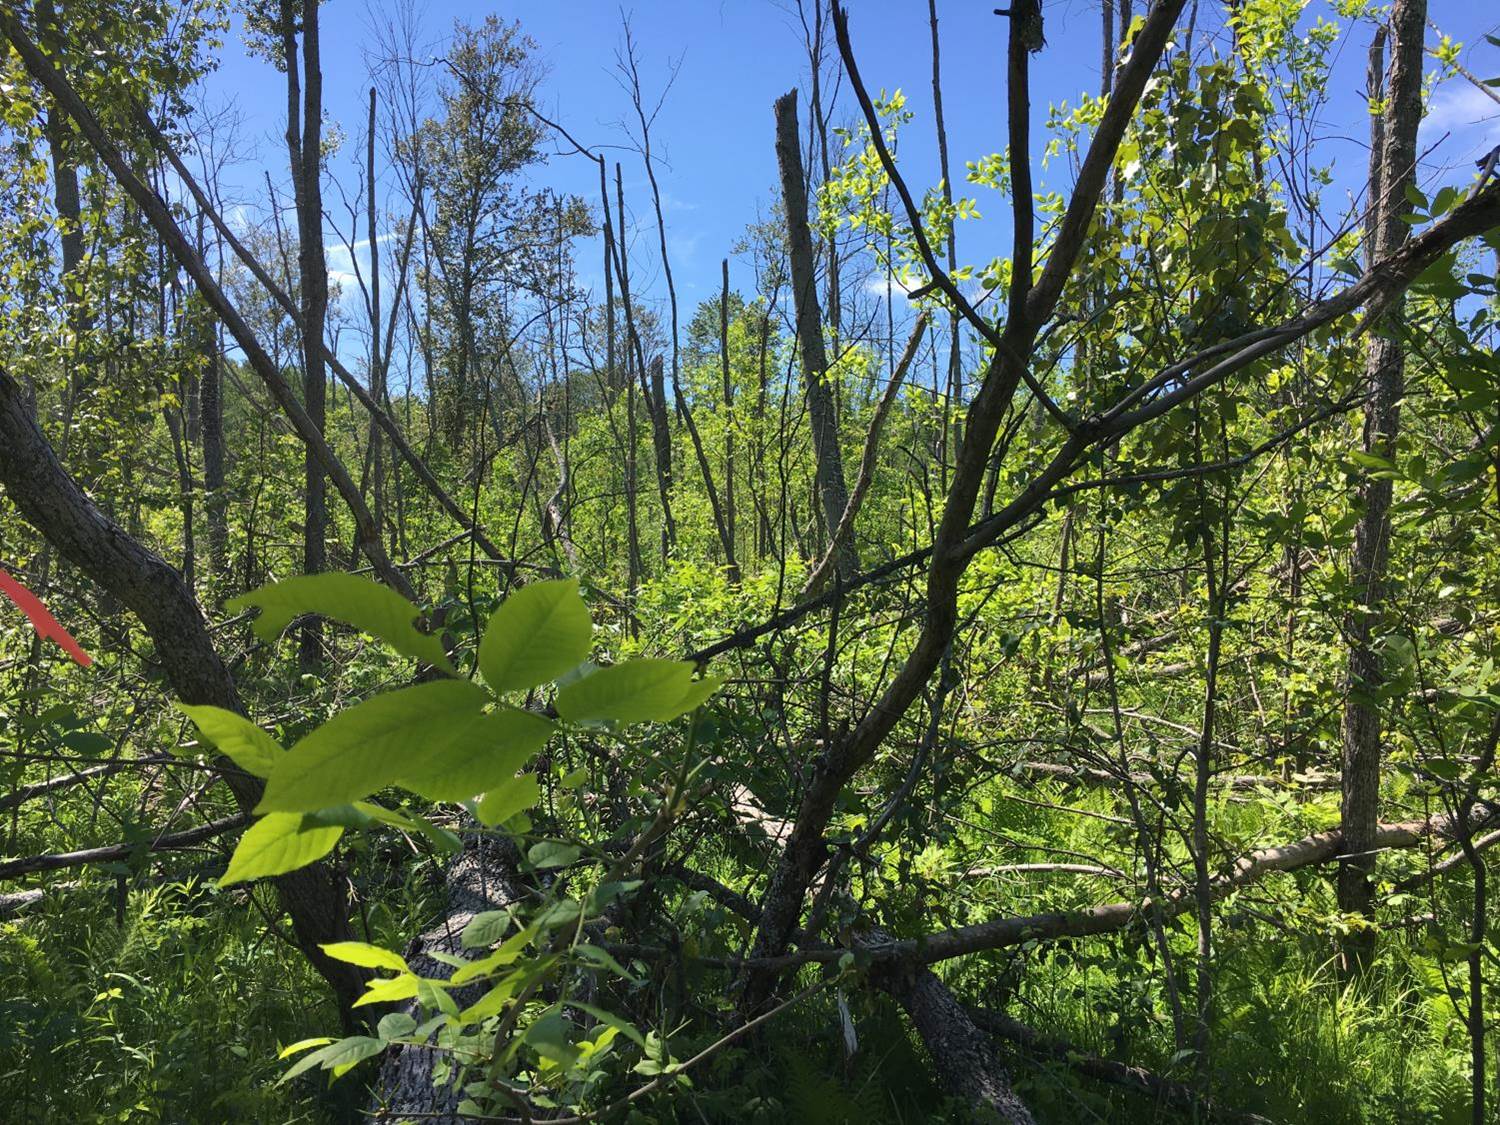
results of EAB infestation; photo by Nate Siegert, USFS

A series of studies by Patrick J. Engelken, M. Eric Benbow, Deborah G. McCullough, Nate Siegert, Randall Kolka, Melissa Youngquist and others examine the status of ash (Fraxinus spp.) in the aftermath of the emerald ash borer (EAB) invasion. Initial studies documented the crash of biomass supporting EAB numbers when the large ash trees died (Siegert, Engelken, McCullough. 2021; full citation at end of blog.) More recent studies have focused on bogs and forests in the riparian areas where ash were especially numerous and arguably ecologically most important. I posted a blog about black ash bogs earlier.

I will focus here on the studies in riparian areas of southern and northwest Michigan. Information about impacts in forests of southern Michigan are from Engelken, Benbow and McCullough (2020); information about impacts in northwest Michigan are from Engelken and McCullough (2020). Full citations for both are at the end of the blog.

All study areas had high ash densities before EAB’s arrival. One study (Engelken and McCullough 2020) found ash densities high in the immediate riparian areas (in one case, a strip reaching 100 meters from the streambank) but scattered in surrounding forests.

In all these study areas, populations of mature (reproductive age) ash crashed within 10-15 years after EAB invasion:

  • In northeast Michigan, EAB carrying capacity was reduced by 94% – 99%; total ash basal area was reduced by 87 – 97.7% (Siegert, Engelken, McCullough. 2021);
  • In southern Michigan, more than 85% of the basal area of green (F. pennsylvanica) and black ash (F. nigra) had been killed by 2020. An estimated 96% of the overstory ash phloem area had died, thus radically reducing EAB carrying capacity (Engelken, Benbow and McCullough 2020);
  • In northwest Michigan, more than 95% of the overstory ash have been killed. (Engelken and McCullough 2020).

The worst impact has been on black ash– which plays such an important ecological role in riparian areas and wetlands and has enormous importance in Native American cultures. In all these study areas, there is no stump sprouting by black ash (Siegert, Engelken, McCullough. 2021; Engelken, Benbow and McCullough 2020; Engelken and McCullough 2020). In three watersheds of northwest Michigan where black ash constituted up to a quarter of the overstory species before the EAB invasion, scientists found no black ash recruits, only eight saplings, and a single seedling.

Green ash (F. pennsylvanica) has survived in much higher numbers – so far. However, this species’ ability to grow into reproductive size is still uncertain. In northwest Michigan, green ash saplings are abundant in canopy gaps created by EAB-caused mortality of mature ash. These saplings had established before the EAB invasion so some call them the “orphaned cohort”.  However, there are few seedlings of any woody plant species in these gaps because sedges form such dense mats.

Green ash reproduction faces many challenges before persistence of the species can be considered assured.  First, populations of EAB – now reduced by the lack of mature ash to support them – might resurge when young ash grow to larger sizes. It is not yet clear the extent to which introduced biocontrol agents and native predators, e.g., woodpeckers, will protect these trees as they grow to reproductive size. Here, again, green ash has an advantage over black ash. While green ash produce seed at a relatively young age, black ash don’t produce seed until they reach 30–40 years. Even then, they produce seeds only sporadically, with intervals of five or more years.

A second challenge is the lack of seed sources – at least until and unless young trees are able to reach reproductive size.

A third challenge is competition for resources from other plants. The canopy gaps eliminate competition for light for the taller plants, i.e., the existing ash saplings. However, the sapling cohort is not supported by a seedling cohort. There are very few seedlings of all woody plant species (including invasive species!). Seed germination is suppressed by the dense mats of wetland-adapted sedges and possibly the higher water tables (which resulted from reduced evapotranspiration following mortality of the mature trees).

Competition for resources is also a factor in the forests outside the immediate riparian zone. There, ash seedlings sprout, but shade created by lateral ingrowth suppresses their growth. In southern Michigan, Engelken, Benbow and McCullough (2020) note that the forests are apparently transitioning from red oak dominated forests to red maple and black cherry dominated forests. This transition is apparently intensified by forest mesophication resulting from reduced fire frequency, decreasing light availability in forest understories and increasing soil moisture content.

Fourth, while stump sprouting of green ash was noted in southern Michigan, in the northwestern forests all the sprouts died. I have already noted the absence of stump sprouting by black ash at all sites.

Beaver & Green Ash in Northern Virginia

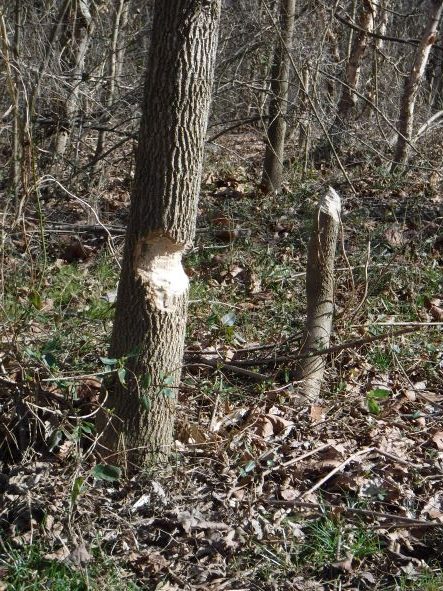
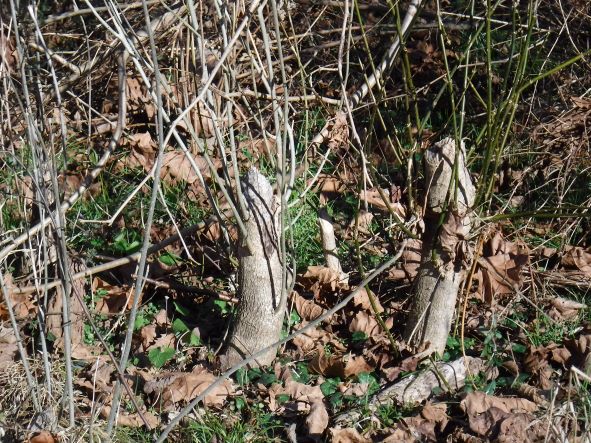
photos of beaver feeding on ash saplings in northern Virginia; photos by F.T. Campbell

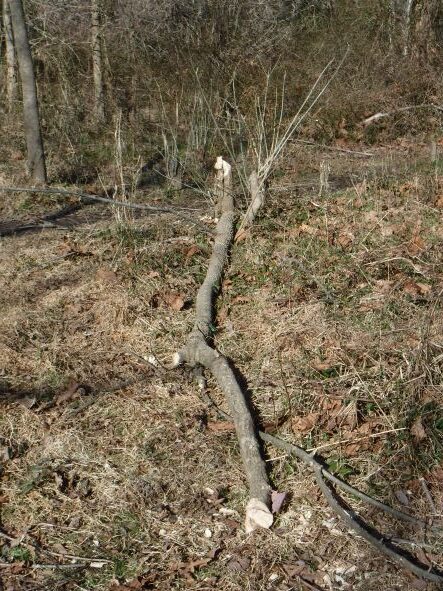
In spring 2022 I noticed along one stream in northern Virginia that beavers had cut down green ash saplings; McCullough and Siegert report that this does not appear to be a problem in their study areas.

By December 2022, the beaver-cut trees tried to recover: see the sprouts from a stump [below]. (I think deer or rabbits ate the tips of the sprouts.)

The beavers also continued feeding on the ash — the tree photographed in the spring when it was half-chewed through has now been felled and its branches removed [see below].

Ecosystem Impacts, Especially on Streams

Across much of the upper Midwest, massive ash mortality is causing widespread changes in forest systems.

Riparian forests, i.e., areas adjacent to waterways where periodic inundation occurs, are functionally linked to the aquatic systems. Loss of such a significant proportion of the overstory changes the transfer of energy to adjacent waterways that takes the form of inputs of nutrients from leaf litter and coarse woody debris. Intact forests also stabilize stream banks and maintain channel depth by preventing erosion. Forests moderate temperature of the water. Finally, forests with “coarse woody debris” increase habitat structure. These impacts might be especially important along first order streams, (defined as perennial streams that have no permanently flowing tributaries). These streams are too small to buffer the impacts of major tree loss. The scientists say they are uncertain whether these changes continue to affect larger streams downstream.

Unshaded streams have higher water temperatures that can affect populations of fish, in particular salmonids, by delaying migration, reducing egg viability and increasing egg mortality. Higher temperatures can also alter primary productivity of aquatic algae, potentially increasing eutrophication (Engelken and McCullough 2020).

The scientists expect increasing abundance of coarse woody debris in the forests and streams of northwest Michigan as the 75% of dead ash that are still standing fall. Such debris provides nutrients and habitat for an array of plants and animals, thereby influencing the abundance, activity and species compositions of several ground dwelling insects and seedling establishment. In streams, coarse woody debris provides complex habitat and refuges. It also retains organic matter. Recreationists do find that debris impedes boating.

Loss of ash specifically 

As described by Engelken, Benbow and McCullough (2020), and in my earlier blog, ash leaf litter – particularly black ash leaf litter – is highly nutritious. Ash leaf litter has efficient turnover rates and contributes important soil nutrients such as nitrogen, organic carbon and exchangeable cations. Invertebrate communities in headwater streams feed largely on coarse organic material such as leaf litter (Engelken and McCullough 2020). Consequently, loss of the annual influx of ash leaf litter will likely have adverse effects on nutrient availability in riparian forests and adjacent streams.

SOURCES

Engelken, P.J., M.E. Benbow, D.G. McCullough. 2020. Legacy effects of emerald ash borer on riparian forest vegetation and structure.  Forest Ecology and Management 457 (2020) 117684

Engelken, P.J. and D.G. McCullough. 2020. Riparian Forest Conditions Along Three Northern Michigan Rivers Following Emerald Ash Borer Invasion. Canadian Journal of Forest Research.

Siegert, N.W., P.J. Engelken, D.G. McCullough. 2021 Changes in demography and carrying capacity of green ash and black ash ten years after emerald ash borer invasion of two ash-dominant forests. Forest Ecology and Management Vol 494, August 2021

Posted by Faith Campbell

We welcome comments that supplement or correct factual information, suggest new approaches, or promote thoughtful consideration. We post comments that disagree with us — but not those we judge to be not civil or inflammatory.

For a detailed discussion of the policies and practices that have allowed these pests to enter and spread – and that do not promote effective restoration strategies – review the Fading Forests report at http://treeimprovement.utk.edu/FadingForests.htm
What Do Invasive Species Cost?

brown tree snake Boiga irregularis; via Wikimedia; one of the species on which the most money is spent on preventive efforts

In recent years a group of scientists have attempted to determine how much invasive species are costing worldwide. See Daigne et al. 2020 here.

Some of these scientists have now gone further in evaluating these data. Cuthbert et al. (2022) [full citation at end of blog] see management of steadily increasing numbers of invasive, alien species as a major societal challenge for the 21st Century. They undertook their study of invasive species-related costs and expenditures because rising numbers and impacts of bioinvasions are placing growing pressure on the management of ecological and economic systems and they expect this burden to continue to rise (citing Seebens et al., 2021; full citation at end of blog).

They relied on a database of economic costs (InvaCost; see “methods” section of Cuthbert et al.) It is the best there is but Cuthbert et al. note several gaps:

  • Only 83 countries reported management costs; of those, only 24 reported costs specifically associated with pre-invasion (prevention) efforts.
  • Data comparing regional costs do not incorporate consideration of varying purchasing power of the reporting countries’ currencies.  
  • Data available are patchy so global management costs are probably substantially underestimated. For example, forest insects and pathogens account for less than 1% of the records in the InvaCost database, but constitute 25% of total annual costs ($43.4 billion) (Williams et al., in prep.) .

Still, their findings fit widespread expectations.  

These data point to a total cost associated with invasive species – including both realized damage and management costs – of about $1.5 trillion since 1960.  North America and Oceania spent by far the greatest amount of all global money countering bioinvasions. North America spent 54% of the total expenditure of $95.3 billion; Oceania spent 30%. The remaining regions each spent less than $5 billion.

Cuthbert et al. set out to compare management expenditures to losses/damage; to compare management expenditures pre-invasion (prevention) to post-invasion (control); and to determine potential savings if management had been more timely.

Economic Data Show Global Efforts Could Be – But Aren’t — Cost-Effective

The authors conclude that countries are making insufficient investments in invasive species management — particularly preventive management. This failure is demonstrated by the fact thatreported management expenditures ($95.3 billion) are only 8% of total damage costs from invasions ($1.13 trillion). While both cost or losses and management expenditures have risen over time, even in recent decades, losses were more than ten times larger than reported management expenditures. This discrepancy was true across all regions except the Antarctic-Subantarctic. The discrepancy was especially noteworthy in Asia, where damages were 77-times higher than management expenditures.

Furthermore, only a tiny fraction of overall management spending goes to prevention. Of the $95.3 billion in total spending on management, only $2.8 billion – less than 3%  – has been spent on pre-invasion management. Again, this pattern is true for all geographic regions except the Antarctic-Subantarctic. The divergence is greatest in Africa, where post-introduction control is funded at more than 1400 times preventive efforts. It is also significant for Asia and South America.

Even in North America – where preventative actions were most generously funded – post-introduction management is funded at 16 times that of prevention.

Cuthbert et al. worry particularly about the low level of funding for prevention in the Global South. They note that these conservation managers operate under severe budgetary constraints. At least some of the bioinvasion-caused losses suffered by resources under their stewardship could have been avoided if the invaders’ introduction and establishment had been successfully prevented.

While in the body of the article Cuthbert et al. seem uncertain about why funding for preventive actions is so low, in their conclusions they offer a convincing (to me) explanation. They note that people are intrinsically inclined to react when impact becomes apparent. It is therefore difficult to motivate proactive investment when impacts are seemingly absent in the short-term, incurred by other sectors, or in different regions, and when other demands on limited funds may seem more pressing. Plus efficient proactive management will prevent any impact, paradoxically undermining evidence of the value of this action!

Aedes aegypti mosquito; one of the species on which the most money is spent for post-introduction control; photo by James Gathany; via Flickr

Delay Costs Money

The reports contained in the InvaCost database indicate that management is delayed an average of 11 years after damage was first been reported. Cuthbert et al. estimate that these delays have caused an additional cost of about $1.2 trillion worldwide. Each $1 of management was estimated to reduce damage by $53.5 in this study. This finding, they argue, supports the value of timely invasive species management.

They point out that the Supplementary Materials contain many examples of bioinvasions that entail large and sustained late-stage expenditures that would have been avoided had management interventions begun earlier.

Although Cuthbert et al. are not as clear as I would wish, they seem to recognize also that stakeholders’ varying perceptions of whether an introduced species is causing a detrimental “impact” might also complicate reporting – not just whether any management action is taken

Cuthbert et al. are encouraged by two recent trends: growing investments in preventative actions and research, and shrinking delays in initiating management. However, these hopeful trends are unequal among the geographic regions.

Which Taxonomic Groups Get the Most Money?

About 42% of management costs ($39.9 billion) were spent on diverse or unspecified taxonomic groups. Of the costs that were taxonomically defined, 58% ($32.1 billion) was spent on invertebrates [see above re: forest pests]; 27% ($14.8 billion) on plants; 12% ($6.7 billion) on vertebrates; and 3% ($1.8 billion) on “other” taxa, i.e. fungi, chromists, and pathogens. For all of these defined taxonomic groups, post-invasion management dominated over pre-invasion management.  

When considering the invaded habitats, 69% of overall management spending was on terrestrial species ($66.1 billion); 7% on semi-aquatic species ($6.7 billion); 2% on aquatic species ($2.0 billion); the remainder was “diverse/unspecified”. For pre-invasion management (prevention programs), terrestrial species were still highest ($840.4 million). However, a relatively large share of investments was allocated to aquatic invaders ($624.2 million).

Considering costs attributed to individual species, the top 10 targetted for preventive efforts were four insects, three mammals, two reptiles, and one alga. Top expenditures for post-invasion investments went to eight insects [including Asian longhorned beetle], one mammal, and one bird.

Asian longhorned beetle

Just two of the costliest species were in both categories: insects red imported fire ant(Solenopsis invicta) and Mediterranean fruitfly (Ceratitis capitate). None of the species with the highest pre-invasion investment was among the top 10 costliest invaders in terms of damages. However, note the lack of data on fungi, chromists, and pathogens. (I wrote about this problem in an earlier blog.)

Discussion and Recommendations

Cuthbert et al. conclude that damage costs and post-invasion spending are probably growing substantially faster than pre-invasion investment. Therefore, they call for a stronger commitment to enhancing biosecurity and for more reliance on regional efforts rather than ones by individual countries. Their examples of opportunities come from Europe.

Drawing parallels to climate action, the authors also call for greater emphasis on during decision-making to act collectively and proactively to solve a growing global and inter-generational problem.

Cuthbert et al. focus many of their recommendations on improving reporting. One point I found particularly interesting: given the uneven and rapidly changing nature of invasive species data, they think it likely that future invasions could involve a new suite of geographic origins, pathways or vectors, taxonomic groups, and habitats. These could require different management approaches than those in use today.

As regards data and reporting, Cuthbert et al. recommend:

1) reducing bias in cost data by increasing funding for reporting of underreported taxa and regions;

2) addressing ambiguities in data by adopting a harmonized framework for reporting expenditures. For example, agriculture and public health officials refer to “pest species” without differentiating introduced from native species. (An earlier blog also discussed the challenge arising from  these fields’ different purposes and cultures.)

3) urging colleagues to try harder to collect and integrate cost information, especially across sectors;

4) urging countries to report separately costs and expenditures associated with different categories, i.e., prevention separately from post-invasion management; damage separately from management efforts; and.

5) creating a formal repository for information about the efficacy of management expenditures.

While the InvaCost database is incomplete (a result of poor accounting by the countries, not lack of effort by the compilers!), analysis of these data points to some obvious ways to improve global efforts to contain bioinvasion. I hope countries will adjust their efforts based on these findings.

SOURCE

Cuthbert, R.N., C. Diagne, E.J. Hudgins, A. Turbelin, D.A. Ahmed, C. Albert, T.W. Bodey, E. Briski, F. Essl, P. J. Haubrock, R.E. Gozlan, N. Kirichenko, M. Kourantidou, A.M. Kramer, F. Courchamp. 2022. Bioinvasion costs reveal insufficient proactive management worldwide. Science of The Total Environment Volume 819, 1 May 2022, 153404

Seebens, H. S. Bacher, T.M. Blackburn, C. Capinha, W. Dawson, S. Dullinger, P. Genovesi, P.E. Hulme, M.van Kleunen, I. Kühn, J.M. Jeschke, B. Lenzner, A.M. Liebhold, Z. Pattison, J. Perg, P. Pyšek, M. Winter, F. Essl. 2021. Projecting the continental accumulation of alien species through to 2050. Glob Change Biol. 2021;27:970-982.

Williams, G.M., M.D. Ginzel, Z. Ma, D.C. Adams, F.T. Campbell, G.M. Lovett, M. Belén Pildain, K.F. Raffa, K.J.K. Gandhi, A. Santini, R.A. Sniezko, M.J. Wingfield, and P. Bonello 2022. The Global Forest Health Crisis: A Public Good Social Dilemma in Need of International Collective Action. submitted

Posted by Faith Campbell

We welcome comments that supplement or correct factual information, suggest new approaches, or promote thoughtful consideration. We post comments that disagree with us — but not those we judge to be not civil or inflammatory.

For a detailed discussion of the policies and practices that have allowed these pests to enter and spread – and that do not promote effective restoration strategies – review the Fading Forests report at http://treeimprovement.utk.edu/FadingForests.htm
Global Loss of Floristic Uniqueness

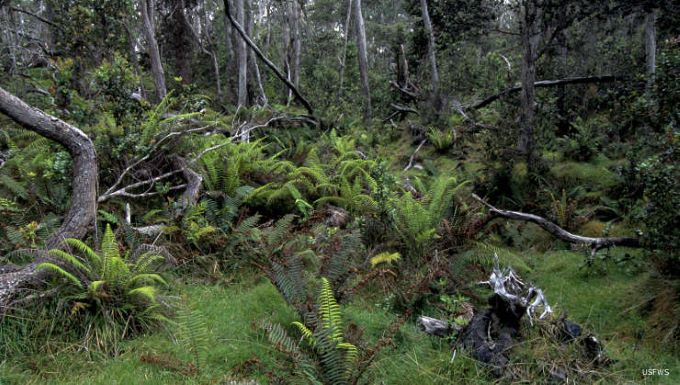
Hakalau Forest, Hawai“i; nearly 90% of Hawaiian flora is unique to the Islands

A recent article by Yang et al. 2021 (full citation at the end of this blog) seeks to determine the extent to which introduced plants reduce the uniqueness of regional floras. They analyzed data from 658 regions covering about 65.7% of the Earth’s ice-free land surface and about 62.3% of the planet’s known plant species.

They found strong homogenization of plant species’ taxonomic and phylogenetic diversity results from introductions of plant species to ecosystems beyond their native range. Homogenization caused by regional extinctions of native floral species occurs much less frequently.

There are two aspects of a region’s floral uniqueness. One is the number of species that it shares with other regions. This is taxonomic uniqueness. The other is the distinctiveness of the evolutionary history of the region. When several species are endemic to a region’s flora, and lack close relatives in other regions, that equals phylogenetic uniqueness.

The effect of a species introduction differs depending on which of these aspects one focuses on. Thus, naturalization of a species closely related to native species (e.g., a congeneric species) will have less impact on the phylogenetic floristic uniqueness of the region than naturalization by a distantly related species. Taxonomic uniqueness, however, will be affected to the same degree, irrespective of the phylogenetic distance between the naturalized and native species.

Yang et al. found strong homogenization of plant diversity. They found that species introductions increased the taxonomic similarity in 90.7% of all regional pairs and phylogenetic similarity in 77.2% of all region pairs. Most homogenization results from introductions of plant species to ecosystems beyond their native range. Homogenization caused by regional extinctions of native floral species occurs much less frequently.

This loss of regional biotic uniqueness or distinctiveness changes biotic interactions and species assemblages. These, in turn, have ecological and evolutionary consequences at larger scales and higher levels.

The degree of homogenization between regions’ floras depends on three factors:

1) The distance between the donor and recipient regions. Since nearby regions share more species, an introduction from a more distant origin is more likely to be a novel species and so contribute to homogenization of “donor” and “receiving” floras.

2) Climatic similarity, especially temperature. A plant species introduced from a climatically similar but geographically distant place is more likely to establish than a species from a different climatic zone. As a result, the recipient area’s flora is changed to more closely resemble the flora of the donor region with which it shares climatic conditions – regardless of the distance between them.

3) The level of exchange of goods and people between two regions. The higher the rate of exchange between two regions, the greater the chance that a species will be introduced and become established. Yang et al. used the existence of current or past administrative relationships (e.g., colonial relationship) between two regions as a proxy for intensity of trade and transport between donor and recipient regions. They found that floras of regions with current or past administrative links have taxonomically become more similar to each other than the floras of regions with no such links.

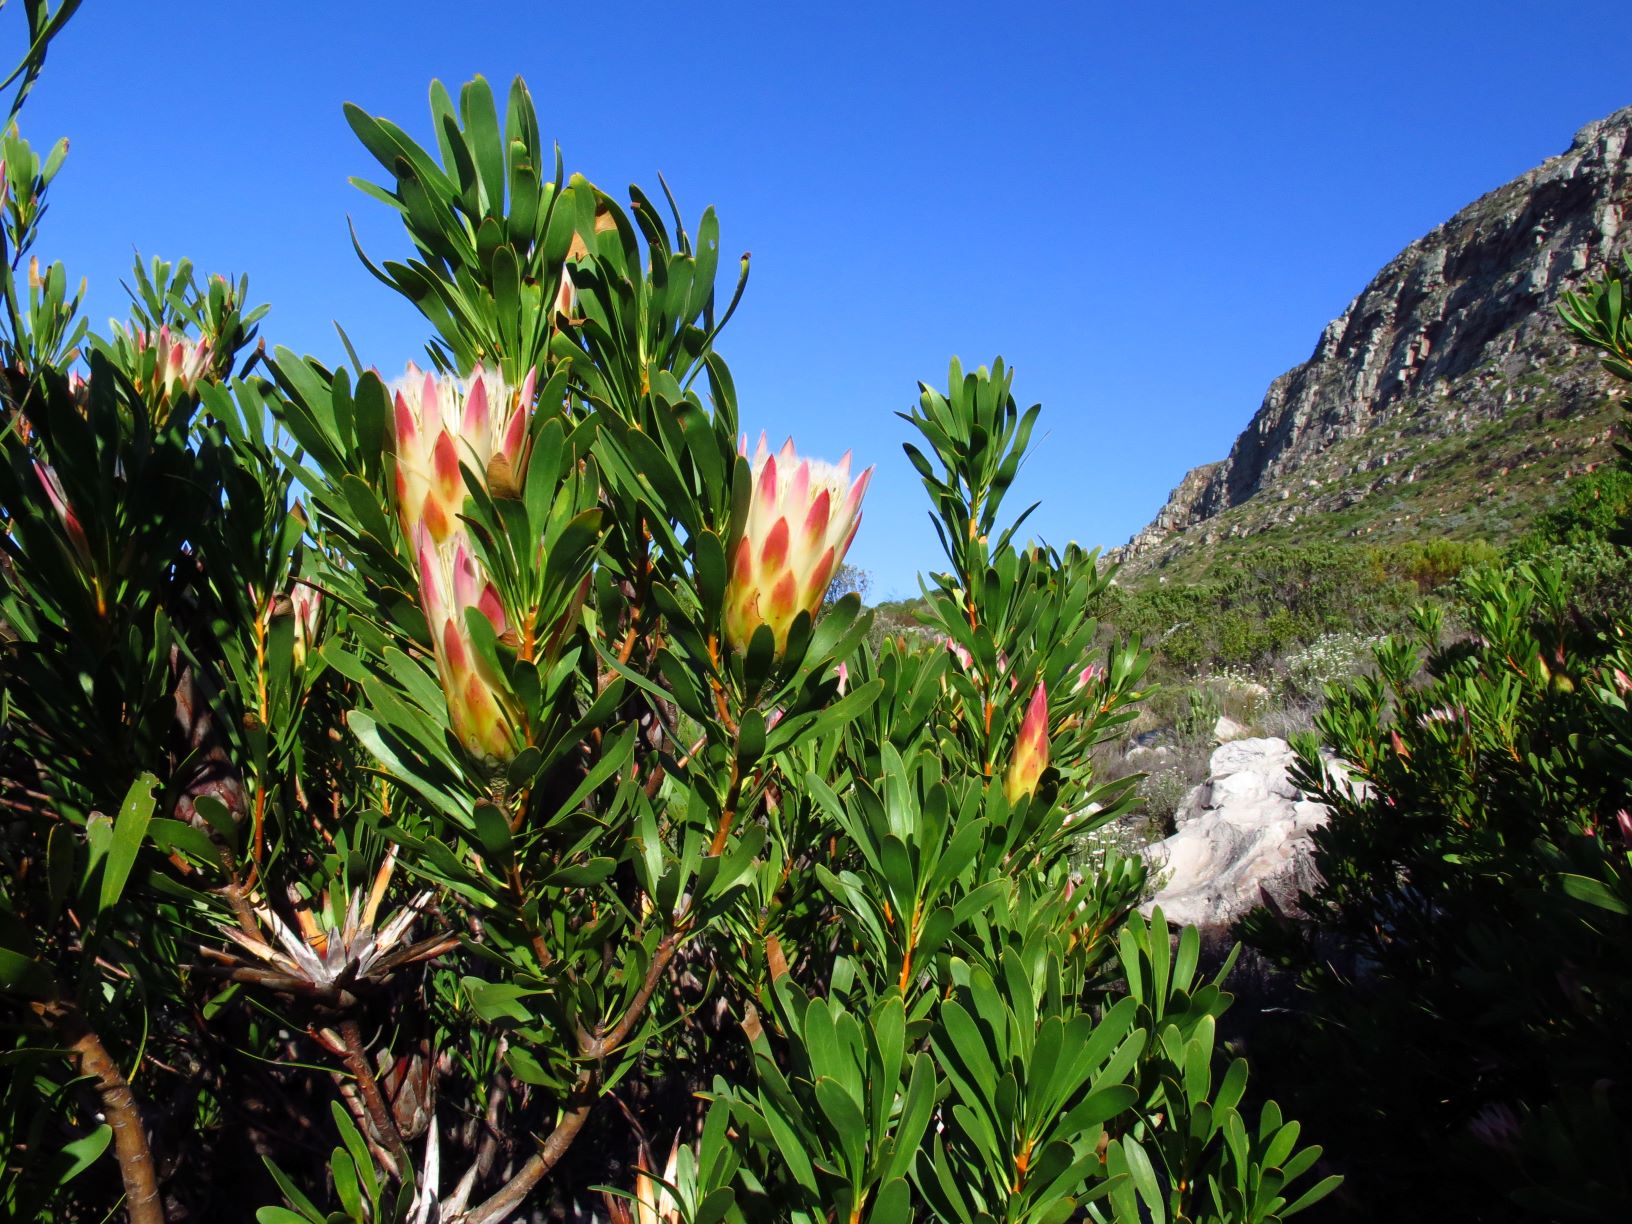
flora of the Cape Floral Kingdom – South Africa; photo from Michael Wingfield

Establishment of introduced species can increase floristic similarity of the donor and recipient regions (= floristic homogenization) when the species is native to one of the two regions and naturalizes in the other, or when it is not native to both regions and naturalizes in both. On the other hand, a species introduction can decrease the floristic similarity of the two regions (i.e., enhance floristic differentiation) when the species is not native to both regions but naturalized in only one.  

Homogenization hotspots differed slightly depending on whether one focused on taxonomic or phylogenetic aspects.

The regions with the greatest average increase in taxonomic similarity with other regions due to naturalized alien species were New Zealand, portions of Australia, and many oceanic islands. The Australasian situation probably reflects its long biogeographic isolation from other parts of the globe and its highly unique native flora. As a result, nearly all non-native plants introduced to Australasia strongly increase levels of its floristic similarity to the rest of the world. Oceanic islands have species-poor floras with large proportions of unique endemics. They have also received high numbers of naturalized alien plants.

Hotspots of phylogenetic homogenization on continents are the same as those for taxonomic homogenization, but this is not true for islands. Yang et al. think this is because islands’ native floras were established by natural colonization from nearby continental floras so – despite subsequent speciation – they retain their phylogenetic relationship to the donor areas’ floras.  

Yang et al. concede that they lacked high-quality data on native and naturalized alien species lists for a third of Earth’s ice-free terrestrial surface, especially Africa, Eastern Europe, and tropical Asia. They believe, however, that data from these regions are unlikely to change the overall finding.  (Scientists are beginning to compile lists of forest pests in Africa). link to blog

Yang et al. note that introduction and naturalization of alien species are likely to increase in the future, thusaccelerating floristic homogenization. The ecological, evolutionary and socioeconomic consequences are largely unknown.They call for stronger biosecurity regulations of trade and transport and other measures to protect native vegetation.

SOURCE

Yang, Q., P. Weigelt, T.S. Fristoe, Z. Zhang, H. Kreft, A. Stein, H. Seebens, W. Dawson, F. Essl, C. König, B. Lenzner, J. Pergl, R. Pouteau, P. Pyšek, M. Winter, A.L. Ebel, N. Fuentes, E.L.H. Giehl, J. Kartesz, P. Krestov, T. Kukk, M. Nishino, A. Kupriyanov, J.L. Villaseñor, J.J. Wieringa, A. Zeddam, E. Zykova  and M. van Kleunen. 2021. The global loss of floristic uniqueness. NATURE COMMUNICATIONS (2021) 12:7290. https://doi.org/10.1038/s41467-021-27603-y

Posted by Faith Campbell

We welcome comments that supplement or correct factual information, suggest new approaches, or promote thoughtful consideration. We post comments that disagree with us — but not those we judge to be not civil or inflammatory.

For a detailed discussion of the policies and practices that have allowed these pests to enter and spread – and that do not promote effective restoration strategies – review the Fading Forests report at http://treeimprovement.utk.edu/FadingForests.htm

Restoring Port-Orford cedar – a role for you!!!!

Port-Orford cedar; photo by Julie Kierstead

I report here on recent developments on breeding resistant trees. These include both promising results from decades-long efforts and also a promising start to addressing a new challenge.

These programs have benefited from major commitments by the USDA Forest Service. I hope they encourage similar commitments for other priority species – such as those named by the CAPTURE program.  

Port-Orford cedar – ready to be planted in the forest!  

Scientists who have been working for decades to breed seedlings of Port-Orford cedar (POC) trees resistant to the root rot caused by Phytophthora lateralis https://www.dontmovefirewood.org/pest_pathogen/port-orford-cedar-root-disease-html/now say that they have seedlings ready for planting in the forest. They made this case in a webinar in late February. It can be viewed here. The full webinar runs somewhat over two hours.

The scientist who led early studies of POC and the root disease, Don Zobel, Professor Emeritus, Oregon State University, described the ecological requirements that should guide planting programs. POC produces high-calcium litter. It grows from the sea coast to 1950 meters elevation, on sand dunes, fens, soils with hardpans; mafic & ultramafic rocks (serptentines) and fertile soils on some sedimentary rocks. POC is less shade tolerant than western hemlock but more fire tolerant. It can form a secondary canopy under Douglas-fir and supercede other conifers when fire occurs repeatedly. The tree needs surface water, e.g., seepages and stream sides; but the water must be flowing, not stagnant. Seedlings are especially vulnerable to drying during winter. 

[I posted a separate blog about other trees native to this region, including serpentine soils, here.]

One purpose of the webinar was to encourage owners and managers of lands within POC’s historic range (see the map under Dr. Zobel’s presentation) to begin planting the species in appropriate sites. With this in mind, Dr. Zobel emphasized criteria for selecting sites:

  • Climates in coastal areas of the range are less likely to change under climate change
  • Quartenary marine terraces are the best geologic type; Lookingglass and Roseburg geologic types are also acceptable
  • Availability of water during summer, e.g., streamside and seepage areas. Try planting beneath alder. However, avoid interior valley stream corridors if the soils are not ultramafic. And avoid stagnant water.
a POC tree in a bog next to the endemic pitcher plant of southern Oregon, Darlingtonia californica; photo by Richard Sniezko

Dr. Zobel also says one should plant pathogen-resistant genotypes and pay attention to local genetic varieties (which have largely been determined).

Dr. Richard Sniezko of the USFS Dorena Genetic Resource Center described the Center’s 30-year effort to find and exploit resistance to the pathogen. Funding has come from the USFS Forest Health Protection program, other parts of the USFS, and the Bureau of Land Management (BLM). The goal all along has been to produce seedlings for restoration to the forest – meaning not just resistant to the pathogen but also adapted to various local conditions.  The program can now provide resistant seedlings in large quantities for planting by landowners and public land managers.

Dr. Sniezko emphasizes that success depends on engagement of four sets of people: research by university scientists; application of that research and development of propagule growing methods by the Dorena Center; support from USFS leaders to continue the program; involvement of land managers who choose to plant the resistant seedlings.

USFS and BLM staff described efforts to determine where POC grows on land under their management, the status of disease in those areas, and efforts to slow the spread of the disease, especially along roadsides and as result of timber or engineering projects. Some of this sanitation work has been funded by USFS Forest Health Protection program — not the National Forest System.

Richard Sniezko stated that the seedlings’ quantitative disease resistance means that some seedlings will die.  He expects 40-50% survival of seedlings from many of the breeding zones. This is well above the level of resistance in un-improved populations.

Both BLM and the Rogue-River-Siskiyou National Forest have planted tens of thousands of resistant seedlings in recent years and plan to continue. Funding provided by COVID-19 legislation might allow increased effort.  [See Dr. Sniezko’s presentation on the webinar for photos from some plantings.] 

POC seedlings at Dorena; photo by Richard Sniezko

Norma Kline of the Oregon State University extension program has distributed more than 10,000 seedlings to small/non-industrial landowners. Many of the recipients shared seedlings with neighbors or are coordinating their planting over a large area. They were motivated primarily by conservation concerns. Her monitoring showed that the POC seedlings survived but did not thrive under dense tanoak canopy. They did well in competition with grass in areas near the coast where there was more moisture. They also did well under Douglasfir as long as there was dappled sunlight.

The non-governmental organization American Forests is likely to participate actively in the planting effort.

In an email to me, Dr. Sniezko asks that people who have planted POC outside its native range inform him where the tree(s) is/are thriving. This information would enhance scientists’ understanding of the species’ environmental tolerances.

Posted by Faith Campbell

We welcome comments that supplement or correct factual information, suggest new approaches, or promote thoughtful consideration. We post comments that disagree with us — but not those we judge to be not civil or inflammatory.

For a detailed discussion of the policies and practices that have allowed these pests to enter and spread – and that do not promote effective restoration strategies – review the Fading Forests report at http://treeimprovement.utk.edu/FadingForests.htm

Rapid ‘Ohi‘a Death – Comprehensive New Program Begins – Challenges to Achieving Success

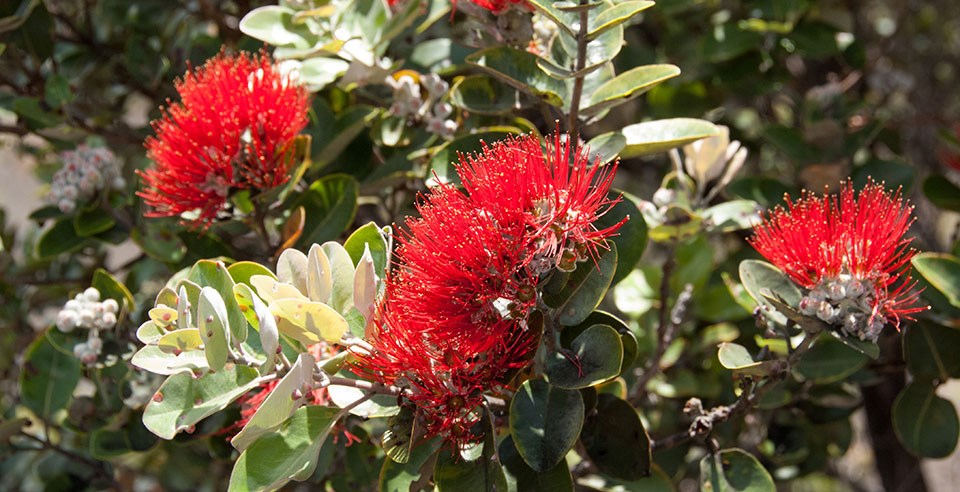
ʻōhiʻa blossoms

‘Ohi‘a (Metrosideros polymorpha) is the most abundant native forest tree in Hawai`i and of enormous ecological, cultural, and economic importance. Five species of endemic Metrosideros are recognized on the Hawaiian islands. Only one — M. polymorpha — is found throughout the state. Eight varieties are recognized. These varieties inhabit different environments and have adapted to selective pressures characteristic of these locations. There are at least five other species in the Metrosideros genus, each endemic to one or a few nearby islands. Blaine et al. (2022) [full citation at end of this blog] provide a helpful summary of the tree’s ecological importance and its apparently on-going speciation.

‘Ohi‘a provides habitat for endemic birds, insects, and plants, many of which are endangered. Thus, conservation of this species — and all Hawaiian Metrosideros – is vital for the conservation of countless other taxa. In addition, high elevation ʻōhiʻa forests protect vitally important watersheds across the state. For Native Hawaiians, ʻōhiʻa is a physical manifestation of multiple Hawaiian deities so is the subject of many proverbs, chants, stories, and a foundation of scared hula. Finally, the tree is beautiful!

Native Hawaiian forests face multiple threats — invasive animals and plants, wildfire, and land-use changes. Due to such threats, natural ʻōhiʻa regeneration is largely absent in most lower-elevation forests. In this case, competition with invasive species and the presence of diseases such as ʻōhiʻa rust (Austropuccinia psidii) are probably the specific causes. Multiple government and non-governmental entities have made substantial effort to mitigate these threats.

ROD-infected ʻōhiʻa; photo by J.B. Friday

The disease Rapid ‘Ohi‘a Death (ROD) is an unprecedented threat to this species and the forests it constitutes. The disease is caused by two newly described fungal pathogens: Ceratocystis lukuohia and C. huliohia. The disease caused by C. lukuohia is more severe. To date it has been detected on the two islands farthest apart in the chain — Hawai`i (the Big Island) and Kaua‘i. C. huliohia causes a canker disease that kills trees more slowly. It is more widespread, found on Maui and O‘ahu in addition to Hawai`i and Kaua‘i. Blaine et al. (2022) and the profile here describe the two diseases’ epidemiologies, progression, impacts, and challenges.

Because of the clear threat to Hawaiian ecosystems, ecosystem services, and cultural assets, considerable effort has put into delimitation and research on possible mitigation actions since ROD was discovered in 2010. The first strategic plan covered the period 2017–2019. It focused on expanded efforts to map outbreaks, research on the epidemiology of the pathogens, and most-promising management practices. The second strategic plan covers 2020–2024. It provides for continued surveillance and improvement of these technologies; expanding outreach and public engagement; research on possible vectors of the pathogens; collection and preservation of seeds for research and future restoration; and comprehensive evaluation and development of disease resistance in ʻōhiʻa.

Soon after the causal agents were clarified, the USDA Agriculture Research Service (ARS) began screening for disease resistance. By 2016, ARS had demonstrated that five individuals from two varieties of M. polymorpha had survived inoculation by the more virulent pathogen, C. lukuohia. Their survival raised hopes that natural resistance might be present in wild populations of at least some varieties. However, more comprehensive screening of trees from throughout the species’ range is needed to provide an accurate baseline on the frequency, level, and distribution of genetic resistance to both pathogens. The goal is to produce material resistant to both pathogens that can be used to preserve the ecology, culture, and biotic communities that are dependent on this tree species.

To carry the expanded effort forward, in 2018 a collaborative partnership of state, federal, and non-profit groups was formed. Participants in the ‘Ohi‘a Disease Resistance Program (‘ODRP) include: the Akaka Foundation for Tropical Forests; USDA’s Forest Service and Agriculture Research Service; the state’s Division of Forestry and Wildlife and Agriculture Research Center; programs of the University of Hawai‘i at Manoa and at Hilo; Purdue and Arizona State universities; the Tropical Hardwood Tree Improvement and Regeneration Center; and Kalehua Seed Conservation Consulting.

Blaine et al. (2022) have now outlined a framework to guide the overall effort to identify and develop ROD resistance in M. polymorpha and, possibly, all Hawaiian Metrosideros species. The framework calls for the following activities:

(1) evaluating and operationalizing methods for inoculation-based screening and greenhouse-based production of test plants; and

(2) short-term greenhouse screenings of seedlings and rooted cuttings sampled from native Metrosideros throughout Hawai’i.

Once these tasks have been achieved, the effort is expected to expand to address:

(3) establishing field trials to validate the short-term greenhouse assays and monitor durability and stability of resistance;

(4) understanding environmental (climate, soils) and genetic (vascular architecture, wound response)

drivers of susceptibility and resistance to characterize the durability and stability of genetic resistance to ROD;

(5) developing remote sensing and molecular methods to rapidly detect ROD-resistant individuals;

(6) if necessary, conducting breeding to increase the efficacy of resistance and improve durability of ROD resistance; and

(7) supporting already established and ongoing Metrosideros conservation, including state-wide seed collection and banking, with information on not only genotypes resistant to ROD but also production of ROD-resistant seed.

Blaine et al. (2022) outline how to proceed on each step, and describe the challenges that must be overcome. Challenges range from building growing and screening capacity to handle the thousands of plants required, to developing the remote sensing tools to identify diseased trees in the forest, to identifying sites for seed orchards. Actions by ‘ODRP will focus on  Stage II screening in the field to examine the durability of resistance under the wide variety of ecological conditions in which ʻōhiʻa grows and in the presence of a potentially evolving pathogen. Resistance studies must expand beyond M. polymorpha varieties from only one island (the Big Island) to include the other Hawaiian Metrosideros taxa.  

Once ROD-resistant M. polymorpha trees are discovered and groundwork has been laid to satisfy initial needs for resistant tree seedlings for forest restoration, scientists can begin research into the genetic basis of ROD resistance. This knowledge will assist breeding efforts which might be necessary if resistance to one of the pathogens does not confer resistance to the other, since the goal is to provide seedlings that are resistant to both.

Blaine et al. (2022) note that the state and others continue efforts to address other aspects of ROD management. These include

1) controlling the spread of the pathogen through local quarantines on movement of infected material and increased public education on bio-sanitation for forest users;

2) testing repellants to reduce beetle attack on infected trees and subsequent frass production.

3) reducing wounding of trees by fencing more pristine forests and removing feral ungulates

SOURCE

Blaine C. Luiz, Christian P. Giardina, Lisa M. Keith, Douglass F. Jacobs, Richard A. Sniezko, Marc A. Hughes, James B. Friday, Philip Cannon, Robert Hauff, Kainana Francisco, Marian M. Chau, Nicklos Dudley, Aileen Yeh, Gregory Asner, Roberta E. Martin, Ryan Perroy, Brian J. Tucker, Ale.alani Evangelista, Veronica Fernandez, Chloe Martins-Keli.iho.omalu, Kirie Santos, Rebekah Ohara. 2022. A framework for establishing a rapid ‘Ohia death resistance program. New Forests. https://doi.org/10.1007/s11056-021-09896-5  

See also the video at https://www.bigislandvideonews.com/2019/06/16/video-to-save-ohia-a-genetic-resistance-program-will-be-built/

Posted by Faith Campbell

We welcome comments that supplement or correct factual information, suggest new approaches, or promote thoughtful consideration. We post comments that disagree with us — but not those we judge to be not civil or inflammatory.

For a detailed discussion of the policies and practices that have allowed these pests to enter and spread – and that do not promote effective restoration strategies – review the Fading Forests report at http://treeimprovement.utk.edu/FadingForests.htm

Interactions of 2 (of 3) Threats to Beech

American beech (Fagus grandifolia) is a widespread and beautiful tree of the eastern deciduous forest. Its range reaches from Nova Scotia to eastern Wisconsin, then south to Mississippi and Louisiana and east to mid-Georgia. It is an important food source for 40 wildlife species, particularly in the northern parts of its range where few other species produce hard mast. (See Lovett et al. 2006.)

Threats

Unfortunately American beech is under threat from three non-native organisms or complexes: 1) beech bark disease, 2) beech leaf disease, and 3) beech leaf mining weevil. A fourth pest, a previously unknown – and still unnamed bark beetle in the genus Agrilus – has been detected in New York City on European beech trees. It is not yet known whether it will attack American beech and, if so, whether it will also cause serious damage (Michael Bohne, USFS, pers. comm.)  

symptoms of beech bark disease; photo by Linda Haugen, USFS; via Bugwood

Beech bark disease (BBD) results from the interaction of the introduced European beech scale insect (Cryptococcus fagisuga) and several fungi in the Neonectria genus – some of which are also introduced. The resulting disease has been killing American beech trees since the beginning of the 20th Century. It has spread from Nova Scotia to much of the tree’s range. It has dramatically altered the composition and structure of stands containing beech.

symptoms of beech leaf disease; photo provided by Jennifer Koch, USFS

Beech leaf disease (BLD) was initially detected in 2012, near Cleveland. As of December, 2021, it has spread due east across New York, Pennsylvania, and New Jersey to the Atlantic, then up the coast through Connecticut and eastern Massachusetts, with a separate outbreak in central Maine. The disease is apparently associated with a nematode, Litylenchus crenatae ssp. mccanni, although additional pathogens, like bacteria, might also play a role. The origin of the North American population of the nematode is unknown; it is a related but separate subspecies from a Japanese nematode (Reed et al. 2022).

American beech defoliated by leaf mining weevil; photo courtesy of Jon Sweeney, CFS

Beech leaf mining weevil (Orchestes fagi) is, so far, limited to Nova Scotia. However, it is expected that the weevil will continue spreading throughout the range of American beech through both natural dispersal and human-assisted movement. Repeated defoliation by the weevil might increases mortality rates in forests that are surviving in the “aftermath” stage of BBD (Sweeney et al. 2020).

A new study (Reed et al. 2022) concludes that, despite being detected only 10 years ago, BLD has already become pervasive in forests surrounding Lake Erie in the U.S. and Ontario. While somewhat more prevalent in U.S. states on the eastern side of the Great Lakes (on 54% of trees) than in Ontario (on 46% of trees), BLD is spreading rapidly and affecting every canopy layer. Mortality is highest in seedlings and saplings; understory saplings die within 2 – 5 years. The occasional mortality of overstory trees occurs within seven years of [observed] infection. Defoliation and mortality of saplings allow more light to pass through to the understory; this is expected to alter plant communities on the forest floor.

Beech scale is more widespread in Ontario (found on 60% of trees) than in the U.S. (38% of trees). This is not surprising since the scale was detected in Ontario in 1960, 24 years before it was detected in portions of Ohio, New York and Pennsylvania included in the study (in 1984). Throughout this region, beech scale is disproportionately affecting overstory trees.

Only 4% of trees throughout the study area are infected with Neonectria cankers. In other words, full-scale beech bark disease is not yet widespread and is spreading surprisingly slowly. Scientists do not understand this phenomenon.

These findings are based on a network of monitoring plots a network of monitoring plots set up in 2019 set up in areas surrounding the Great Lakes. They comprise 34 plots at 17 locations in southwest Ontario and 30 plots at 25 locations in Ohio, Pennsylvania, and New York. In total the plots hold 646 live American beech trees — 412 saplings; 85 in the intermediate/suppressed (subcanopy) category; and 149 in the dominant/codominant (canopy) class.

Forest composition is similar throughout the study area. The most common species in association with American beech are sugar and red maples (Acer spp.), and white and green ash (Fraxinus spp.). Other tree species present include eastern hemlock (Tsuga canadensis), white pine (Pinus strobus), oaks (Quercus spp.), and birches (Betula spp.). Study plots had few invasive plants – although the invasive species present are well-documented to invade forests.

Ontario disease assessment

In Ontario, BLD was identified in 25 of the 34 plots.  It was present on 171 saplings, 53 intermediate trees, and 70 dominant trees. Both prevalence and severity were greatest on intermediate trees. Beech scale was present at all 34 plots. While scales were found on trees of all sizes, they were almost two times more prevalent and were more severe on mature trees than saplings. Neonectria cankers were detected at 34 plots. Neonectria was rare but most severe on dominant trees. Fewer than one third of saplings and one-sixth of mature trees were pest free.

U.S. disease assessment  

BLD was present in 17 of the 30 plots. It was found on 75 saplings, 30 intermediate trees, and 38 dominant trees. Saplings and dominant trees had similar levels of disease; intermediate trees had significantly less. However, BLD severity was twice as high on saplings compared to mature trees. BLD was present on more than half of the seedlings assessed – 46 out of 82. Beech scale was present in 20 of the 30 plots. It was significantly less common and severe on saplings than on mature trees. Neonectria cankers were present in only 4 of 30 plots. Canker prevalence and severity did not differ significantly among size classes.

Distribution and Effects of Beech Scale and BBD

While beech scale attack facilitates invasion by the Neonectria fungi, the disease – BBD complex – had the most limited distribution of the three pests in this study. It was found on only ~4% of beech trees throughout the study area. The disease was first reported there in the early 2000s. Although no one knows why, it has spread more slowly there than in areas to the east (Reed et al. 2022).

As is the case with beech scale, BBD disproportionately affects large diameter trees. Typically, BBD kills more than half of mature beech within 10 years of its arrival. Dying trees produce prolific root sprouts resulting in dense beech sapling understories that impede regeneration of less shade-tolerant tree species. The persistence of thickets of disease-vulnerable small beech perpetuates the disease. BBD is the only forest disease in North America that can inadvertently intensify itself by increasing densities of its host while suppressing other species.

Beech Forest Community Change in Response to Combined Impacts of BBD and BLD

It is unclear how forests will change as beech die. Some expect saplings of species already present — red maple, white ash, and, especially sugar maple — to exploit the canopy gaps. Of course, white and green ash are under attack by the emerald ash borer; DMF their ability to reach the canopy will depend on the success of biocontrol agents.

However, if BBD or BLD resistant beech survive or if BLD fails to persist, future forests might instead consist of beech thickets that would prevent all but the most shade tolerant species from establishing. Heavy deer predation on maple seedlings and saplings might also play a role. A third possibility is that morbidity from BBD and BLD might lead to uneven-aged conditions that allow younger trees — perhaps even shade intolerant species e.g., oaks — to establish.

Invasive plants also have the potential to fill gaps left by declining beech. While maple-beech forests often have sparse understories due to low understory light levels, pest-caused canopy gaps are expected to increase the abundance of invaders, especially in small woodlots and forests near urban areas. Several shade-tolerant invasive shrubs are already present in low numbers: Japanese barberry (Berberis thunbergii), tatarian honeysuckle (Lonicera tatarica), multiflora rose (Rosa multiflora), and buckthorn (Frangula sp.). Reed et al. (2022) note that these species, plus privet and autumn olive, can take advantage of small canopy gaps, especially when soils are disturbed, e.g., by active intervention to counteract the loss of beech.

Precautionary Research and Management

Reed et al. (2022) call for enhanced monitoring of beech forests focused on

  • the timing of BLD presence relative to tree age and size – which might affect competitiveness of sprouting beech in the understory; and
  • compositional and structural change in forests with BLD or to which it is likely to spread

They also recommend abandoning the management approach for BBD currently recommended by foresters. It calls for removing scale-susceptible beech so that resistant genotypes increase in prevalence. In forests with both BBD and BLD, they conclude, management of natural regeneration is unlikely to succeed because BLD will kill sprouts and saplings that might be resistant to scale. They recommend instead active management of the forest to promote mast-producing, shade intolerant species, such as oaks and hickories.

They also recommend increased support for resistance-breeding programs. Such programs already target BBD, based on the estimated 1% of American beech that show some resistance. Now those programs need to incorporate BLD resistance. (Reed et al. note that small numbers of beech show few or no BLD symptoms so might possess resistance or tolerance.)

grafted beech for resistance breeding; photo by Rachel Kappler, then USFS (now Great Lakes Basin Initiative & Holden Arboretum)

Unfortunately, the Canadian beech breeding program’s future funding is highly uncertain. To counter this threat, in part, Reed et al. (2022) suggest cryopreserving beech embryos from Canada to develop a beech conservation collection that would be available for a more robust, future Canadian breeding program. The USFS is trying to develop methods to screen trees for resistance to BLD, specifically to the nematode (J. Koch, USFS, pers. comm.)

Another approach would actively manage beech stands in which potentially BLD-resistant beech grow to help these trees reach the canopy and reproduce. In the absence of management, any BLD-resistant beech seedlings might be overtopped by faster growing, shade-intolerant species – especially if the gaps promote soil drying or sun scald.

Finally, breeding programs need to factor in the beech leaf mining weevil, DMF which — as I noted in the beginning — is spreading across Nova Scotia and could spread to the rest of the native range of beech (Sweeney et al., 2020).

The Department of Agriculture has created a website on the Department’s plant-breeding efforts. It includes a subwebsite on USFS efforts. However, I did not find much useful information there.

SOURCES

Lovett, G.M., C.D. Canham, M.A. Arthur, K.C. Weathers, and R.D. Fitzhugh. 2006. Forest Ecosystem Responses to Exotic Pests and Pathogens in Eastern North America. BioScience Vol. 56 No. 5 May 2006)

Reed, S.F., D. Volk, D.K.H. Martin, C.E. Hausman, T. Macy, T. Tomon, S. Cousins. 2022. The distribution of beech leaf disease and the causal agents of beech bark disease (Cryptoccocus fagisuga, Neonectria faginata, N. ditissima) in forests surrounding Lake Erie and future implications Forest Ecology and Management 503 (2022) 119753

Sweeney J.D., Hughes, C., Zhang, H., Hillier, N.K., Morrison, A. and Johns R. (2020) Impact of the Invasive Beech Leaf-Mining Weevil, Orchestes fagi, on American Beech in Nova Scotia, Canada. Frontiers in Forests and Global Change | www.frontiersin.org 1 April 2020 | Volume 3 | Article 46

Posted by Faith Campbell

We welcome comments that supplement or correct factual information, suggest new approaches, or promote thoughtful consideration. We post comments that disagree with us — but not those we judge to be not civil or inflammatory.

For a detailed discussion of the policies and practices that have allowed these pests to enter and spread – and that do not promote effective restoration strategies – review the Fading Forests report at http://treeimprovement.utk.edu/FadingForests.htm
Asian giant hornet in Washington State: Update

Asian giant hornet; photo by Yasunori Koide; Wikimedia commons

They’re still here … and perhaps more widespread than thought last year. What officials have learned is that colonies are often high up in trees, not in the ground, as expected based on behavior in Asia. This makes detection and control especially difficult.

In June a citizen found a dead Asian giant hornet (AGH) male in Snohomish County. This county in the Seattle metropolitan area is separated from Whatcom County (site of last year’s detections) by a third county, Skagit County. The Washington State Department of Agriculture (WSDA) responded by setting up traps in Snohomish and King counties, and urging citizens to be alert and report any hornet sightings.

Equally worrying, the dead wasp was determined by appearance and genetics to be unrelated to the colonies detected in 2019 and 2020 in Washington and British Columbia. Trapping in the areas found no additional specimens (S. Spichiger pers. comm.)

In July, WSDA designated the hornet genus Vespa as a quarantine pest; this action confirms WSDA authority to control access to nest sites.

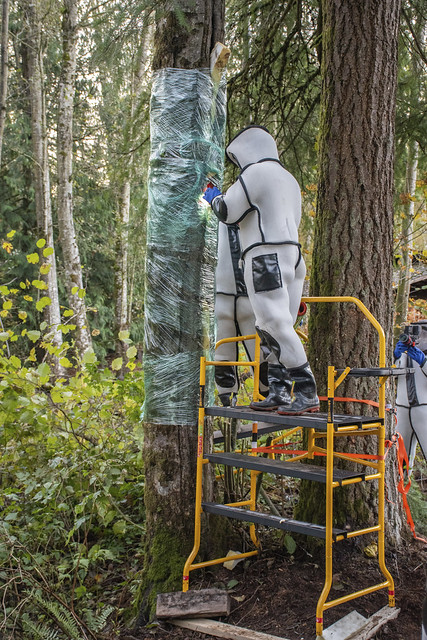
nest eradication; WSDA photo

Nests Found and Destroyed

Starting in late summer, citizens began reporting sightings and officials succeeded in tracking hornets to their nests. However, it was not easy! Eradicating Asian giant hornets demands lots of resources and commitment. While all these nests were in Whatcom County – site of last year’s detections — it is clear that several colonies had been established. It seems to me highly unlikely that they have all been detected.

Detection of the first nest in 2021 came in August, following several visual detections of the hornets attacking nests of paper wasps. WSDA staff captured and tagged three hornets over a couple of days. They succeeded in tracking the third hornet when it reappeared a week later. The nest was destroyed (after removal of all hornets) on August 25th. This nest held nine layers of comb with 292 eggs, 422 larvae, and 563 prepuae. Nearly 200 adult hornets were killed. One queen was found. [Hornet Herald 21.07 Sept. 8 2021]  The nest was at the base of a dead alder tree in rural Whatcom County, east of Blaine, just 400 metres south of the Canadian border.

The second and third nests were detected on September 8 and 10, 2021. In these cases, tagging and tracking the hornets was easier than in August. Nest eradication was not easy, however. Both nests were high inside dead alder trees, making access difficult. Both nests held multiple combs with hundreds of larvae, eggs, and pupae. Fortunately, only one queen was found in each. [Hornet Herald 21.08; October 5, 2021]

No detections have occurred since these.

WSDA also collected data on foraging behaviors of wasps in the third nest. Data include information on periods during the day when the wasps are active, and what materials they bring back to the nest – which includes wood pulp for nest comb construction and insect thoraces for feeding the pupae. [Hornet Herald 21.08; October 5, 2021]

It is encouraging that only one queen was found in each nest; in 2020, the single nest officials destroyed held 200 queens!

Trapping in British Columbia

Although British Columbia officials increased the number of traps in 2021, and urged citizens to also set out traps, no confirmed AGH finds were made in British Columbia until early November, when one was caught in a trap set for Japanese beetles. This hornet was on the border with Washington, so officials are trying to determine whether it came from one of the nests already discovered there.

There were a couple of unconfirmed sightings. On October 22 a single, aged specimen was found in a Japanese beetle trap about 1.2 km north of the first hornet nest extracted this year in Washington. The beetle trap had been serviced one month earlier. Canadian government entomologists are analyzing the DNA of this specimen to see if it was related to the Washington State nests.

At least one citizen said he had seen an Asian giant hornet in July, but officials said they could not investigate until they had either a picture or a specimen.

Asian giant hornet with radio tag developed by USDA APHIS scientists

Intriguing wrinkle

Mattila et al. (2021) describe an “impressive array of strategies” Asian honey bees use to protect nests from attacks by hornets in the genus Vespa, including a previously unknown use of auditory and perhaps chemical signals to warn nest mates.  The authors suggest that this diverse alarm repertoire is similar to alarms issued by socially complex vertebrates such as primates and birds.

SOURCES OF INFORMATION

USDA Agriculture Research Service:  https://scientificdiscoveries.ars.usda.gov/highlights/asian-giant-hornet/

Washington State Department of Agriculture https://agr.wa.gov/hornets

Mattila, H.R., H.G. Kernen, G.W. Otis, L.T.P. Nguyen, H.E. Pham, O.M. Knight, N.T. Phan. 2021.

Giant hornet (Vespa soror) attacks trigger frenetic antipredator signalling in honeybee (Apis cerana) colonies. R. Soc. Open Sci. 8: 211215. https://doi.org/10.1098/rsos.211215

Posted by Faith Campbell

We welcome comments that supplement or correct factual information, suggest new approaches, or promote thoughtful consideration. We post comments that disagree with us — but not those we judge to be not civil or inflammatory.

For a detailed discussion of the policies and practices that have allowed tree-killing pests to enter and spread – and that do not promote effective restoration strategies – review the Fading Forests report at http://treeimprovement.utk.edu/FadingForests.htm
The Lacey Act – Can It Protect US from Invasive Species?

Sean Connery as Hotspur, Shakespeare Henry IV Part I (BBC, “Age of Kings”)

[Starlings – one of the agricultural pests that prompted adoption of the Lacey Act – were introduced to the U.S. because they were mentioned by Shakespeare: Hotspur says “Nay, I’ll have a starling shall be taught to speak nothing but ‘Mortimer,’ and give it him, to keep his anger still in motion.”]

Americans are increasingly aware of the damage caused by invasive species. The law that ostensibly protects our environment from most potentially invasive animals is the Lacey Act – more specifically, the “injurious wildlife” sections of the law, now known as 18 U.S.C. 42 or title 18.

When it was adopted 120 years ago, the Lacey Act was not intended to protect the environment from the full range of possible animal bioinvaders. While Congress amended it several times in the first 60 years of its existence, the law still has many gaps that impede its usefulness for that purpose.

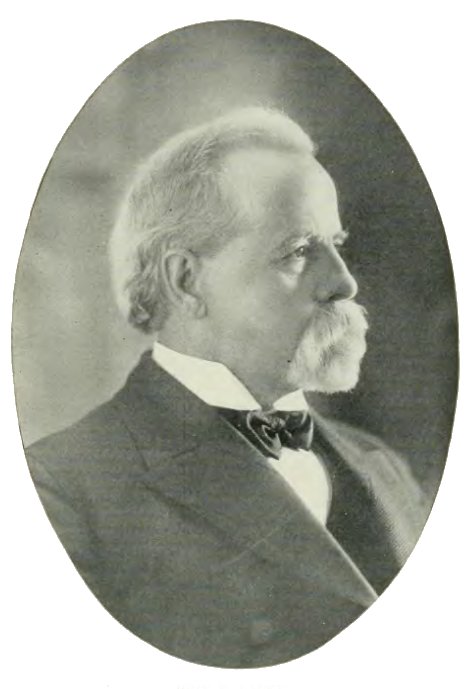
Rep. John F. Lacey via Wikimedia Commons

When first adopted in 1900, the injurious wildlife provisions of the Lacey Act prohibited importation only of wild mammals and birds that posed a threat to agriculture and horticulture. The statute was quite broad in that it prohibited importation of any wild bird or mammal without a permit; there was no requirement that a species be designated as “injurious” to be regulated. The Act was then administered by the U.S. Department of Agriculture. [For a detailed discussion of the Lacey Act’s changing provisions, see Jewell 2020; full reference at the end of this blog.]

In 1960 the Act was amended to expand the list of taxa eligible for designation as “injurious” to include fishes, mollusks, crustaceans, reptiles, and amphibians. Congress also expanded the justifications for listing a species as injurious. It added harm to people, to forestry, or to wildlife or US wildlife resources to the law’s original concerns for agriculture and horticulture. This second change brought the purposes of the Lacey Act closer to the mandate of the U.S. Fish and Wildlife Service (USFWS) – which had assumed responsibility for implementing the Act in 1939.

Unfortunately, Congress simultaneously took other action that greatly weakened USFWS’ ability to use the Act to protect the environment from introduced animals. First, it dropped the requirement that the Secretary approve, with a permit, any importation of a wild bird or mammal.

Second, the 1960 amendment clouded the originally clear prohibition of movement of listed species across state lines. The new language prohibits “any shipment between the continental United States, the District of Columbia, Hawaii, the Commonwealth of Puerto Rico, or any possession of the United States …”

For the next 57 years, the USFWS and Congress sometimes interpreted that language as continuing to prohibit transport between the states within the continental United States. However, this situation could not last. In 2017, acting in a case that had challenged the 2012 listing of several nonnative constrictor snakes as “injurious,” the D.C. Circuit court found that the plain language of §18 U.S.C. 42(a)(1) does not prohibit the transportation of injurious wildlife between states within the continental United States. So now, transportation of injurious wildlife among the continental states is not prohibited by the statute in most circumstances.

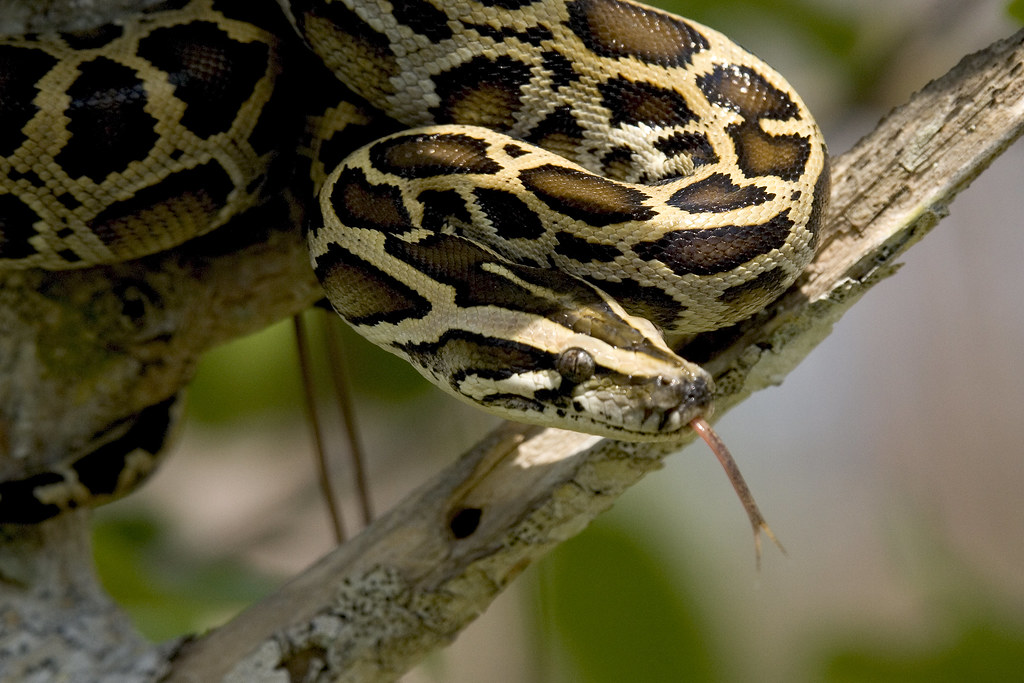
Burmese python; photo by R. Cammauf, Everglades National Park via Flickr

The Law’s Strengths

Some aspects of the law have been strengths. Since the term “injurious” has never been defined, the USFWS has been able to use its discretion to list species that are not necessarily invasive themselves but that might cause harm in some other way. For example, the salmon family and 20 genera of salamanders have been listed because they are vectors of harmful wildlife pathogens.

In addition, USFWS has listed entire genera or families of organisms – as long as each species within the taxon has been shown to possess the “injurious” trait(s). This flexibility has probably helped listings aimed at precluding importers from switching from the species that initially raised concerns to related species.

The Law’s Inherent Weaknesses

1) Legal shortfalls

Due to the confusion created by the 1960 amendment, the USFWS now lacks authority to prohibit interstate transport of species listed as “injurious”. This gap undermines the law’s efficacy in controlling spread of listed species once they are established within the U.S.

Also, the law does not prohibit other human actions that pertain to the presence and spread of species listed as “injurious,” e.g., sale, possession, or intra-state transport. Addressing these other aspects of invasive species policy was left to other players, such as states or resource managers.

2) Funding shortfall

Neither the Executive Branch nor Congress has ever provided specific funding for implementation of the Lacey Act. Only one USFWS staffer has the job of listing species under the Act. This situation might change now, since the American Rescue Plan Act adopted in spring 2021 does provide funding over the next five years for listing species that can vector pathogens harmful to people.

Staff’s Evaluation of Its Implementation of the Lacey Act

Since USFWS took over implementation of the Lacey Act in 1939, 36 taxonomic groups have been added to the “injurious wildlife” list. Seven of these listings comprise multiple species – either as genera or families. 

Two mammals have been listed since the late 1960s – brushtail possum in 2002 and raccoon dog in 1983. Recent listings have strongly focused on aquatic organisms. This is because the staff is housed in the Fish and Aquatic Conservation program and their expertise is in these species.

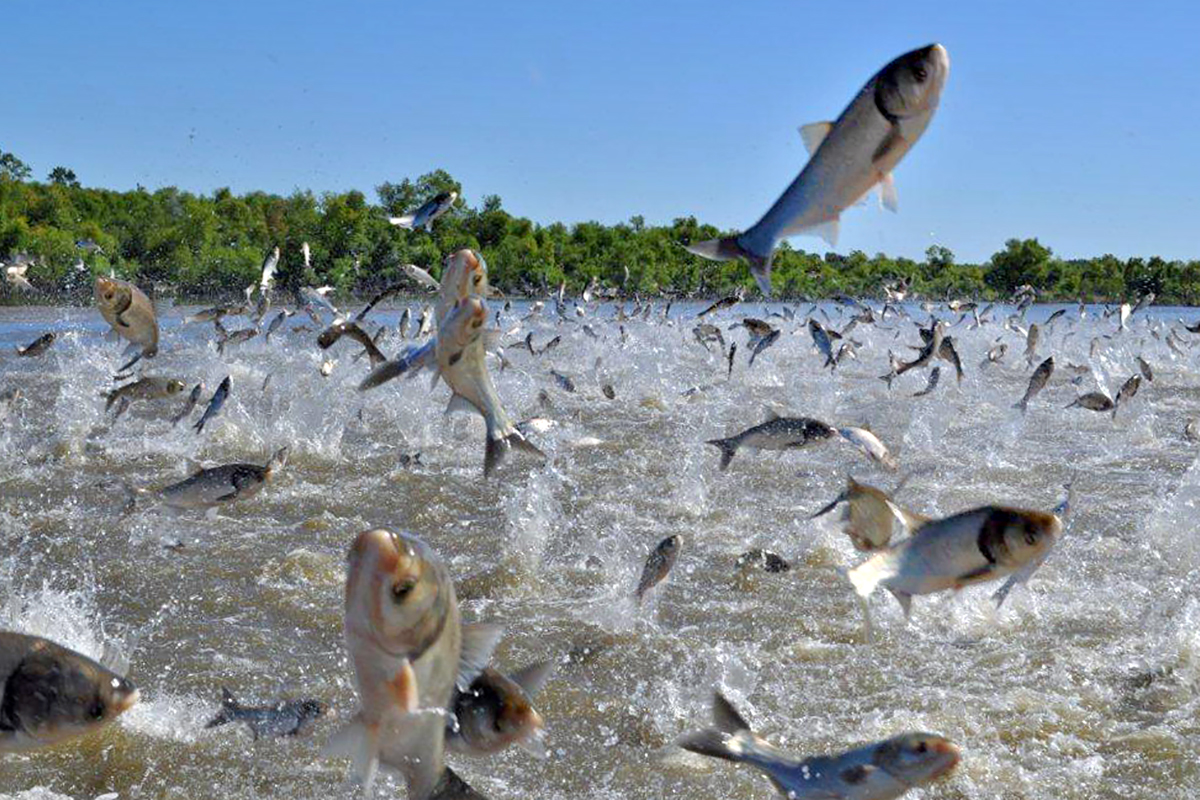
silver carp; photo by University of Illinois

Listing activity appeared to be building in the second decade of the 21st Century, with multi-species listings of fish, snakes, and salamanders between 2012 and 2016. However, there has been only one listing action since 2016 – and that was by an act of Congress (listing of the quagga mussel).

In two peer reviewed papers, the USFWS’ Jewell and Fuller provide a history of the Lacey Act’s injurious wildlife title and analyze the effects of listing of 307 species (those listed since 1952). They conclude that 98% of the species listings were “effective” because the listed species either had not been introduced subsequent to listing [288 species; 94% of the total number of listed species] or had not spread to additional states [12 species, 4% of the total]. Another way to calculate the latter figure is to say that 63% of all established species have remained within the state(s) where they were established at the time of listing. Only three species have been spread to additional states by human actions. In these cases, Jewell and Fuller considered the Lacey Act measures to be “ineffective”. For further details on the Jewell and Fuller evaluations of listing efficacy, see their article – full citation given at the end of this blog.

Jewell and Fuller do not evaluate the impacts of animal species introduced to the U.S. after 1960 that have never been listed under the Lacey Act, or speculate about whether listing those species might have minimized the risk of their introduction.

Jewell and Fuller consider listing of species not yet established in the U.S. to be most effective for two reasons. First, listing minimizes the probability that the species will be imported intentionally or unintentionally. Second, listing provides states with risk analyses and other information on which to rely in adopting their own restrictions, including possible prohibitions on sale or possession.

Jewell and Fuller also argue that even in the absence of legal authority to regulate interstate transport of listed species among the continental states, it is still worthwhile to list species that are already established in the U.S. They give six reasons. I summarize those reasons (placing them in my order, not Jewell and Fuller’s):

1) Listing can protect the islands of Hawai`i, Puerto Rico, and the Caribbean and Pacific territories. All are extremely vulnerable to invasive species.

2) If a species shares the traits of injuriousness with other species, particularly those in the same genus or family, then including the already-invasive species demonstrates why the related species should also be listed.

3) Many imported animals carry parasites and pathogens harmful to native species, and stopping the continued importation can reduce those threats that cause disease.

4) Prohibiting further importation of the invasive species can prevent individuals from being introduced to new areas where the species would not otherwise have arrived and can reduce propagule pressure that could introduce hardier individuals.

5) Listing can provide states and other jurisdictions with the technical information they need to pursue additional restrictions not federally authorized under 18 U.S.C. 42, such as transport into a state, possession, and sale.

6) Listing reduces propagule pressure and might enhance the efficacy of any eradication or control measures.

How to Improve the Lacey Act

1) Amend the Lacey Act to restore authority to regulate interstate movement of listed species – including among the continental states and emergency listing authority. Also establish a more streamlined listing process.

2) Strengthen implementation of the law by providing a specific, adequate appropriation to hire additional staff. Utilize the enhanced resources to assess species proactively using risk assessment tools.

It is not yet clear whether the Biden Administration will initiate a more active listing process, especially beyond the zoonotic disease vectors that are the subject of the American Rescue Plan Act.

Note: The “injurious wildlife” section of the Lacey Act (18 U.S.C. 42, or title 18) is separate from another part of the Lacey Act (16 U.S.C. 3371-3378) that is has always been more widely known. This provision regulates wildlife trafficking across State lines. It was later broadened to include plants and trafficking of wildlife and plants from foreign countries.

SOURCES

Jewell S.D. (2020) A century of injurious wildlife listing under the Lacey Act: a history. Management of Biological Invasions. Volume 11, Issue 3: 356–371, https://doi.org/10. 3391/mbi.2020.11.3.01 https://www.reabic.net/journals/mbi/2020/3/MBI_2020_Jewell.pdf

Jewell S.D., P.L. Fuller (2021) The unsung success of injurious wildlife listing under the Lacey Act. Management of Biological Invasions. Volume 12, Issue 3:527-545 https://www.reabic.net/journals/mbi/2021/3/MBI_2021_Jewell_Fuller.pdf

Alternative view – that Lacey Act implementation has failed to protect the U.S. – presented by the following authors:

Fowler, A.J., D.M. Lodge and J. Hsia. 2007. Failure of the Lacey Act to protect US ecosystems against animal invasions. Frontiers in Ecology and the Environment.

Springborn, M. C.M. Romagosa and R.P. Keller. 2011. The value of nonindigenous species risk assessment in international trade. Ecological Economics

Jenkins, P.T. 2012. Invasive animals and wildlife pathogens in the United States: the economic case for more risk assessments and regulation. Biological Invasions

Posted by Faith Campbell

We welcome comments that supplement or correct factual information, suggest new approaches, or promote thoughtful consideration. We post comments that disagree with us — but not those we judge to be not civil or inflammatory.

New Study on Forest Carbon and Pests: The Picture is Ugly

lodgepole pines killed by mountain pine beetle in British Columbia; photo courtesy of Wikipedia

Natural systems, especially forests, could provide as much as 37% of the near-term mitigation necessary to meet Paris global climate goals. In the US, conservation, restoration, and improved land management could provide carbon sequestration equivalent to an estimated 21% of current net annual emissions.

However, the current U.S. forest carbon sink, which includes soils and standing and downed wood as well as live trees, might be in jeopardy due to increasing levels of disturbance, conversion, and/or declining sequestration rates in old growth stands.

Insects and plant diseases are one such disturbance agent. Acting alone or in combination with other forest stressors, they can damage or kill large numbers of trees in short periods of time, thereby reducing carbon sequestration and increasing emissions of stored carbon through decomposition of wood in dead or injured trees.

Historically, native and introduced insects and diseases have impacted an estimated 15% of the total U.S. forest cover annually. This impact is likely to increase. One study (Fei et al., 2019) found that an estimated 41% of the live forest biomass in the contiguous U.S. could be impacted by the 15 most damaging introduced pests already established in the U.S. Continuing introductions of new pests and exacerbated effects of native pests associated with climate change portend worsening losses of live trees. These rising impact of pests, combined with more frequent and severe fires and other forest disturbances, are likely to negate efforts to improve forests’ carbon sequestration capacity.

Sources of information about introduced pests’ impacts is available from, inter alia Campbell and Schlarbaum Fading Forests  II and III, Lovett et al 2016, Poland et al. 2021, many  blogs on this site, and pests’ profiles posed here under “invasive species” tab. Chapter 4 of Poland et al. (2021) provides a summary of what is known about interactions between invasive species and climate change – both climate impacts on bioinvaders and bioinvaders’ effect on carbon sequestration.

The United States and other major polluting countries have certain advantages. Their strong economies have the scientific and financial resources needed to implement effective invasive species prevention and forest management strategies. At the same time, many of them receive the most new forest pests – because they are major importers. These introduced pests pose the most serious and urgent near-term ecological threat to their forests and all the ecosystem services forests provide.

So, reducing insect and disease impacts to forests can simultaneously serve several goals—carbon sequestration, biodiversity conservation, and protecting the myriad economic and societal benefits of forests. See the recent IUCN report on threatened tree species.

A Major New Study

A new study by Quirion et al. (2021) takes another step in quantifying the threat to U.S. forests’ ability to sequester carbon by analyzing data from National Forest Inventory plots. Unfortunately, the re-measurement data for the period 2001 – 2019 are not available in the NFI for the Rocky Mountain states, which represents a critical data gap in the NFI program. This gap might not have had a significant impact on the national findings, however, because while the insect damage level (measured by an earlier inventory round) was quite severe in the Rocky Mountain States, the relatively slow growth of trees in that region means carbon sequestration rates are low.

Forest stand productivity – and carbon sequestration — will typically decline immediately after pest outbreaks, then recover or even increase beyond pre-outbreak levels depending on the productivity and maximum achieved biomass of replacement plant species and related soil characteristics. However, when prevalence of the disturbance increases, by, for example, more frequent pest outbreaks, carbon stocks in standing trees and sequestration rates can be reduced for extended periods.

Findings

  • Nationally, insects and diseases have decreased carbon sequestration by live trees on forest land by 12.83 teragrams carbon per year. This equals ~ 9% of the contiguous states’ total annual forest carbon sequestration and equivalent to the CO2 emissions from over 10 million passenger vehicles driven for one year.
  • This estimate includes the impacts of both native and introduced insects and diseases, because the NFI database does not distinguish between them.
  • Insect-caused mortality had a larger impact than disease-caused mortality (see below). Forest plots recently impacted by insect disturbance sequestered on average 69% less carbon in live trees than plots with no recent disturbance. Plots recently impacted by disease disturbance sequestered on average 28% less carbon in live trees than plots with no recent disturbance.
  • Ecoprovinces in which the greatest annual reductions in live tree carbon sequestration due to pests were the Southern Rocky Mountain Steppe, Cascade Mixed Forest, Midwest Broadleaf Forest, and Laurentian Mixed Forest. (Ecoprovinces are outlined – but not named – in Quirion et al. 2021; more complete information is provided in the supplementary material.)

If this study had been carried out in the 1920’s, when chestnut blight and white pine blister rust were spreading across vast areas and killing large trees, the impact of diseases would have been much higher. Today, the most widespread impacts of diseases are on either small trees (e.g., redbay succumbing to laurel wilt) or slow-growing, high-elevation trees (e.g., whitebark and limber pine to white pine blister rust). As long as no equivalents of those earlier diseases are introduced, insects will probably continue to have the larger impacts.

western white pine killed by blister rust; photo from National Archives

Quirion et al. 2021 note that their estimates should be considered conservative. The USFS’s inventory records only major disturbances. That is, when mortality or damage is equal to or exceeds 25% of trees or 50% of an individual tree species’ count on an area of at least 0.4 ha. This criterion largely excludes less severe pest disturbances, including those from which trees recover but which might have temporary negative effects on carbon sequestration.

The study’s authors note that their work has important limitations. The dearth of data from the Rocky Mountain states is one. Other factors not considered include transfers of carbon from live biomass to dead organic matter, soils, and salvaged or preemptively harvested wood products.  As trees die from pests or diseases, their carbon becomes dead wood and decays slowly, producing a lag in the carbon emissions to the atmosphere.  A small fraction of the carbon in dead wood might be incorporated into soil organic matter, further delaying the emissions.  A full accounting of the carbon consequences of pests and diseases would require assessment of these lags, probably through a modeling study.

affects of mountan pine beetle on lodgepole pine in Rocky Mountain National Park, Colorado photo from Wikimedia

Actions to Maintain Carbon Sequestration

Quirion et al. (2021) outline several actions that would help protect the ability of America’s forests to sequester carbon. These suggestions address both native and introduced pests, since both contribute to the threatened reduction in capacity.

Concerning native pests, the authors call for improved forest management, but warn that measures must be tailored to species and environmental context.

Concerning introduced insects and pathogens, Quirion et al. (2021) call for strengthening international trade policies and phytosanitary standards, as well as their enforcement. The focus should be on the principal pathways: wood packaging (click on “wood packaging” category for on this blog site) and imported plants (click on “plants as vectors” category for on this blog site). Specific steps to reduce the rate of introduction of wood-boring insects include enforcement to increase compliance with the international treatment standard (ISPM#15), requiring trade partners – especially those which have repeatedly shipped infested packaging – to switch to packaging made from alternative materials. Introductions via the plant trade could be reduced by requiring foreign shippers to employ integrated management and critical control point systems (per criteria set by the U.S.) and using emergency powers (e.g., NAPPRA) to further restrict imports of the plants associated with the highest pest risk, especially plant species that are congeneric with native woody plants in North America. See Lovett et al 2016; Fading Forests II & III

As backup, since even the most stringent prevention and enforcement will not eliminate all risk, the authors urge increased funding for and research into improved inspection, early detection of new outbreaks, and strategic rapid response to newly detected incursions.

To reduce impacts of pests established on the continent – both recently and years ago – they recommend increasing and stabilizing dedicated funding for classical biocontrol, research into technologies such as sterile-insect release and gene drive, and host resistance breeding.

Thinning is useful in reducing damage by native bark beetles to conifers. However, it has not been successful in controlling introduced pests for which trees do not have an evolved resistance. Indeed, preemptive harvesting of susceptible species can harm forest ecosystems directly through impacts of the harvesting operation and indirectly as individual trees that may exhibit resistance are removed, reducing the species’ ability to develop resistance over time.

Further research is needed to clarify several more issues, including whether introduced pests’ impacts are additive to, or interact with, those of native species and/or other forest stressors.

SOURCE

Quirion BR, Domke GM, Walters BF, Lovett GM, Fargione JE, Greenwood L, Serbesoff-King K, Randall JM & Fei S (2021) P&P Disturbances Correlate With Reduced Carbon Sequestration in Forests of the Contiguous US. Front. For. Glob. Change 4:716582.  [Volume 4 | Article 716582] doi: 10.3389/ffgc.2021.716582

SOURCES of additional information

Campbell, F.T. and S.E. Schlarbaum. Fading Forest reports at http://treeimprovement.utk.edu/FadingForests.htm

Lovett, G.M., M. Weiss, A.M. Liebhold, T.P. Holmes, B. Leung, K.F. Lambert, D.A. Orwig, F.T. Campbell, J. Rosenthal, D.G. McCullough, R. Wildova, M.P. Ayres, C.D. Canham, D.R. Foster, S.L. Ladeau, and T. Weldy. 2016.  Nonnative forest insects and pathogens in the United States: Impacts and policy options.  Ecological Applications, 26(5), 2016, pp. 1437-1455

Poland, T.M., Patel-Weynand, T., Finch, D., Miniat, C. F., and Lopez, V. (Eds) (2019), Invasive Species in Forests and Grasslands of the United States: A Comprehensive Science Synthesis for the United States Forest Sector.  Springer Verlag. Available for download at no cost at https://www.fs.usda.gov/treesearch/pubs/61982

Posted by Faith Campbell

We welcome comments that supplement or correct factual information, suggest new approaches, or promote thoughtful consideration. We post comments that disagree with us — but not those we judge to be not civil or inflammatory.

For a detailed discussion of the policies and practices that have allowed these pests to enter and spread – and that do not promote effective restoration strategies – review the Fading Forests report at http://treeimprovement.utk.edu/FadingForests.htm