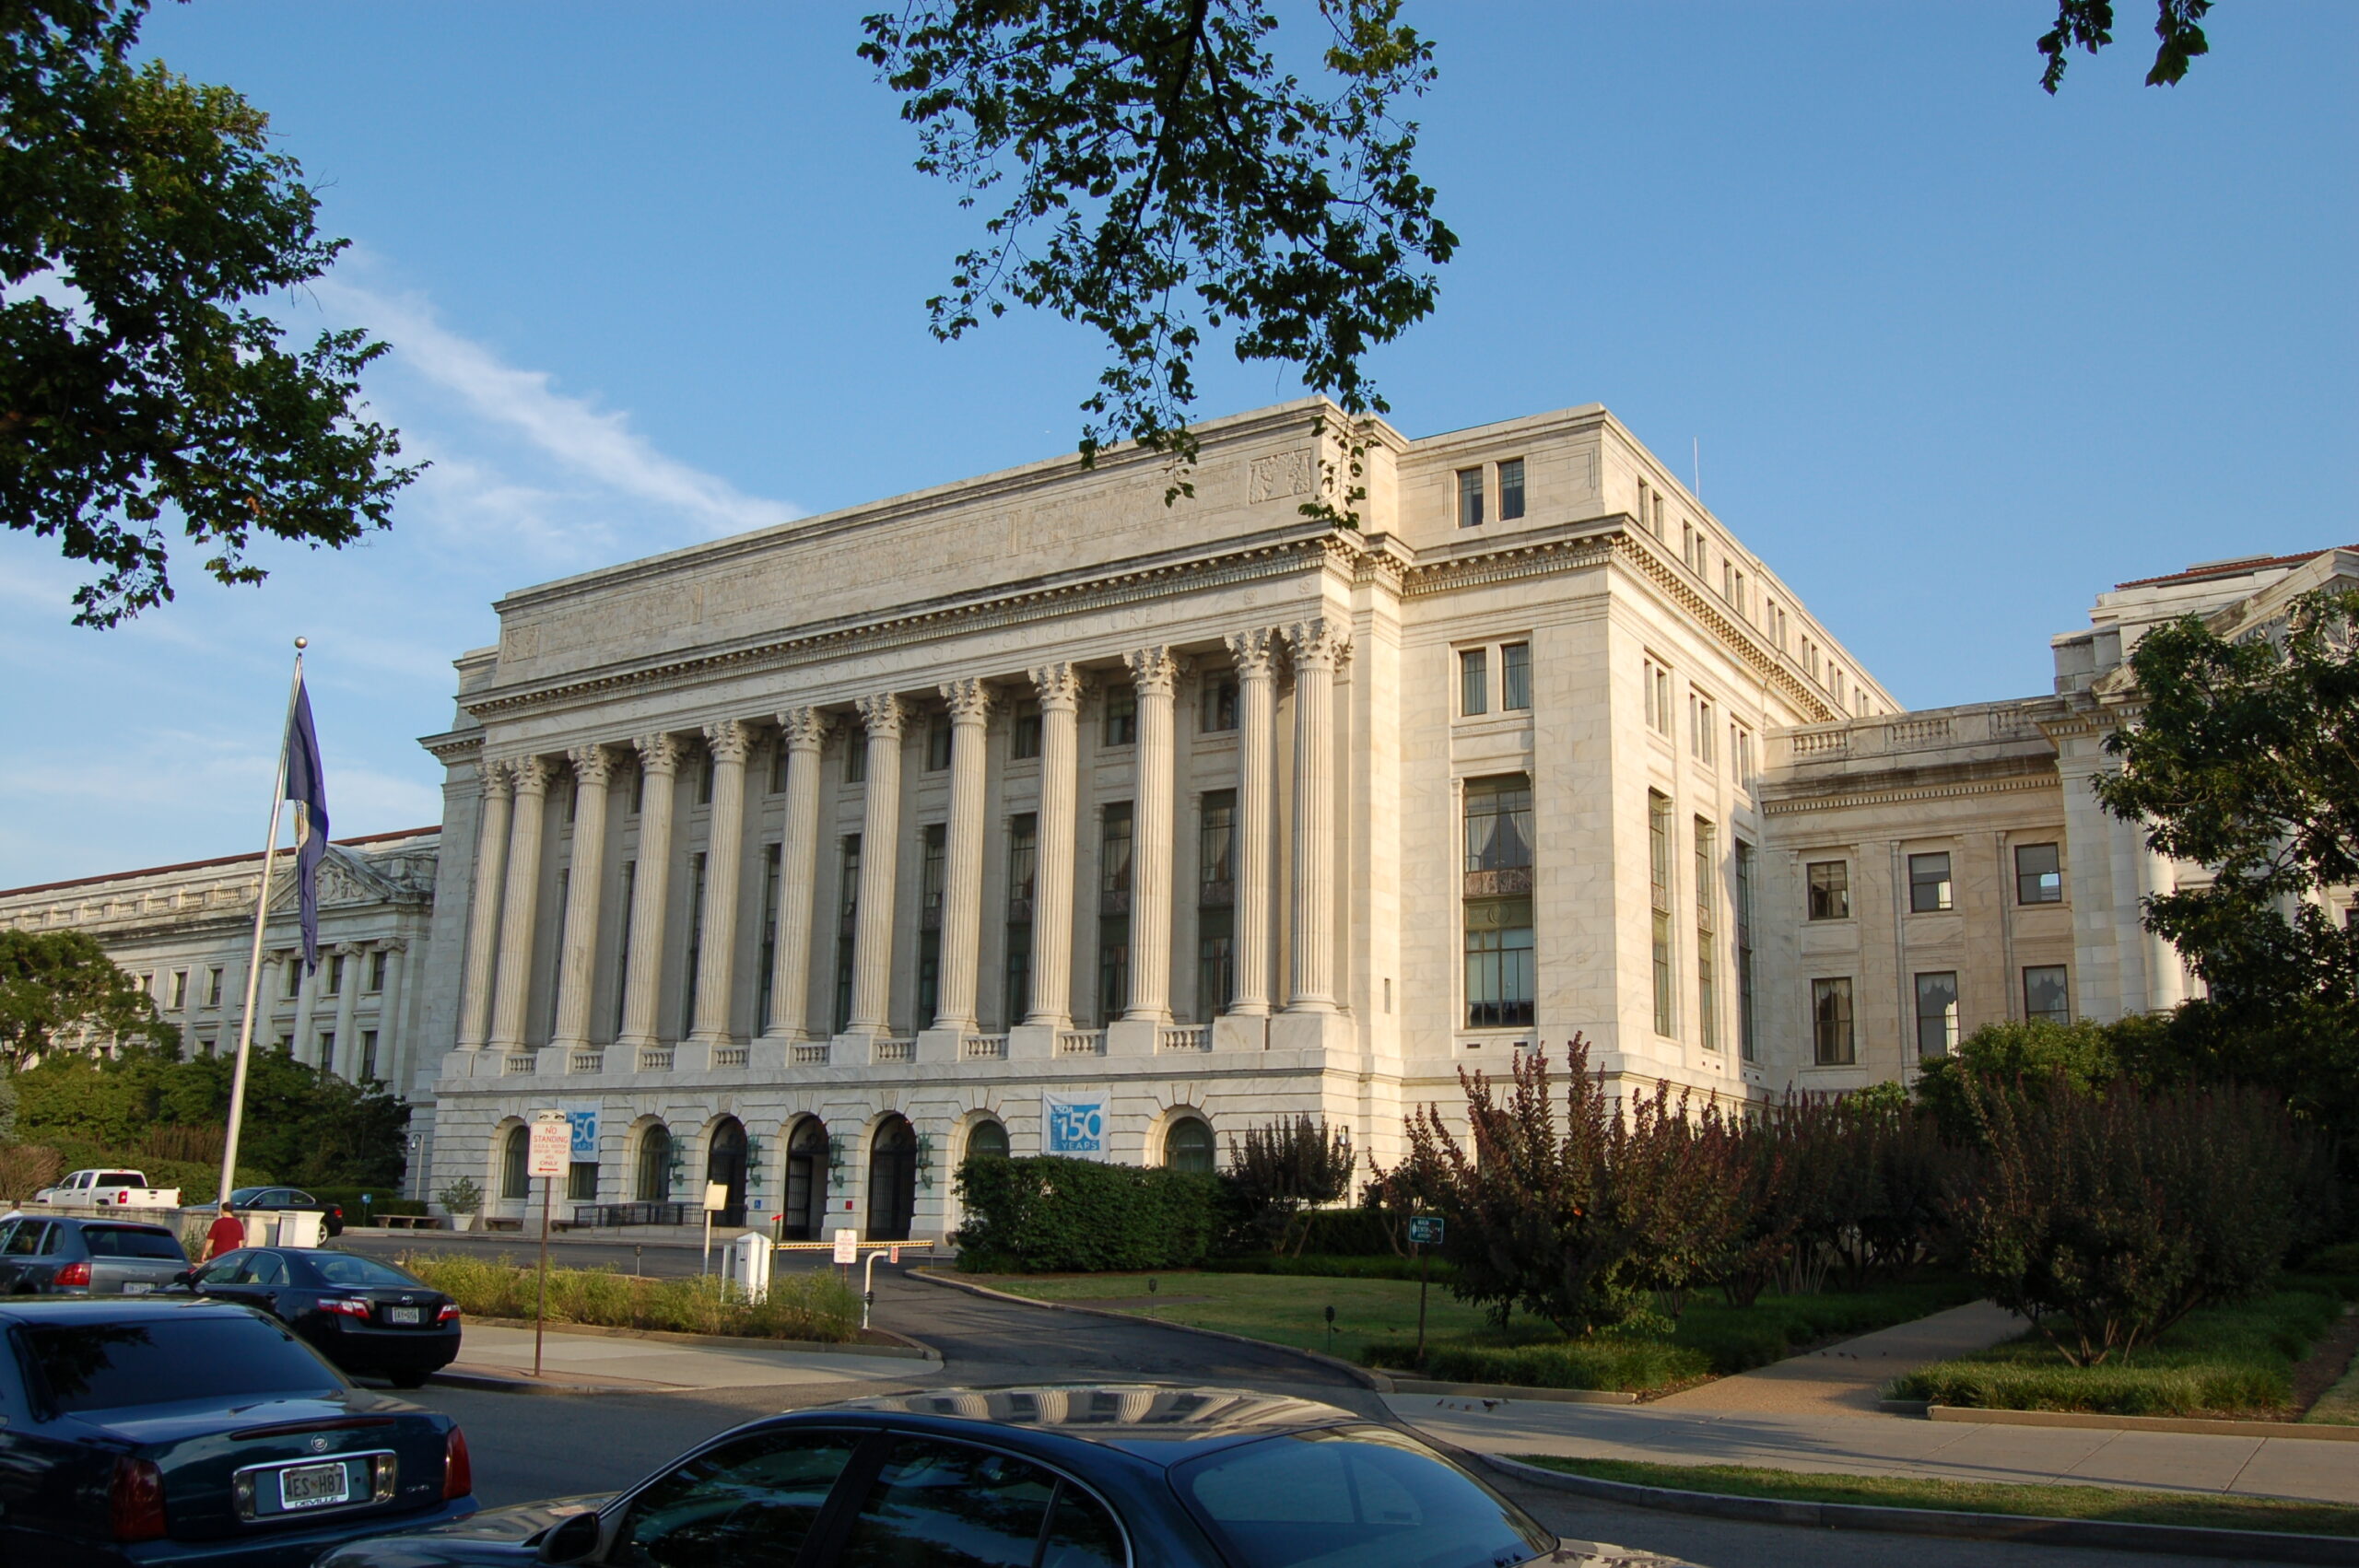
U.S. Department of Agriculture headquarters; lets lobby these people! photo by Wikimedia
Twenty-three scientists based around the world published a Letter to the Editor titled “Overwhelming evidence galvanizes a global consensus on the need for action against Invasive Alien Species” It appears in the most recent edition of Biological Invasions (2024) 26:621–626.
The authors’ purpose is to draw attention to the release of a new assessment by the Intergovernmental Science-Policy Platform on Biodiversity and Ecosystem Services’ (IPBES).
The report was issued in September 2023. It is described as the most comprehensive global synthesis of the current knowledge on the bioinvasion process and the impacts of invasive alien species (952 pages!). Its preparation took nearly a decade. Most important, it represents the first consensus among governments and scientists worldwide on the magnitude and extent of the threats that bioinvasions pose to nature, people, and the economy.
The proposed solutions are astoundingly broad and ambitious: transformation of how governments and societies perform. I don’t disagree! However, we need interim steps – “bites of the elephant.” In my view, the report falls short on providing these.
Our challenge: join others in bringing this analysis to decision-makers’ attention. Can we pull out information that will help persuade U.S. decision-makers – governmental and non-governmental – that the threat is both urgent and solvable? How do we more effectively advocate for the aggressive, science-based action that we all know is needed?
(I hope that the fact that the report was prepared under the auspices of the Convention on Biodiversity, to which the U.S. is not a party, does not intensify the challenge for us.)
Why we need to restructure the behavior of governments and societies
Bioinvasions are facilitated by policies, decision-making structures, institutions, and technologies that are almost always focused on achieving other goals. Species transport and introduction are driven by policies aimed at promoting economic growth – especially trade. Later stages of invasions, i.e., establishment and some spread, are accelerated by certain uses of land and sea plus climate change. For example, activities that fragment habitats or cause widespread habitat disturbance provide ready places for bioinvasions. Rarely are those who gain by such policies held accountable for the harms they produce via bioinvasions.
To address these unintended consequences, the IPBES report calls for “integrated governance.” Its authors want coordination of all policies and agencies that touch on the indirect drivers, e.g., conservation; trade; economic development; transport; and human, animal, and plant health. Policy instruments need to reinforce – rather than conflict with — strategic invasive species management across sectors and scales. This involves international agreements, national regulations, all governmental sectors, as well as industry, the scientific community, and ordinary people – including local communities and Indigenous Peoples.
The report also calls for establishment of open and inter-operable information systems. This improved access to information is critical for setting priorities; evaluating and improving regulations’ effectiveness; and reducing costs by avoiding duplication of efforts.
Critically important information that is often unspoken:
- Indirect causes underlying the usual list of human activities that directly promote bioinvasions are the rapid rise of human population and even more rapid rise in consumption and global trade.
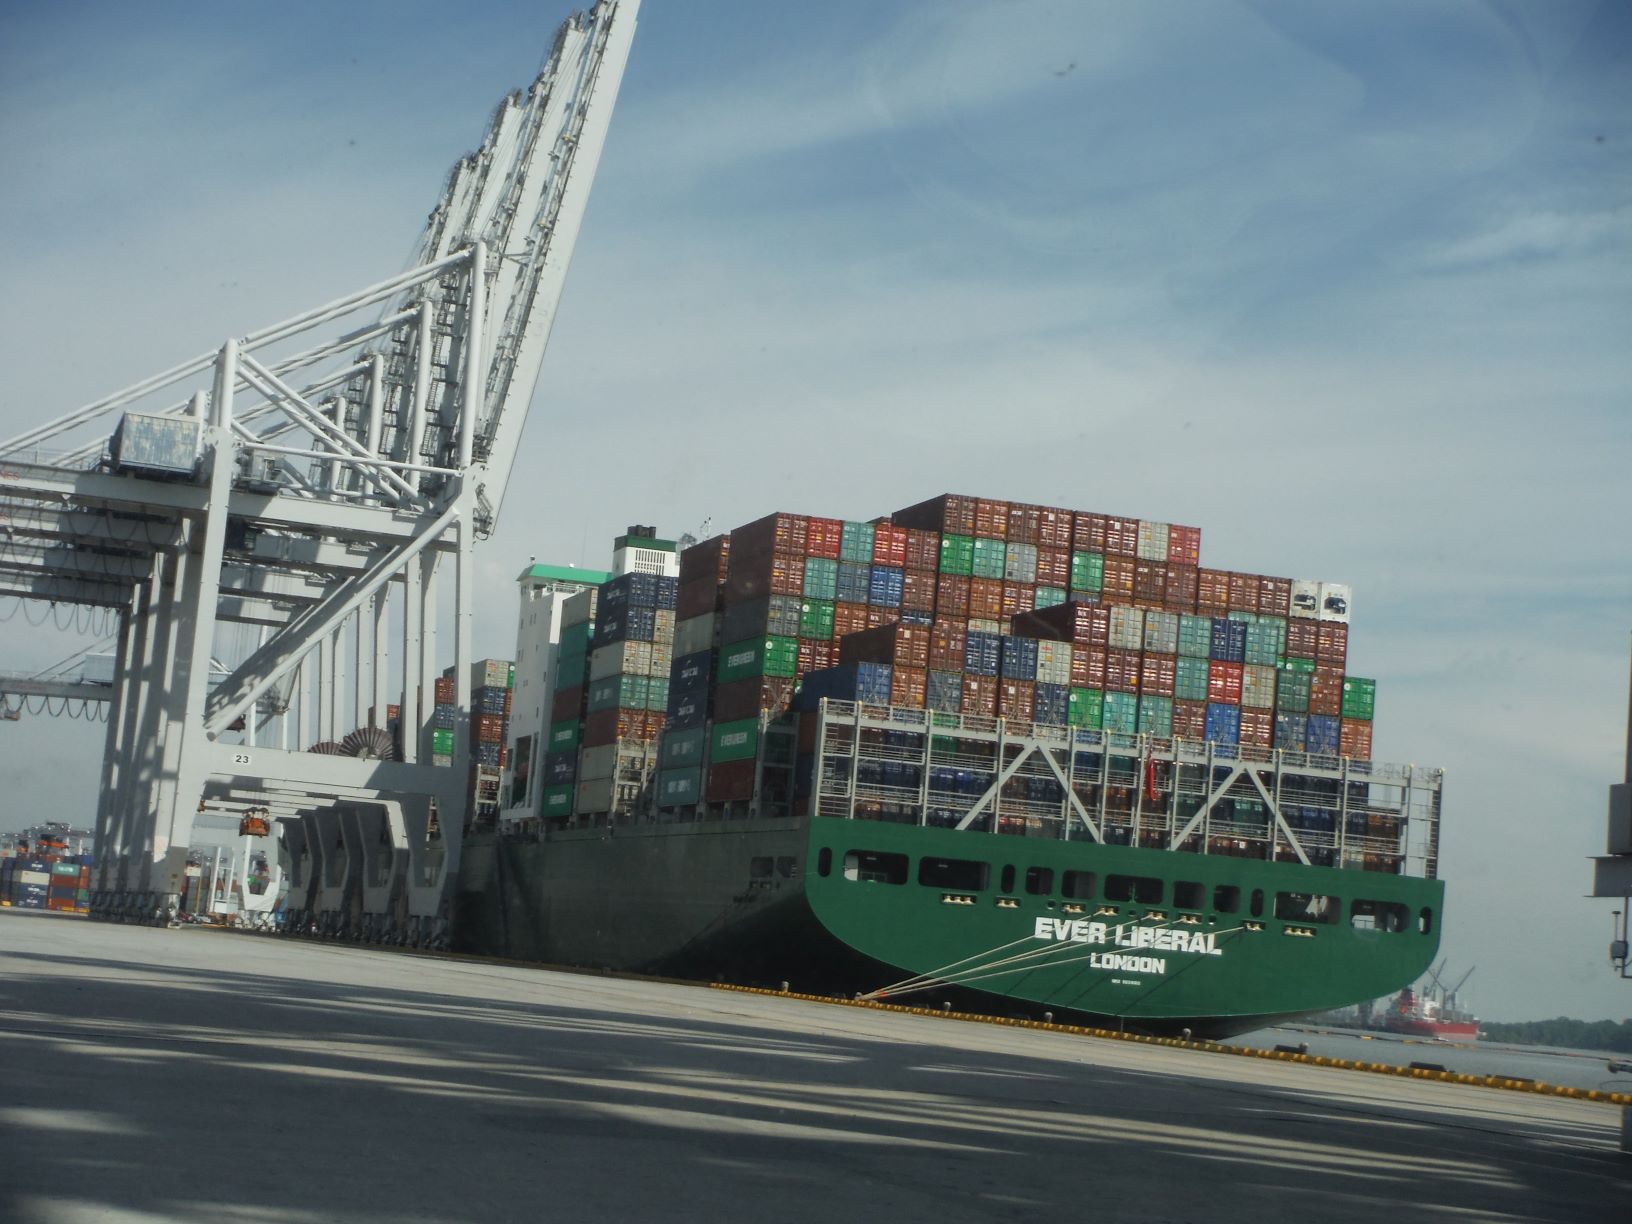
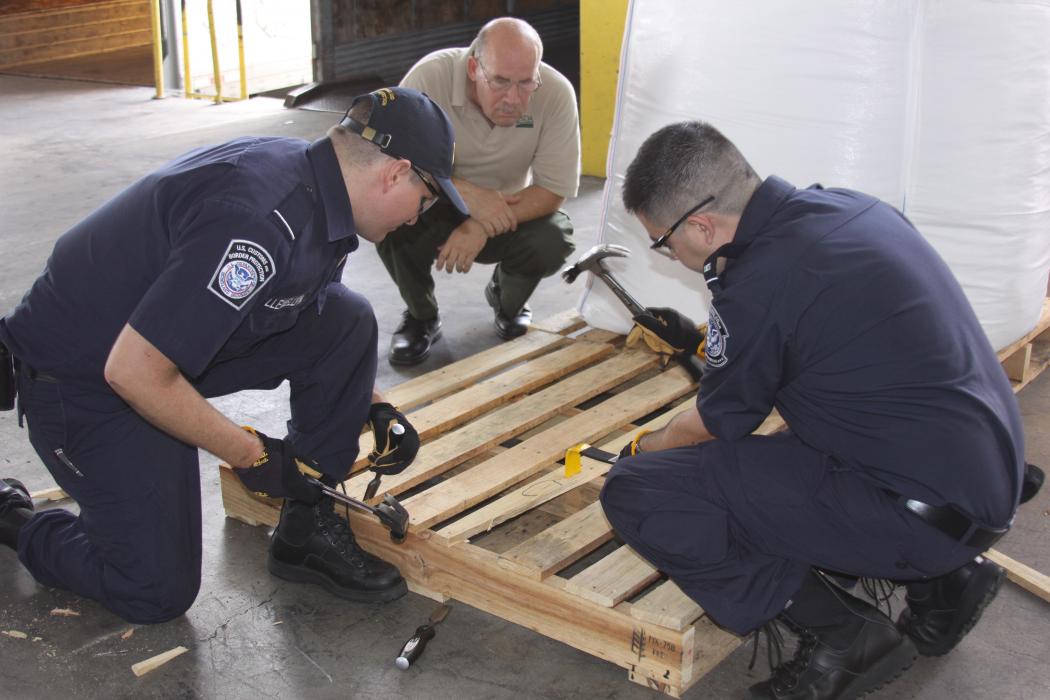
- Biosecurity measures at international borders have not kept pace with the growing volume, diversity, and geographic origins of goods in trade.
- Continuation of current patterns is expected to result in one-third more invasive species globally by 2050. However, this is an underestimate because today’s harms reflect the consequences of past actions – often from decades ago. Drivers of invasions are expected to grow in both volume and impact.
- We can prevent and control invasive alien species – but that success depends on the availability of adequate, sustained resources, plus capacity building; scientific cooperation and transfer of technology; appropriate biosecurity legislation and enforcement; and engaging the full range of stakeholders. These require political will.
- A major impact of bioinvasion is increased biotic homogenization (loss of biological communities’ uniqueness). This concerns us because we are losing the biotic heterogeneity that provides insurance for the maintenance of ecosystem functioning in the face of ongoing global change.
- The IPBES study asserts that successfully addressing bioinvasions can also strengthen the effectiveness of policies designed to respond to other drivers, especially programs addressing conservation of biological diversity, ensuring food security, sustaining economic growth, and slowing climate change. All these challenges interact. The authors affirm that evidence-based policy planning can reflect the interconnectedness of the drivers so that efforts to solve one problem do not exacerbate the magnitude of others and might even have multiple benefits.
More Key Findings
- Overall, 9% (3,500) of an estimated 37,000 alien species established in novel environments are invasive (those for which scientists have evidence of negative impacts). Proportions of invasives is high among many taxonomic groups: 22% of all 1,852 alien invertebrates; 14% of all 461 alien vertebrates; 11% of all 141 alien microbes; and 6% of all 1,061 alien plants. (The discussion of probable undercounts relates to aquatic systems and certain geographic regions. However, I believe these data are all undermined by gaps in studies.)
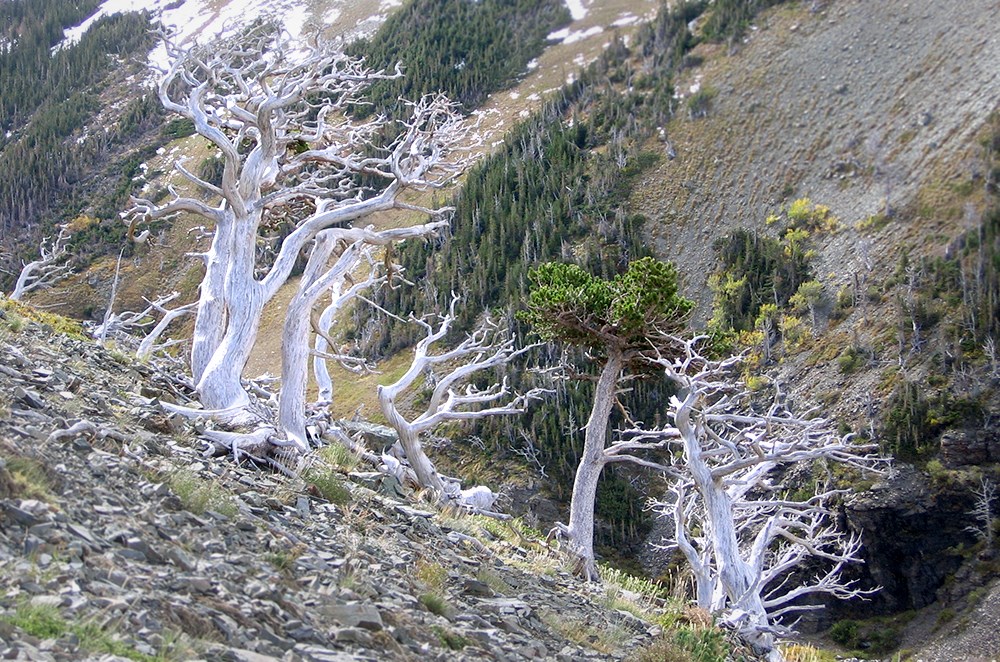
- Invasive alien species – solely or in combination with other drivers – have contributed to 60% of recorded global extinctions. Invasive species are the only driver in 16% of global animal and plant extinctions. Some invasive species have broader impacts, affecting not just individual species but also communities or whole ecosystems. Sometimes these create complexoutcomes that push the system across a threshold beyond which ecosystem restoration is not possible. (No tree pests are listed among the examples.)

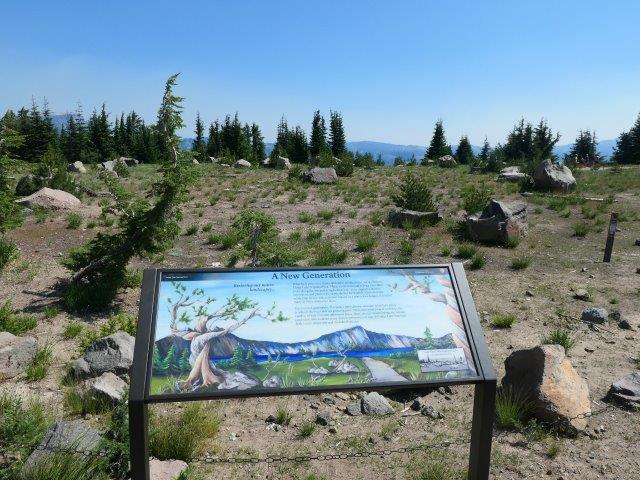
dead whitebark pine in Glacier National Park; photo by National Park Service
- The benefits that some non-native – even invasive – species provide to some groups of people do not mitigate or undo their negative impacts broadly, including to the global commons. The report authors note that beneficiaries usually differ from those people or sectors that bear the costs. The authors cite many resulting inequities.
- There are insufficient studies of, or data from, aquatic systems, and from Africa; Latin America and the Caribbean; and parts of Asia.
- The number of alien species is rising globally at unprecedented and increasing rates. There are insufficient data specifically on invasive species, but they, too, are thought to be rising at similar rates.
- Horticulure is a major pathway for introducing 46% of invasive alien plant species worldwide.
- Regarding invasive species’ greater impact on islands,the IPBES report mentions brown tree snakes on Guam and black rats on the Galapagos Islands. It also notes that on more than a quarter of the world’s islands, the number of alien plants exceeds the total number of native ones. See my blogs on non-native plants on Hawai`i and Puerto Rico. In addition, I have posted several blogs regarding disease threats to rare bird species in Hawai`. The IPBES report does not mention these.
Where the Report Is Weak: Interim Steps
- The report endorses adoption of regulated species (“black”) lists.
- The report emphasizes risk analysis of species. Unfortunately IPBES’ analysis was completed before publication of the critique of risk analysis methods by Raffa et al. ( (2023) (see references). However, we must take the latter into consideration when deciding what to advocate as U.S. policy.
- The report authors call for more countries to adopt national legislation or regulations specifically on preventing and controlling invasive species. (They note that 83% of countries lack such policies). They also list the many international agreements that touch on invasive species-relevant issues. However, Raffa et al. found that the number of such agreements to which a country is a party bears no relationship to the numbers of alien species detected at its border or established on its territory.
- The challenge to risk assessment posed by multiple sources of uncertainty can be managed by recognizing, quantifying, and documenting the extent of that uncertainty.
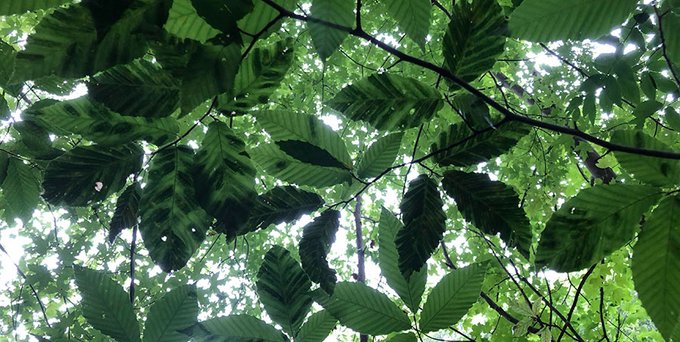
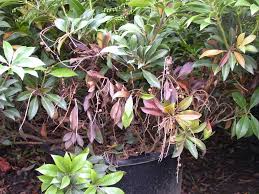
Beech leaf disease – one of many non-native pests that were unknown before introduction to a naive ecosystem. Photo by Jennifer Koch, USDA Forest Service
- I appreciate the report’s emphasis on the importance of public awareness and engagement, but I thought the discussion of effective campaigns lacked original ideas.
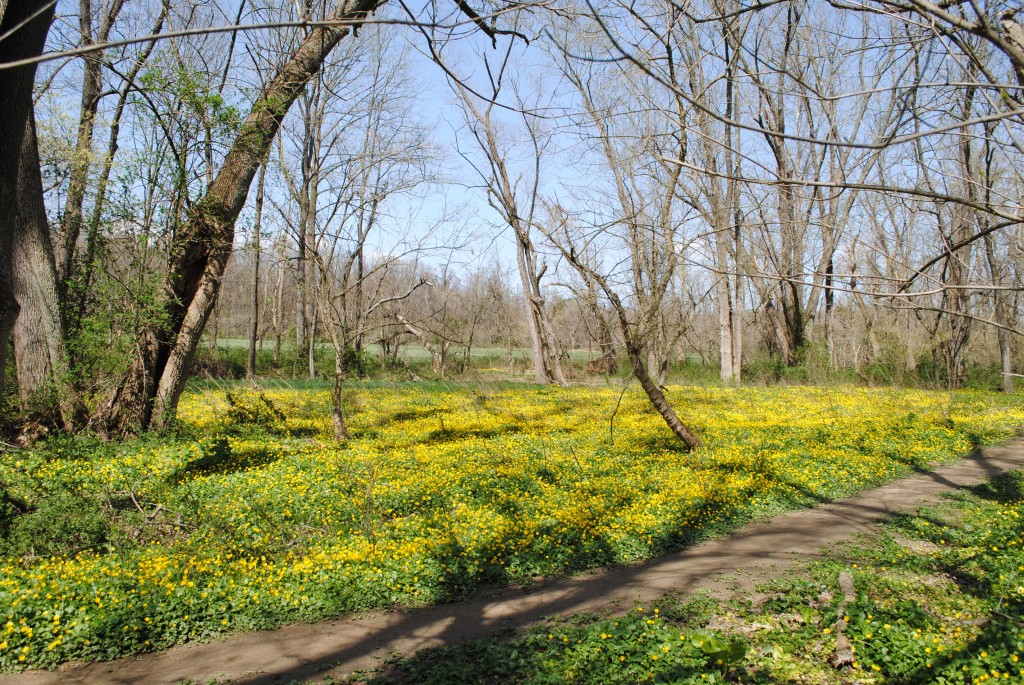
The report did not fulfill its own goal of fully exploring unappreciated impacts of policies in its discussion of habitat fragmentation. For example, the report notes that grazing by feral alien ungulates facilitates the spread of invasive alien plant species. However, it does not mention the similar impact by livestock grazing (Molvar, et al. 2024).
SOURCES
Molvar, E.M., R. Rosentreter, D. Mansfield, and G.M. Anderson. 2024. Cheat invasions: History, causes, consequences, and solutions. Hailey, Idaho: Western Watersheds Project, 128 pp.
Raffa, K.F., E.G. Brockerhoff, J-C. GRÉGOIRE, R.C. Hamelin, A.M. Liebhold, A. Santini, R.C. Venette, and M.J. Wingfield. 2023. Approaches to forecasting damage by invasive forest insects and pathogens: a cross-assessment. BioScience 85 Vol. 73 No. 2 (February 2023) https://academic.oup.com/bioscience
Posted by Faith Campbell
We welcome comments that supplement or correct factual information, suggest new approaches, or promote thoughtful consideration. We post comments that disagree with us — but not those we judge to be not civil or inflammatory.
For a detailed discussion of the policies and practices that have allowed these pests to enter and spread – and that do not promote effective restoration strategies – review the Fading Forests report at http://treeimprovement.utk.edu/FadingForests.htm
or