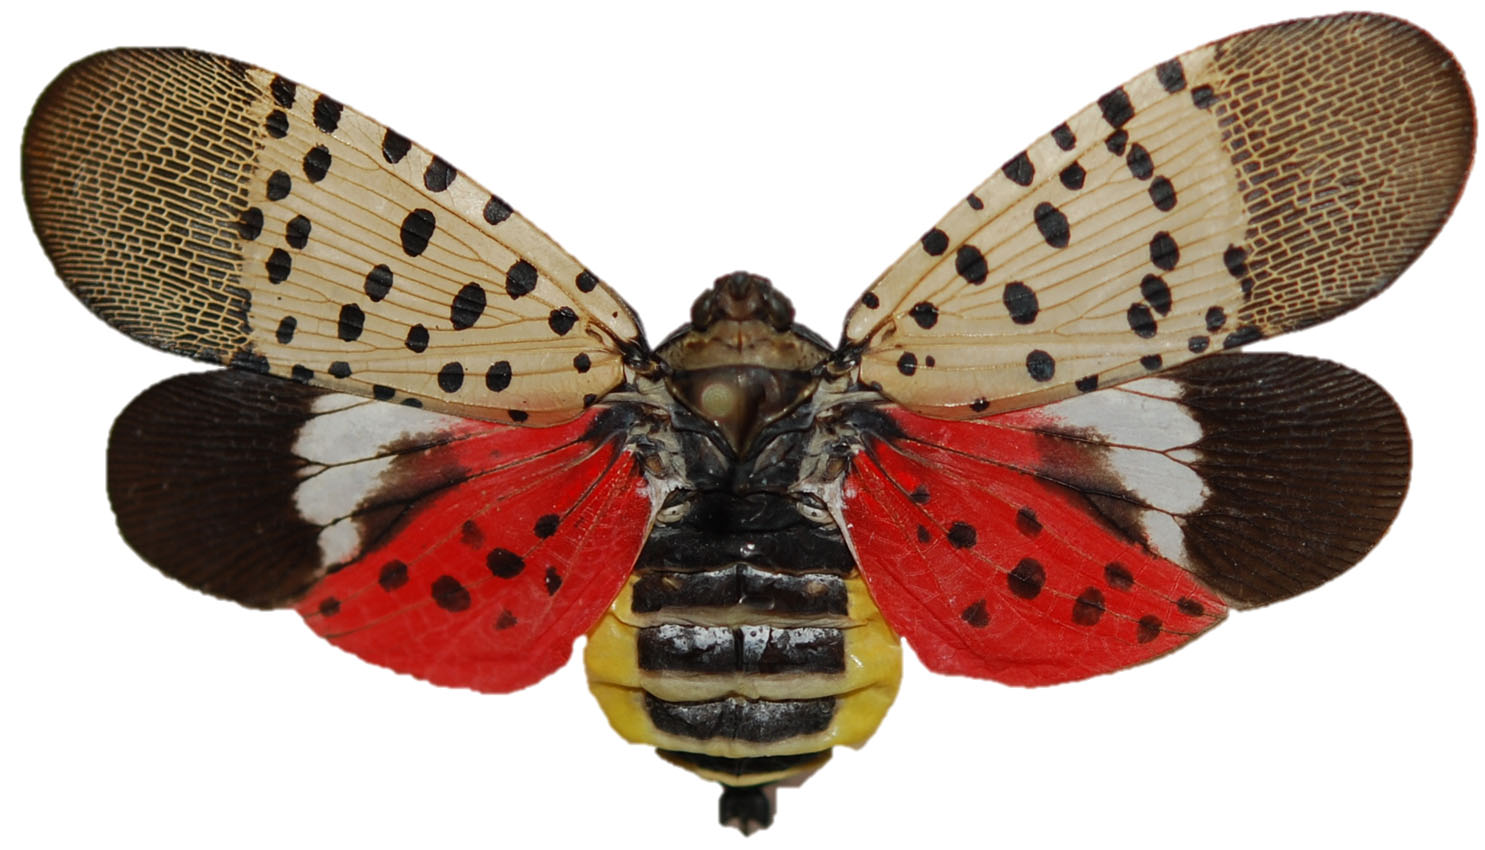
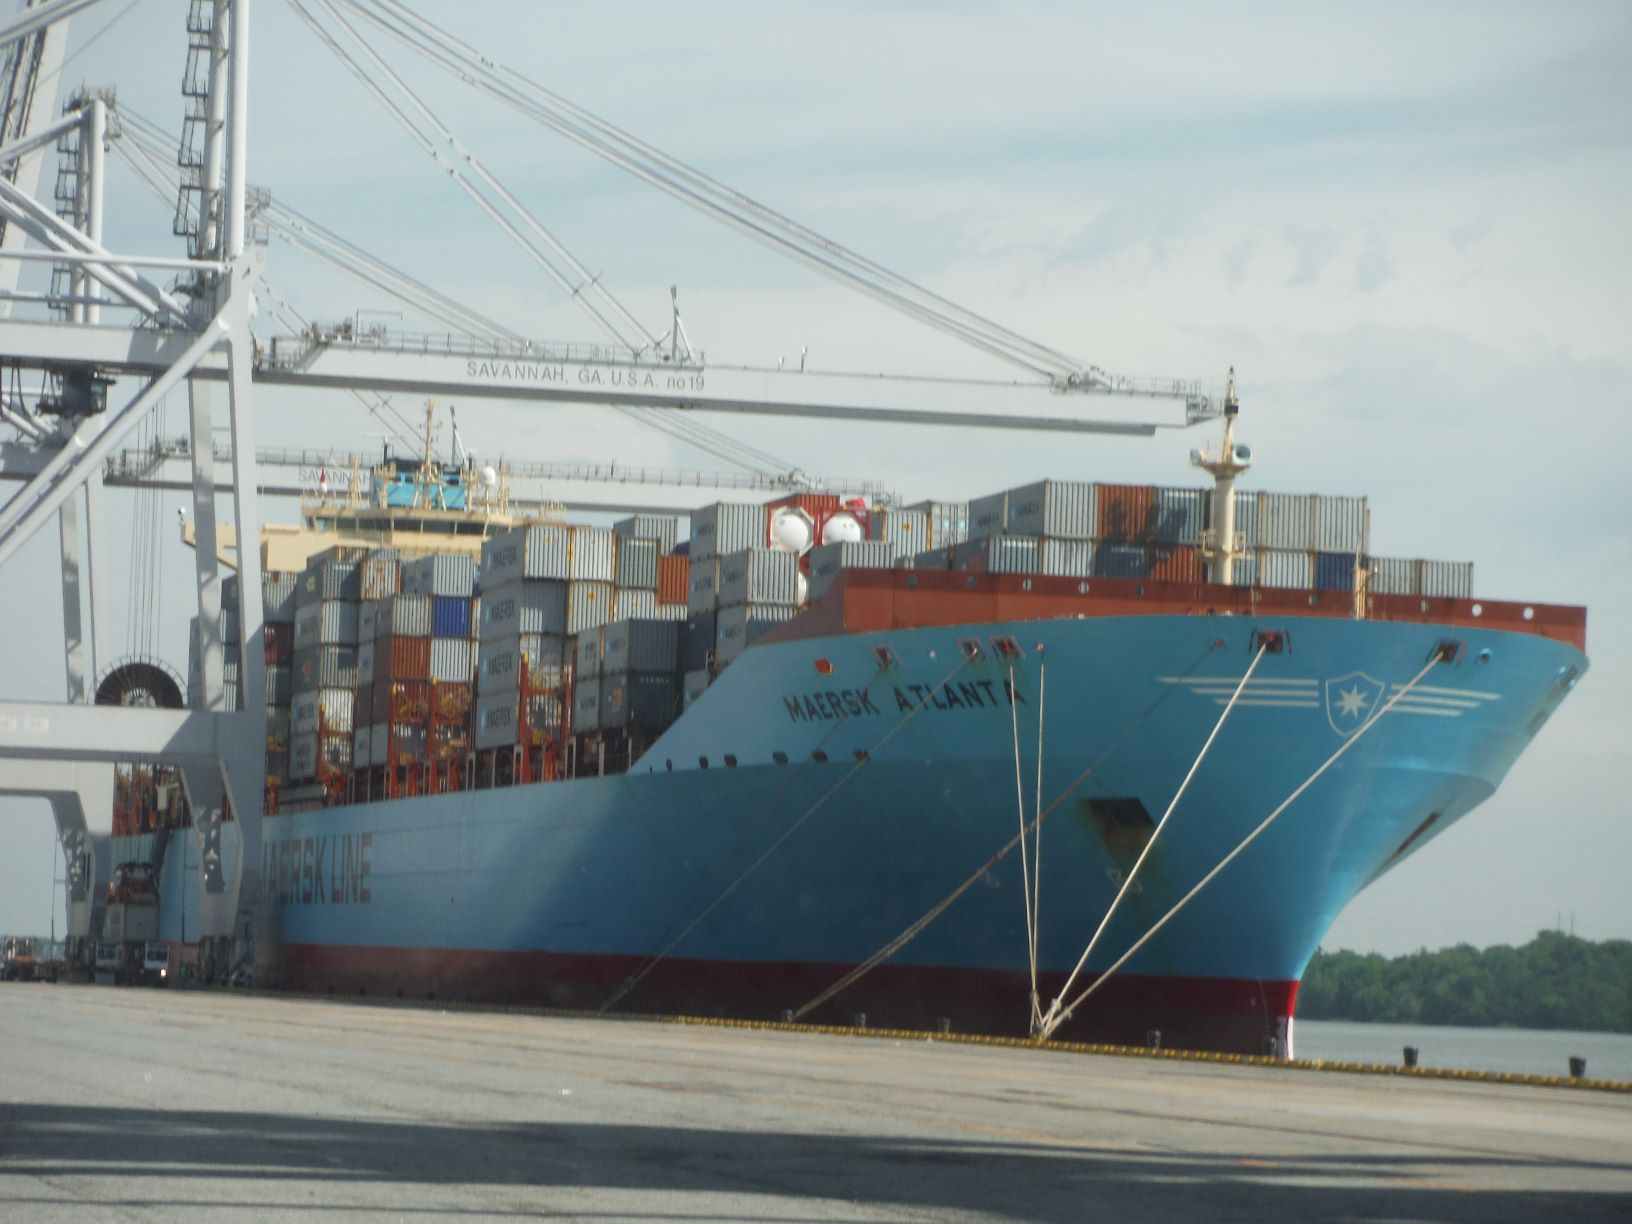
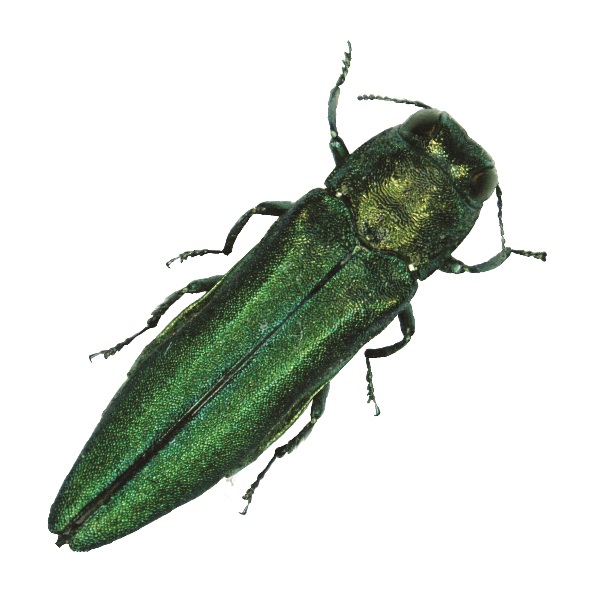
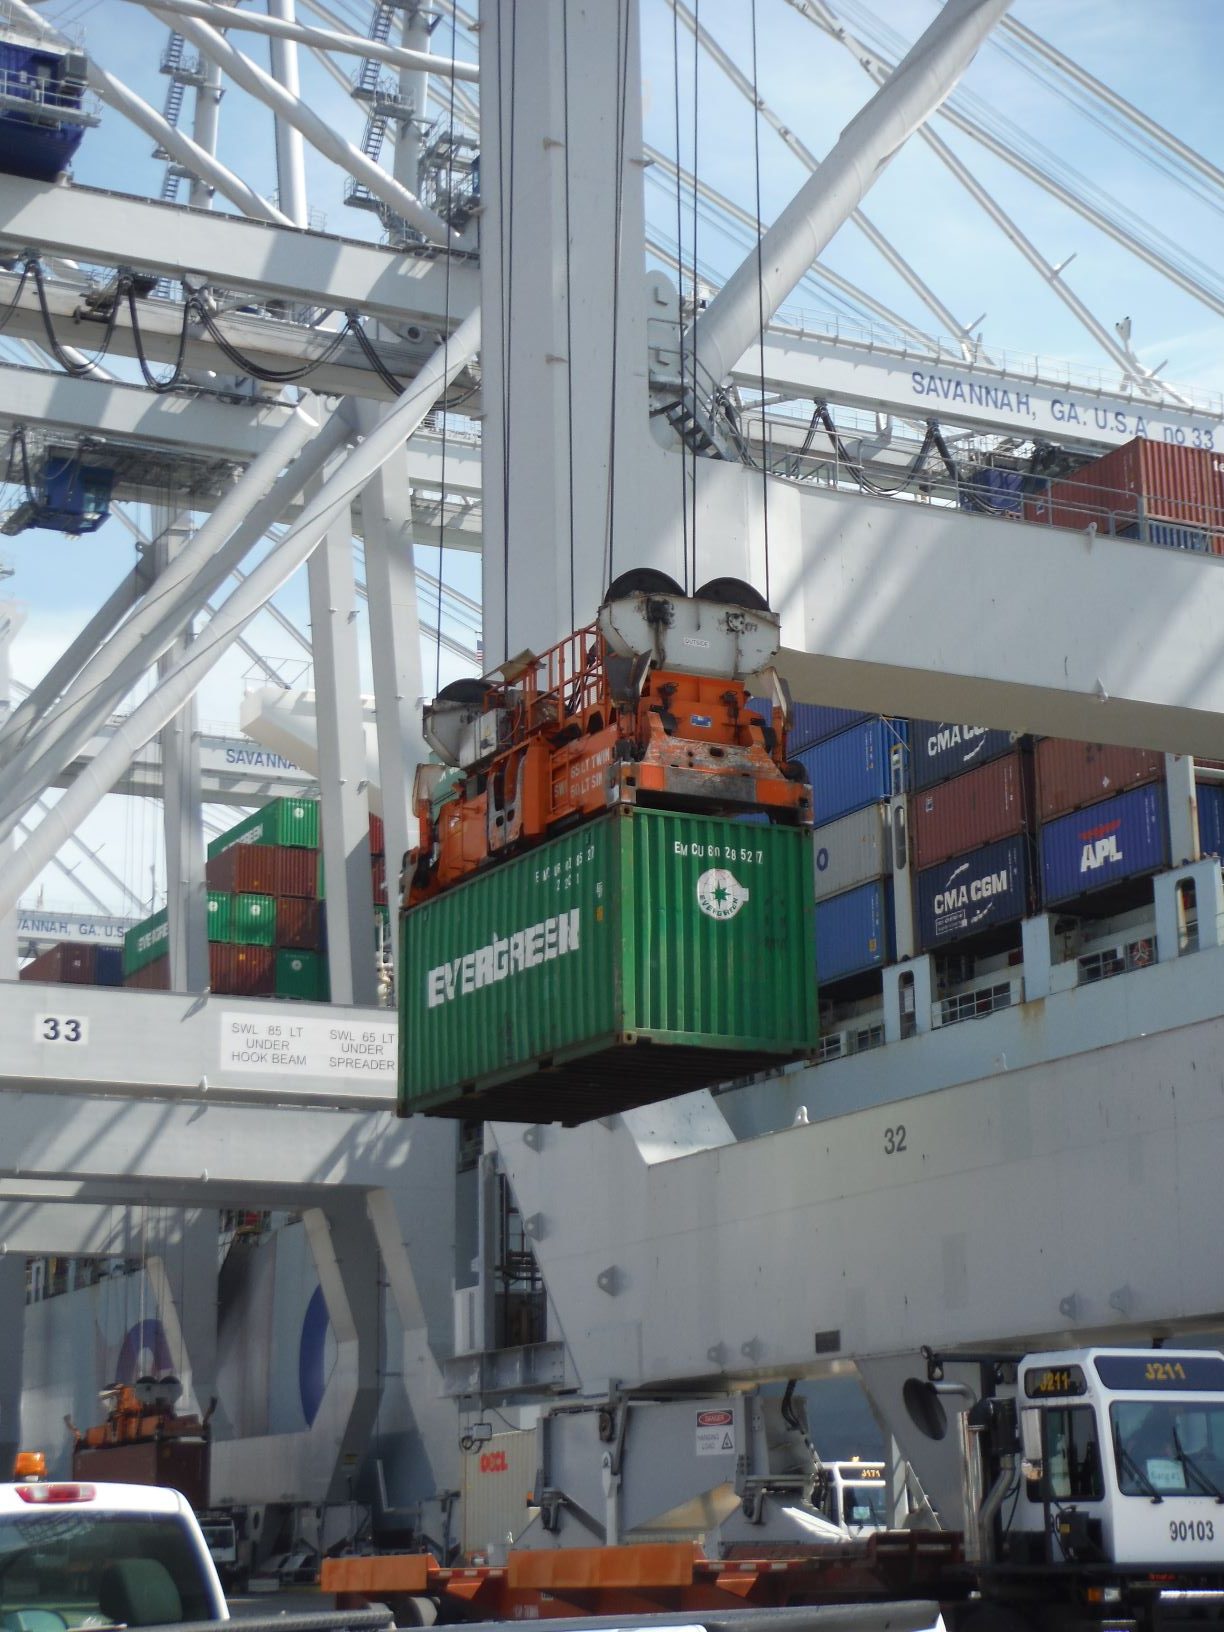
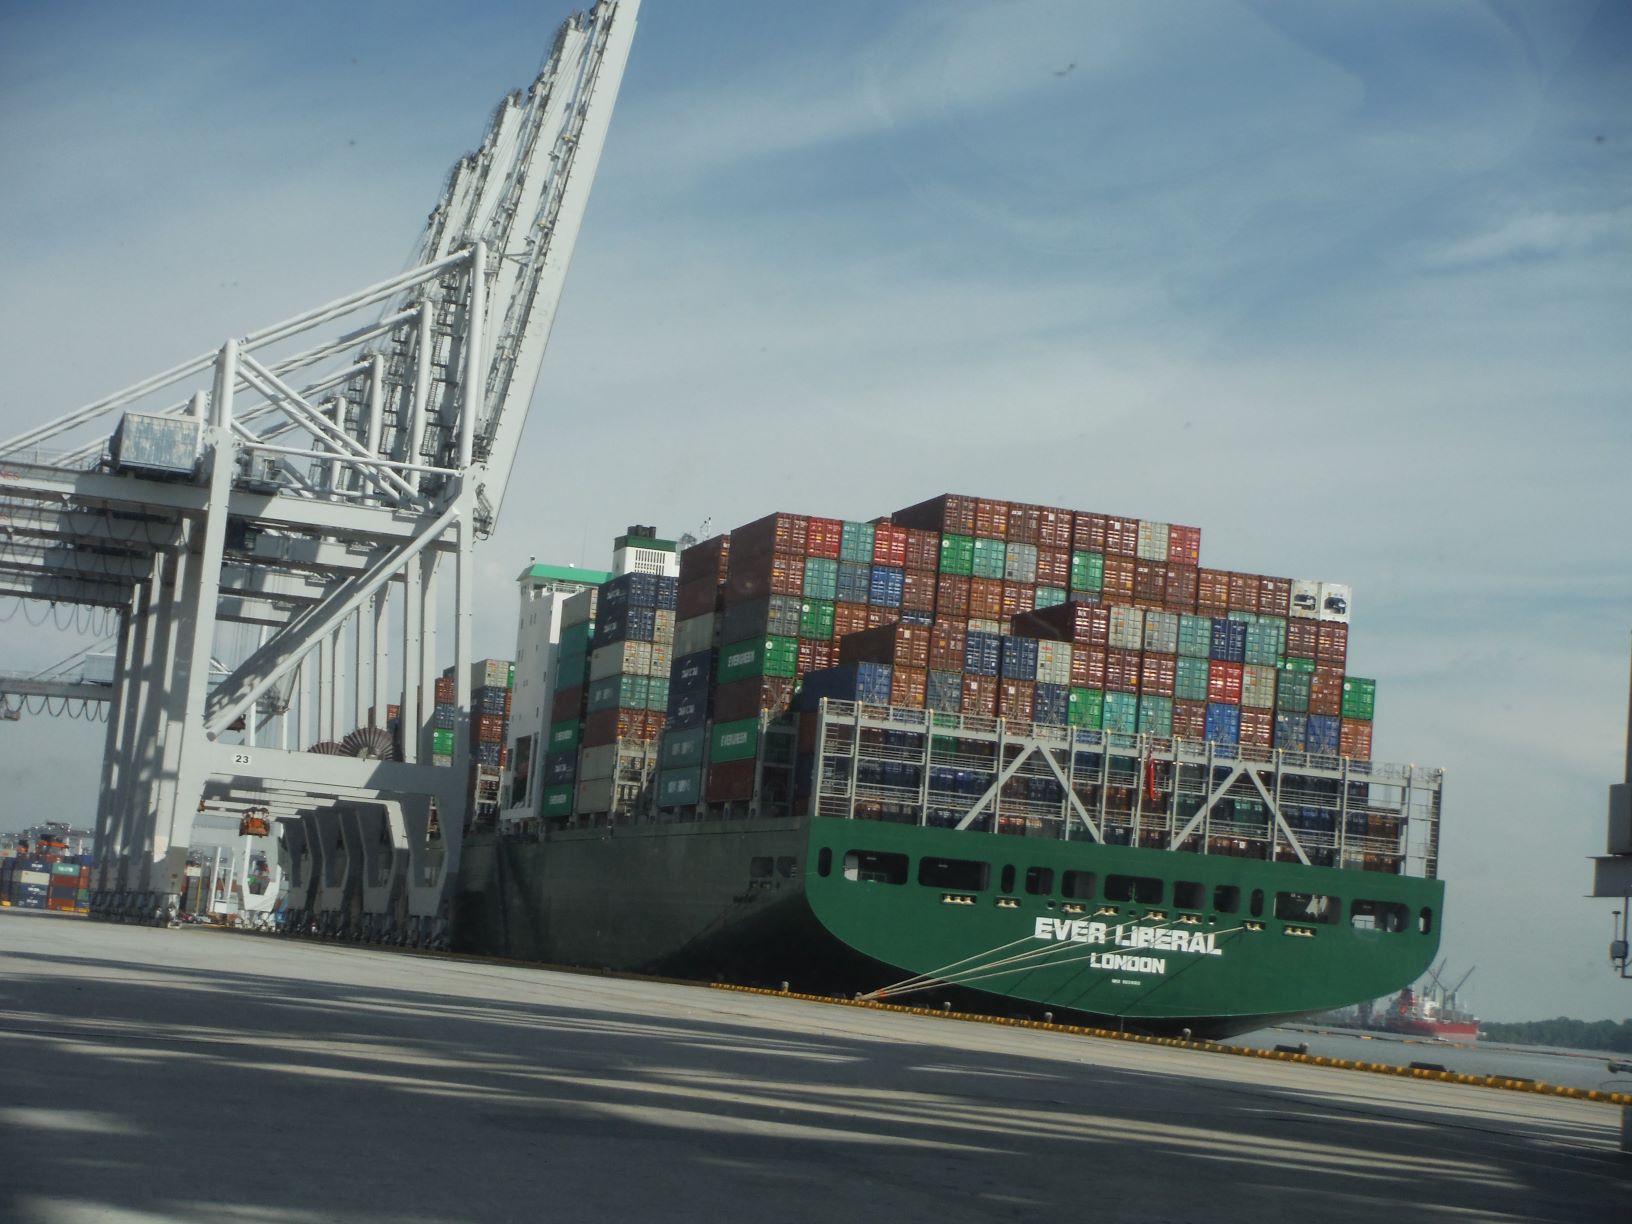
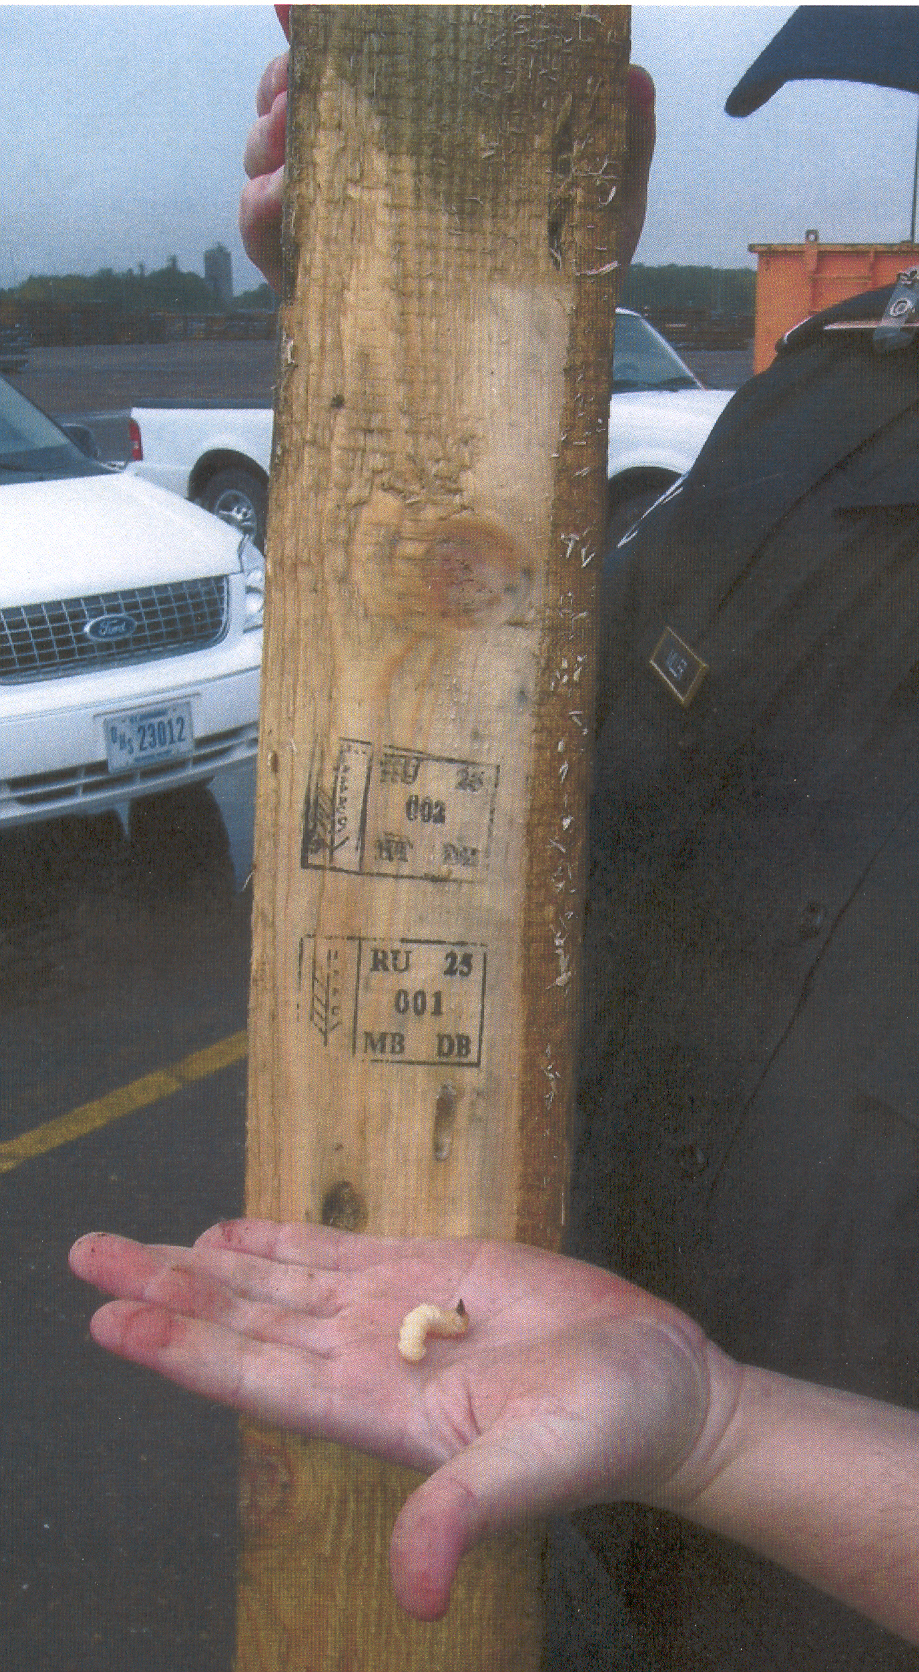
This February marks 15 years since USDA began full implementation of ISPM#15. It is 22 years since the U.S. and Canada began requiring China to treat wood packaging (in response to introductions of the Asian longhorned beetle). Nevertheless, numerous shipments containing wood packaging that does not comply with the international regulations continue to arrive at our borders – and to bring pests. During Fiscal Years 2010 through 2019, CBP detected 7,900 shipments of wood packaging that harbored a pest significant enough to be in a regulated taxonomic group. In 2020, 16.6 million TEU from Asia entered the U.S. (Mongelluzzo Jan 21). If pest approach rates are the same now as 10 years ago, perhaps 6,000 or more of these containers bore wood packaging infested by tree-killing insects.
The Bureau of Customs and Border Protection (CBP), in the Department of Homeland Security, has taken steps to strengthen its programs aimed at getting insects out of the wood packaging pathway (described here).
I wish USDA APHIS took a similarly active stance. You can help by contacting your Congressperson and senators to urge their support effective actions, such as those I suggested in my blog in January.
CPB’s 2017 Improvement
Until November 1, 2017, CBD allowed importers to escape punishment until they had been caught using wood packaging that did not comply with ISPM#15 five times in one year. On that date, CBD began issuing a penalty under Title 19 United States Code (USC) § 1595a(b) or under 19 USC § 1592 to any party responsible for a shipment with a documented wood packaging violation. At the time, I praised CBP’s action. I have tried to find out how many times over the past three years CBP has used that new provision to issue penalties, but CBP staff have not replied to my question.
CPB’s 2020 Improvement
CBD took another step forward in 2020. The agency incorporated measures to clean up solid wood packing material (SWPM) into its Customs-Trade Partnership Against Terrorism (CTPAT) program. I had been urging this since 2016. It took a while – but CBP used that time to ensure that its action would be integrated into the program and so stay in effect.
CTPAT is a voluntary public-private sector partnership engaging the principle participants in international supply chains — importers, carriers, consolidators, licensed customs brokers, and manufacturers.
By signing on, they agree to help CBP ensure the highest level of cargo security. Specifically, when an entity joins CTPAT, it agrees to work with CBP to protect the supply chain, identify security gaps, and implement specific security measures and best practices.
CTPAT member companies receive several benefits in return. Because they are considered to be of low risk, their shipments are less likely to be examined and delayed at a U.S. port of entry. When they are subjected to inspection, they go to the front of the line – again, reducing costly delays. The CTPAT web-based Portal system provides a library of training materials. (Information from the CBP website; full citation at end of the blog.)
At present, more than 11,400 certified partners have joined the program. These include U.S./Canada highway and rail carriers and Canadian manufacturers – who are not subject to the U.S.’ wood packaging regulation per se. Thus, CBD’s action seems to extend pest-prevention protection to a group of suppliers previously exempted from this phytosanitary program. Inclusion of many Mexican carriers and manufacturers is also welcome, since Mexican suppliers have always ranked high in numbers of shipments that violate the ISPM#15 requirements.
Specific Minimum Security Criteria
CBP’s action took the form of adding a long list of critical new agricultural components to the Minimum Security Criteria (MSC) it already used. These include:
- Having written procedures for both security and agricultural inspections.
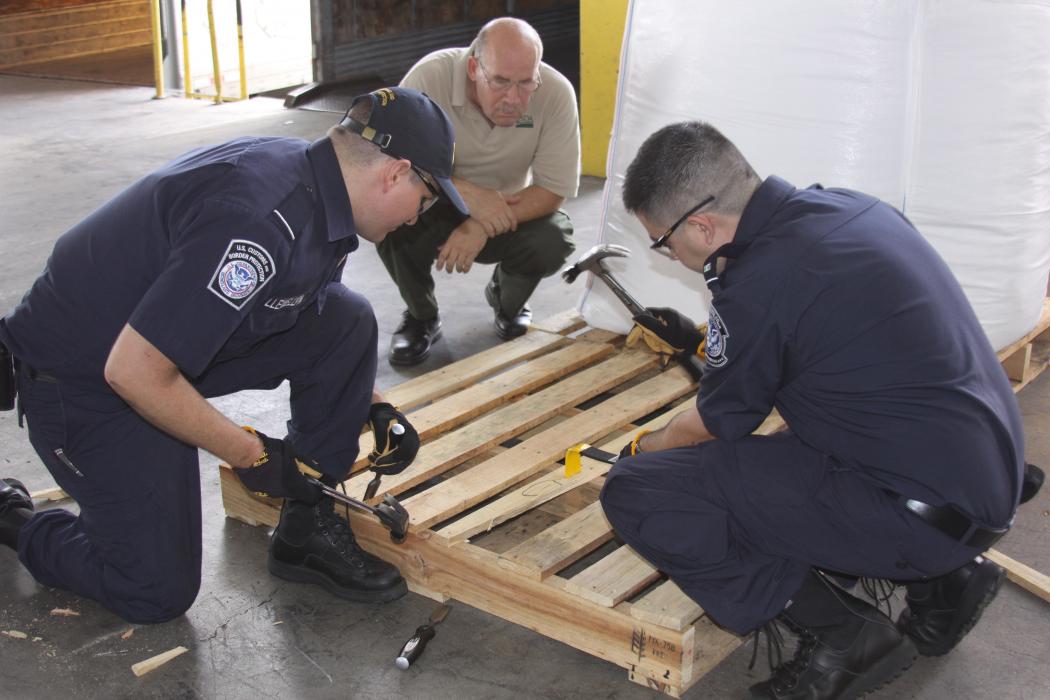
- Carrying out CTPAT approved security and agricultural inspections of all conveyances and empty Instruments of International Traffic (e.g., shipping tanks, lift vans) prior to loading. The inspection must ensure that they are not contaminated with visible agricultural pests.
- If visible pest contamination is found during the inspection, the partner business must wash or vacuum the conveyance to remove such contamination. The company must retain documentation demonstrating compliance for one year.
- Vessels that visited Asian Gypsy Moth (AGM) high-risk areas during periods when the moths are flying must present a pre-departure AGM inspection certificate from an approved entity stating that the vessel is free of AGM life stages. The AGM inspections must be performed at the regulated port as close to vessel departure time as possible. CTPAT sea carriers must provide CPB with two-year port-of-call data at least 96 hours before arrival at a U.S. port.
- Cargo staging areas, and the immediate surrounding areas, must be inspected on a regular basis to ensure these areas remain free of visible pest contamination.
- CTPAT Members must have written procedures designed to prevent visible pest contamination to include compliance with ISPM#15 regulations. Visible pest prevention measures must be adhered to throughout the supply chain.
- Members must establish and maintain a security training and awareness program to recognize and foster awareness of the security vulnerabilities to facilities, conveyances, and cargo at each point in the supply chain. The training program must be comprehensive and cover all of CTPAT’s security requirements. Personnel in sensitive positions must receive additional specialized training geared toward the responsibilities that the position holds.
- Drivers and other personnel that conduct security and agricultural inspections of empty conveyances and Instruments of International Traffic (IIT) must be trained to inspect their conveyances/IIT for both security and agricultural purposes.
- Training must be provided to applicable personnel on preventing visible pest contamination. Training must encompass pest prevention measures, regulatory requirements applicable to wood packaging materials, and identification of infested wood.
The actual Minimum Security Criteria can be found here.
Training Powerpoints are here.
(The summary of these criteria was provided by Stephen Brady, Senior Agriculture Operations Manager, Agriculture Programs and Trade Liaison, U.S. Customs and Border Protection.)
Inclusion of wood packaging in the CTPAT program should result in more efficient efforts to detect infested wood packaging before shipment — before the insect can reach North America. I believe it is fair to importers in that it requires action based on visible pest presence or damage. I applaud Customs and Border Protection for making the effort – internally and with the shipping industry — to add this protection.
I think fairness would be further served by CBP and APHIS adopting a program to inform importers which foreign suppliers of wood packaging have a record of providing “clean” vs. “infested” wood packaging. The U.S. importers would then be better able to avoid both contributing to the pest risk and being exposed to violation-associated delays.
SOURCES:
CBP website
Mongelluzzo, B. US imports from Asia hit record December level. Jan 19, 2021
Posted by Faith Campbell
We welcome comments that supplement or correct factual information, suggest new approaches, or promote thoughtful consideration. We post comments that disagree with us — but not those we judge to be not civil or inflammatory.
For a detailed discussion of the policies and practices that have allowed these pests to enter and spread – and that do not promote effective restoration strategies – review the Fading Forests report at http://treeimprovement.utk.edu/FadingForests.htm