SOD marches on … & questions remain on the 2019 outbreak

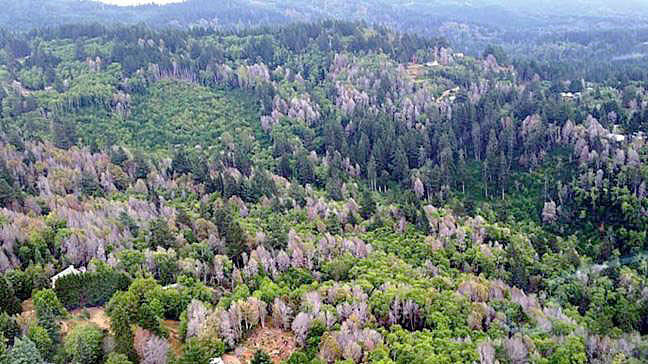
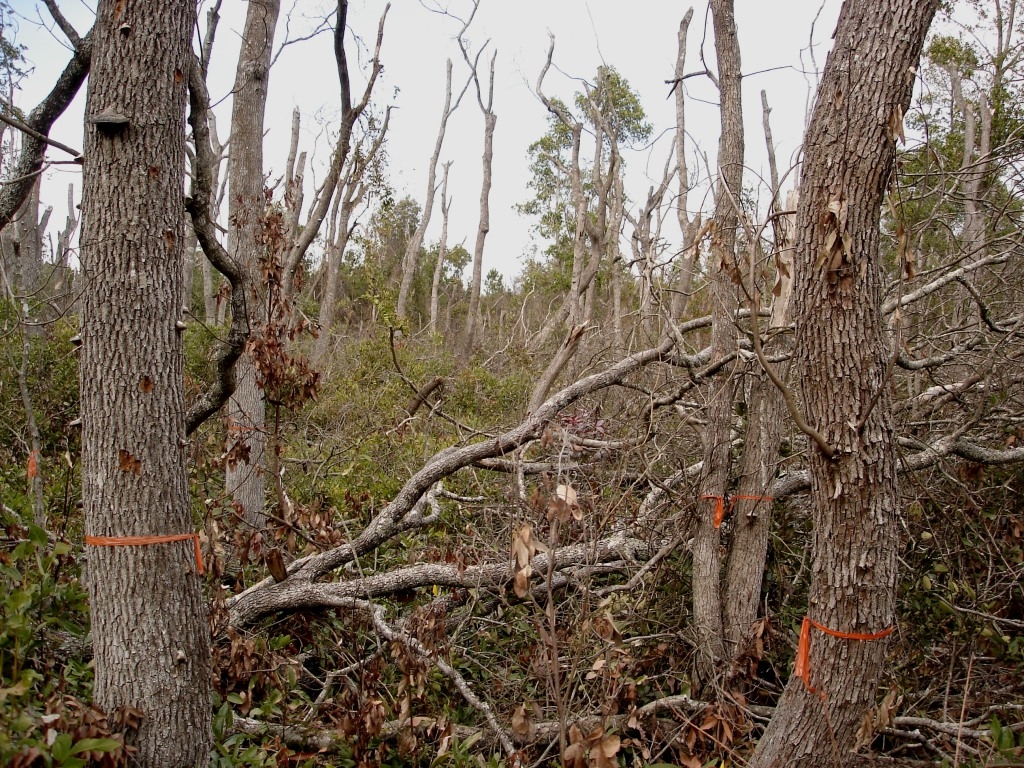
dead tanoak killed by P. ramorum in Oregon;
photo courtesy of Oregon Department of Forestry

Stunning 2019 Nursery Outbreak – Continuing Story

I have blogged often about the sudden oak death pathogen Phytophthora ramorum. The most recent blogs have focused on last year’s episode in which infected plants were sent to retail nurseries in many states. Indeed, the 2019 outbreak led to the largest trace-forward investigation for the USDA APHIS’ Phytophthora ramorum program in a single year for more than a decade. A year later, much is still unclear. For example, based on reports last year, I told you that 18 states had received positive plants. APHIS now says it was 14.

In response to states’ requests, APHIS issued a “Hotwash Report” (described in the June 2020 newsletter of the California Oak Mortality Task Force (COMTF); see source list at the end of the blog for the url). The “Hotwash Report” says APHIS traced the infected plants back to two nurseries, but I have obtained information about efforts at only one – in Washington state – and even that information is not as explicit as I think should be. In the April COMTF newsletter, the Washington State Department of Agriculture reports only that compliance surveys at one wholesale shipping nursery would be more intense than usual. I believe the second nursery implicated in the event is in British Columbia, but the Canadian Food Inspection Agency has said it saw no evidence that a Canadian nursery had shipped infected plants to the U.S.

Indiana officials reported (Press et al.) that the infected plants received in that state were of the NA2 clonal lineage. This is the first report of the NA2 lineage outside British Columbia, Washington, and California and is thus especially significant. The outbreak caused Indiana authorities to ordered destruction of more than 6,100 rhododendron plants at retail outlets in Indiana. (April COMTF newsletter)

According to the June 2020 COMTF newsletter, APHIS revised its Phytophthora ramorum Domestic Regulatory Program Manual (available here). APHIS also reviewed the protocol governing responses to detection of P. ramorum in retail nurseries (available here).  The agency also plans to carry out a full program review but no timeline has been announced. 

It is not clear to me whether these actions satisfy the states or – most importantly – address the reasons why such a large breakout of nursery infestations escaped current regulatory safeguards.

APHIS Slow Walks a Revised Host List

Meanwhile, carrying out a promise made in May 2019 when APHIS revised the SOD regulations, APHIS has posted a revised list of officially recognized P. ramorum hosts (available here). Finally! The new list replaces one from 2013.

The new list recognizes only one new species (Gaultheria procumbens, eastern teaberry) as a proven host, based on completion of Koch’s postulates. (The scientific paper was published five years ago!) So far, APHIS would only recognize a host after Koch’s postulates were completed. But the agency has been unwilling to pay for the experimental work required.

That situation might be changing: APHIS says it is reviewing scientific publications and ongoing  research. The agency also invites scientists to contact the national program manager regarding plant taxa that they believe should be added to the regulated plant taxa list.

Meanwhile, we know that scientists have completed Koch’s postulates on several new hosts: Brisbane box, Lophostemon confertus, taken from samples of street trees dying in central Sausalito, Marin Co., California (COMTF June newsletter); and seven species of Arctostaphylos (manzanita) (COMTF April newsletter). So far, there’s no word from APHIS as to if or when it might act on these.

Nursery Situation in Individual States

California

Inspections under various federal and state regulatory requirements have detected infected plants in five nurseries (COMTF June newsletter).  Two are in counties with widespread infestations that ship only within the state. Infected plants were Camellia and Loropetalum (COMTF April newsletter). Three other nurseries, also that ship within the state, tested positive only in previous years. Trace investigations completed at four of these nurseries by June had detected no additional positive plants. (COMTF June newsletter)

Oregon

Western Oregon has a climate that favors P. ramorum. One result is intensification and spread of the forest infestation (see below); another is a perpetual problem with infected nurseries.

In fall 2019, Oregon Department of Agriculture detected positive plants and soil at an interstate shipper. The plants were destroyed. Trace-back detected no further positive detections. The areas with infested soil were taped off until authorities can carry out steaming to decontaminate (COMTF April newsletter).

Meanwhile, trace-back from a previously identified retail location led to a second commercial interstate shipper. Camellia, Pieris, and Rhododendron plants tested positive, along with three soil samples and one groundwater sample. This was the first detection for this wholesale location (COMTF April newsletter).

Then, a routine inspection detected P. ramorum at a third interstate shipper in early March 2020. As of April, seven Rhododendron plants tested positive. This was also the first detection at this particular nursery (COMTF April newsletter).

Meanwhile, the spring compliance surveys at 10 Oregon nurseries that ship interstate found no P. ramorum (COMTF October newsletter).

In August, Oregon Department of Agriculture conducted soil steaming at three nurseries that previously tested positive. The action was successful at two but not at the third due to irrigation issues. APHIS and ODA are working with the nursery to create an enhanced mitigation plan focusing on irrigation at the nursery (COMTF October newsletter).

However, trouble continues. In July, a North Carolina nursery reported positive Rhododendron plants that had been purchased from an Oregon nursery. Traceback detected infected Rhododendron plants at the site. Further tracebacks have been triggered at the locations where this material was purchased – apparently yet another nursery. The nursery is undergoing the final assessment to sign a federal compliance agreement and will be added to the list of nurseries sampled by ODA in fall (COMTF October newsletter).

Washington

Washington officials continue to detect P. ramorum in water bodies that have proved difficult to trace back to a plant source. Positive water samples were collected again from the pond at the botanic garden in Kitsap County – as has been true for most years since 2015.  Despite the continuing presence of the pathogen in the pond, authorities have not been able to find infected plants in recent years, including in 2020.

Authorities also detected a water-positive at a nursery participating in the P. ramorum compliance program. They have scheduled additional vegetation and water sampling (COMTF April newsletter). It is not stated whether this is the nursery apparently responsible for the 2019 spread event.

A third positive water sample was collected on a creek in Snohomish County. The state Department of Agriculture plans to follow up with two nurseries in the drainage. One had previously tested positive (COMTF April newsletter).

In June, the state conducted a trace-forward investigation on plants from a positive out-of-state nursery. Most plants had been sold at the retail level and were untraceable. However, 37 Rhododendron planted in several residential locations were sampled; six plants at four sites were positive. The Confirmed Residential Protocol has been enacted at all four locations (COMTF August 2020). Authorities also treated the soil at two of the planting sites (COMTF October newsletter).

The Risk of New Phytophthora Introductions Is Dire

The COMTF June newsletter summarizes the findings of studies by European forest pathologists. As I reported in an earlier blog, European researcher have identified more than100 previously unknown Phytophthora species through intensive surveys conducted during 2013 – 2019 in natural ecosystems of Japan, Taiwan, Vietnam, Indonesia, Chile, Nicaragua, Panama, Curacao, Egypt and eight European countries. Overall, 13,242 isolates were obtained, which could be assigned to 65 known and 101 previously unknown species. Two of the most damaging – P. cinnamomi and P. ramorum – are most likely native to Southeast Asia. The scientists recommend extensive host-range testing of forest tree and horticultural crop species to assess the potential threat posed by the import of living plants from Southeast Asia. Several presentations and factsheets with further information may be found here. https://www.ponteproject.eu/

Early in the year, I attempted to persuade APHIS to begin studies of possible hosts’ vulnerability, but I was told that APHIS does not do research. I also approached the Agriculture Research Service and USDA Forest Service. Perhaps academic scientist could obtain funding to carry out such studies through grants funded by the Plant Pest and Disease Management and Disaster Prevention Programs (under Section 7721 of the Plant Protection Act) or National Institute of Food and Agriculture.

Wildland Infestations – Threat to native plants; interactions with fire

The COMTF April 2020 newsletter reports the growing threat to manzanitas from P. ramorum. The genus Arctostaphylos includes more than 100 species of evergreen shrubs and small trees. Nearly half are classified as rare, threatened, or endangered. The center of diversity is in the San Francisco area – which overlaps with the area intensely infested by P. ramorum. At least 18 manzanita species support the pathogen. Koch’s postulates have been completed on seven of the most recently detected hosts, and are under way for two others. I am grateful to the California Department of Food and Agriculture for carrying out these studies; without them, APHIS would not recognize the plants’ host status. (Despite requiring completion of Koch’s postulates, APHIS does not fund these studies.)

A study of the interaction between P. ramorum and fire in California (October COMTF newsletter and Simler-Williamson et al.) found that frequently-burned forests were less likely to be invaded by the pathogen, had lower incidence of host infection, and lower occurrence and density of epidemiologically-significant hosts. The authors think that the fire-caused loss of tall, mature California bay laurel trees might temporarily dampen pathogen transmission and “release” susceptible species from significant inoculum pressure.

The June COMTF newsletter reports that the forest infestation in Oregon continues to spread. During spring 2020, Oregon detected 15 new P. ramorum infestations at or beyond the Oregon Generally Infested Area (GIA). The October newsletter reports that 38 stream drainages both inside and outside the SOD quarantine area were baited, and one at the northern boundary of the quarantine area was positive for P. ramorum. The Oregon Department of Forestry installed additional stream baits in the drainage to pinpoint the infestation, and plans a stream survey for the area. Planned eradication efforts have been impeded by funding cuts caused by Covid-19-related falls in tax receipts.

Posted by Faith Campbell

We welcome comments that supplement or correct factual information, suggest new approaches, or promote thoughtful consideration. We post comments that disagree with us — but not those we judge to be not civil or inflammatory.

For a detailed discussion of the policies and practices that have allowed these pests to enter and spread – and that do not promote effective restoration strategies – review the Fading Forests report at http://treeimprovement.utk.edu/FadingForests.htm
SOURCES

California Oak Mortality Task Force (COMTF newsletters) – archive of 2020 newsletters at https://www.suddenoakdeath.org/library/newsletter-archive/

Press, C.; Fieland, V.; Creswell, T.; Bonkowski, J.; Miles, L. and Grünwald, N.J. 2020 (First Look). First report of the NA2 clonal lineage of Phytophthora ramorum in Indiana. Plant Disease. https://doi.org/10.1094/PDIS-12-19-2543-PDN.

Simler-Williamson, A.B.; Metz, M.R.; Frangioso, K.M. and Rizzo, D.M. 2020. Wildfire alters the disturbance impacts of an emerging forest disease via changes to host occurrence and demographic structure. Journal of Ecology. Early View. https://doi.org/10.1111/1365-2745.13495

Pests Associated with Imports: Rising Risk for Gulf States

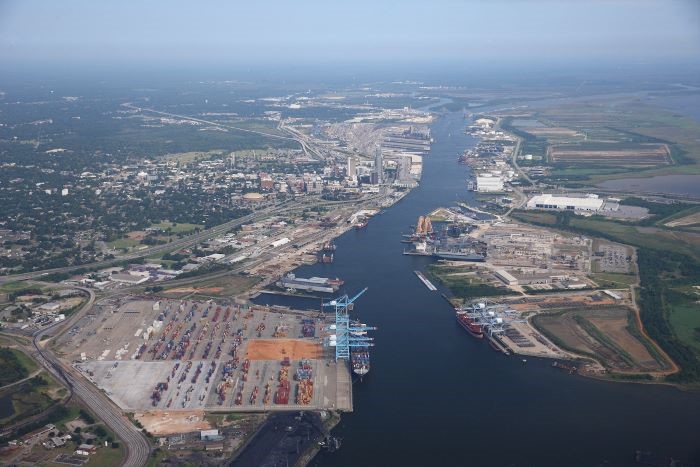
Port of Mobile, Alabama Photo by Port of Mobile Authority

In August and September I blogged about the rapid increase in volumes of imports from Asia, especially China, in 2020. At the time, the information available to me focused on the Pacific coast ports, especially Long Beach and Los Angeles.

In the earlier blogs, I mentioned three concerns:

1.  Had the collapse in trade and travel during spring 2020 so reduced user fees that Department of Homeland Security Bureau of Customs and Border Protection (CBP) had to furlough Agriculture Quarantine Inspectors?  AQI inspections provide important incentives for importers to follow U.S. and international rules to reduce the risk that pests will be present in imports, for example, in wood packaging. 

2. The list of imports from China in the first half of 2020 includes $1 billion worth of nursery stock. This is down about 7% from 2019. However, from the perspective of preventing plant diseases and pests, these imports continue to be high risk and are still not adequately addressed by U.S. policy.

3. Other Asian regions are gaining in import share. Thus we can expect to see more pests arriving from countries other than China, like Vietnam.  

Cutbacks in Numbers of Inspectors?

CBP staff have told me that they are shifting AQI inspectors from covering incoming passengers – which are still far fewer than before the Pandemic – to inspecting cargo. By doing so, CBP has avoided cutting back on the total number of inspections of imported goods and associated wood packaging.

This is fortunate since Congress has not passed a new Covid-19 financing bill that might have included an increase in the appropriation for DHS CBP. The Continuing Resolution currently in effect funds the government only until December 11. So we have another chance to ask for an increase in appropriated funds for CBP (and APHIS!) for the remainder of Fiscal Year 2021 (which ends on October 1, 2021).

Volumes of Imports from Asia – Especially China  

As I reported in the earlier blog, while U.S. imports from China declined significantly in 2019  and early 2020 compared to earlier years, by the summer imports had rebounded — more than doubled (by value) between March and July.

Shifts in U.S. Ports

According to the Journal of Commerce, there is a gradual shift away from the twin ports of Los Angeles and Long Beach in the proportion of imported goods entering the country.  LA-LB handled 37.7% of the loaded twenty-foot equivalent containers (TEUs) entering the United States in 2018. This fell to 33.5% in July 2020. The initial reason was a decrease in imports from East Asia (including China, Hong Kong, Japan, South Korea, and Taiwan) compared to Southeast Asia, Europe, then South America and, finally, South Asia (primarily India).

Other source regions – e.g., the Caribbean, Middle East, Pacific, Africa, and Atlantic – were all below 2% of total numbers of TEU in all three years, and changed minimally over this period.

Another reason for the shift in ports utilized by importers is congestion and delays at North American Pacific coast ports, especially Los Angeles-Long Beach. U.S. imports from Asia moving through LA-LB increased 22% in both September and August from the same months last year – 828,880 TEU in September after 832,210 TEU in August.

Congestion is also a problem at the Canadian ports of Vancouver and Prince Rupert – which have actually seen small decreases in numbers of incoming containers.

One result is a small but significant shift to Gulf Coast ports, which have become more accessible through the widening of the Panama Canal in 2016. Before the Canal was widened, these ports handled less than 3% of total US imports from Asia. In the first nine months of 2020, US Gulf ports handled 608,387 TEU from Asia – or 5.2% of total US imports from Asia. This was a 5% increase from the same period last year.

These ports, stretching from Houston to Tampa, benefit from easy and relatively cheap rail transport to inland U.S. and even Canadian cities. Another factor is the heavy presence of Walmart – which has major distribution centers in Mobile and Houston.

The Gulf coast ports are expected to expand their importance as gateways for Asian imports as ocean carriers add more capacity between the two regions and ports upgrade and expand. New Orleans and Houston plan major expansions. Port Tampa Bay notes its proximity to markets around the Southeast. Already, import volumes into Tampa during the first nine months of 2020 were nearly double the prior year’s level. Tampa hopes to double its capacity over the next five years.

U.S. imports from Asia in October were 22.6% higher than a year ago. Imports through the East and Gulf coast ports jumped 14.6% and 48.4% from September 2020. Houston and Baltimore saw the greatest increases since September. There were also shifts in Pacific ports. Still, the Los Angeles-Long Beach port complex handled 49% of total US imports from Asia in October 2020.

Pest Risks to the Gulf Coast from Southeast Asia

Rising volumes of imports into the Gulf Coast present new opportunities for non-native insects and pathogens. The warm, wet climate of the region might be far more suitable to some insects and pathogens from tropical and subtropical Asia than the dry climate of southern California (except for areas that are irrigated artificially, such as golf courses, parks, and plant nurseries!).

redbay grove killed by laurel wilt; Photo by Scott Cameron

Already, the redbay ambrosia beetle and its associated pathogenic fungus has decimated native redbay and swamp bay trees and now threatens sassafras (see write-up under the “invasive species” tab here.)

Another Southeast Asian ambrosia beetle – the polyphagous shot hole borer with its associated pathogenic fungus – might also find the Gulf Coast states more inviting than southern California. In California, it is causing the greatest damage to trees that are artificially irrigated. Numerous tree species native to or grown in the Gulf states are known hosts, e.g., box elder, sweetgum, and southern magnolia. (PSHB is described under the “invasive species” tab here.) Both ambrosia beetles apparently were introduced via wood packaging material.

Southeast Asia is also the place of origin of other pathogens which – in this case – would more probably be introduced on imported plants rather than wood. These include the numerous species of Phytophthora recently detected in Vietnam.

As this region receives more goods from Asia, and as those goods arrive more rapidly so more likely to arrive alive, it is imperative that all stakeholders increase their vigilance to detect new invaders. And that they join others pressing for improved policies aimed at preventing introductions.

Posted by Faith Campbell

We welcome comments that supplement or correct factual information, suggest new approaches, or promote thoughtful consideration. We post comments that disagree with us — but not those we judge to be not civil or inflammatory.

For a detailed discussion of the policies and practices that have allowed these pests to enter and spread – and that do not promote effective restoration strategies – review the Fading Forests report here.

Projection: Alien Species Introductions Will Keep Going Up! Especially Arthropods!

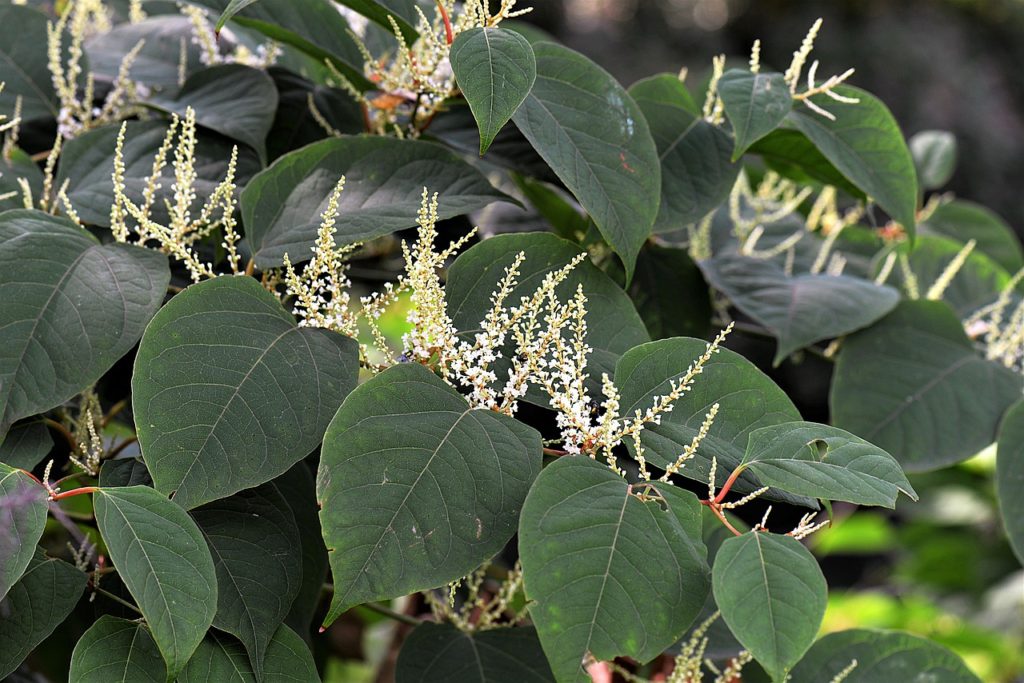
Japanese knotweed

In 2017 I blogged about a study by Hanno Seebens and 44 coauthors that showed that the rate of new introductions of alien species has risen rapidly since about 1800 – and showed no sign of slowing down (a reference to the full article is at the end of this blog). Here’s a brief recap, followed by a 2020 update by Seebens and colleagues.

In 2017, Seebens et al. analyzed a database covering 45,813 first records of 16,926 alien species established in 282 distinct geographic regions. The year with the highest number of reported new detections was 1996 – 585, or an average of more than 1.5 sightings per day.

The authors found that the adoption of national and international biosecurity measures during the 20th Century had slowed introductions – but not sufficiently. Numbers of reported new introductions of fish and mammals had decreased since the early 1950s. However, first recorded introductions of vascular plant species remained high, and introductions of birds and reptiles also continued to rise, largely as pets in countries with strengthening economies.

For taxa introduced primarily accidentally on transport vectors or as contaminants of commodities (e.g., algae, insects, crustaceans, molluscs and other invertebrates), they found a strong correlation between their spread and the market value of goods imported into the region of interest – existing biosecurity regimes had not slowed down the accumulation of these alien taxa.

As a consequence, the authors expected that the numbers of new alien species would continue to increase.

As you are aware, since 2015 I have posted 15 blogs about the continued detections of tree pests in wood packaging, which remains one of the major pathways despite the international regulation ISPM#15. I have found it harder to track insect and pathogen introductions on imported plants, but it surely continues apace.

2020 Study Projects Continuing Rise in Introductions, Especially Arthropods 

Hanno Seebens and a smaller set of coauthors (see full reference at the end of this blog) have now produced an estimate of probable introduction rates in the future.  They looked at taxon–continent combinations for seven major taxonomic groups and eight continents (excluding Antarctica).

They found an overall increase in established alien species between 2005 and 2050 of 36%.

The study predicted that by the mid-21st Century, there will be distinct increases in alien species numbers, particularly for Europe, but also for Temperate Asia and North America, and for invertebrates in all regions. Europe ranked highest in absolute numbers of new alien species (~2,543; a 64% increase). Temperate Asia was projected to receive about 1,597 species (a 50% increase); North America about 1,484 (a 23% increase); South America about 1,391 (a 49% increase); and the Pacific Islands about 132. Only Australasia could expect a slower rise in introductions. The predicted trajectories of alien species numbers were surprisingly similar for mainland and island regions across taxonomic groups.

Invertebrates showed the highest relative increases. Rates of new detections of alien species were projected to accelerate for arthropods other than crustaceans worldwide, especially for North America (!). The study also projected higher relative increases for aquatic vascular plants and terrestrial insects

All drivers of introduction and invasion are predicted to intensify in the future. This is despite adoption of increasing numbers of countermeasures in recent decades. Most countries’ capacity to proactively counter the rising tide of invasive species is still poor. Furthermore, the principal drivers – intensification of trade and transport, land-use change, and access to new source pools – is expected to continue operating as now – “business as usual”.

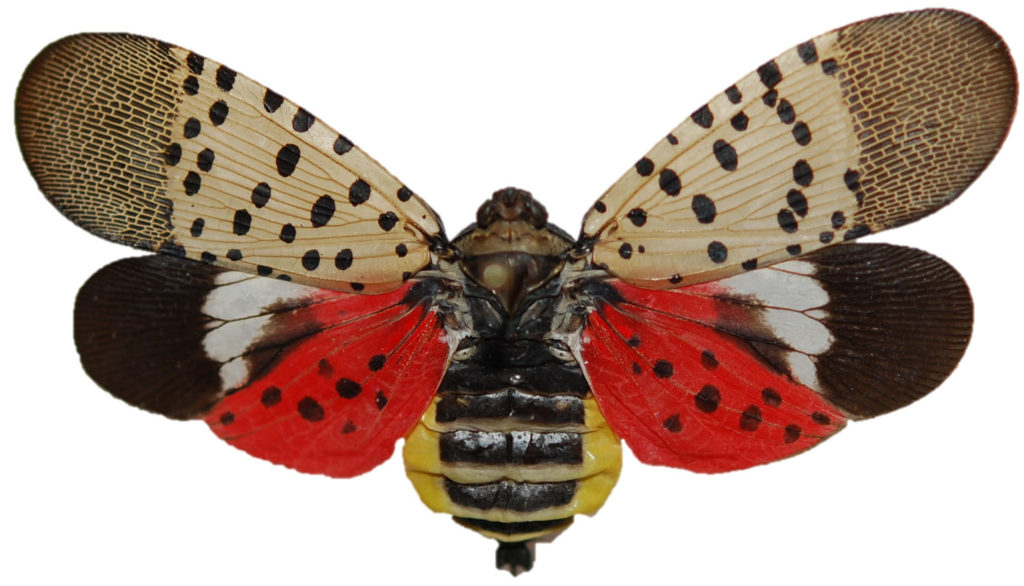
spotted lanternfly Holly Ragusa, Pennsylvania Department of Agriculture

Current Status of “New” Detections

Seebens et al. (2020) relied on the Alien Species First Records Database for first detection records up to 2005. More than half (54%) of the first-detection records in the database are vascular plants. Arthropods other than crustaceans made up 28% of the total, birds 6%, fishes 4%, mammals 3%, molluscs 2%, and crustaceans 2%. The 2020 study confirmed the earlier finding that the observed first-record rates of mammals changed at around 1950 from an increasing to a decreasing trend. Finally, the total numbers of non-native species in the Database is much lower in aquatic habitats. (The authors do not discuss whether this reflects actual introductions or gaps in reporting.)

In the database, Europe recorded 38% of all first records, North America 16%, Australasia 15%, South America 9%, Temperate Asia 9%, Africa 6%, Pacific Islands 5% and Tropical Asia 2%.

A comparison to the immediate past (1960-2005) showed that the rates of emerging non-native species were projected to accelerate during 2005-2050, especially for arthropods. As I noted above, North America is predicted to have high increases in absolute numbers. Increases are also predicted for birds. Declines are predicted for mammals and fishes.  

Asian giant hornet; photo from University of Florida Department of Entomology

Projected increases for Australasia were consistently lower than in the past.          

Caveats:

1) The authors assumed that past patterns of alien species accumulation will continue in the future. They did not attempt to predict efforts to strengthen biosecurity regulations and mitigation strategies.  

2) Projections were calculated in the absence of data on many underlying drivers for the historic periods and some taxonomic groups. However, observed trends of newly-detected alien species numbers during the 20th century were surprisingly stable despite distinct political and socio-economic changes.

Seebens and colleagues conclude that implementation of targeted biosecurity efforts can reduce the numbers of new alien species becoming established. However, a significant decrease in rates of alien species numbers on a large scale can only be achieved by a coordinated effort that crosses political borders.

SOURCES

Seebens et al.  2017. No saturation in the accumulation of alien species worldwide available (free access!) at https://www.nature.com/articles/ncomms14435

Seebens, H., S. Bacher, T.M. Blackburn, C. Capinha, W. Dawson, S. Dullinger, P. Genovesi, P.E. Hulme, M. van Kleunen, I. Kühn, J.M. Jeschke, B. Lenzner, A.M. Liebhold, Z. Pattison, J. Perg, P. Pyšek, M. Winter, F. Essl. 2020. Projecting the continental accumulation of alien species through to 2050. Global Change Biology. 2020;00:1 -13 https://onlinelibrary.wiley.com/doi/10.1111/gcb.15333


Posted by Faith Campbell

We welcome comments that supplement or correct factual information, suggest new approaches, or promote thoughtful consideration. We post comments that disagree with us — but not those we judge to be not civil or inflammatory.

For a detailed discussion of the policies and practices that have allowed these pests to enter and spread – and that do not promote effective restoration strategies – review the Fading Forests report at http://treeimprovement.utk.edu/FadingForests.htm
Ash Mortality Accelerates – Population Regeneration Will Not Reverse Collapse

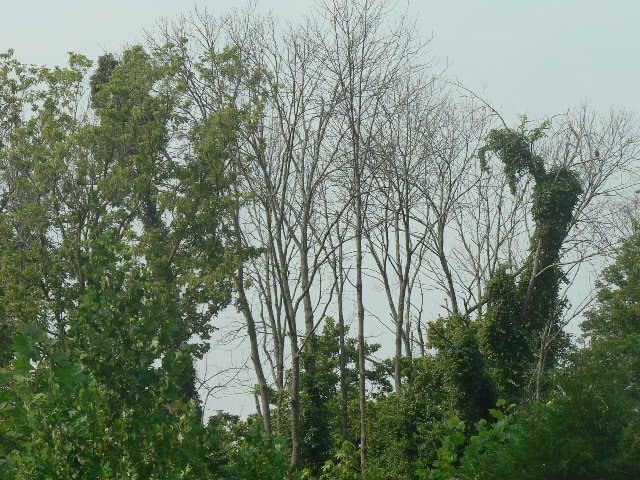
dead ash along Accotink Creek, Fairfax County, Virginia photo by F.T. Campbell

As we all know, the emerald ash borer (EAB) has killed millions of ash trees in its invaded range across eastern North America. However, field studies have detected robust regeneration of ash seedlings and saplings in various invaded areas. Ward et al. 2021 (full citation at end of blog) set out to determine whether this regeneration will result in recovery of mature ashes that can perform their ecological role. They conclude that it will not. Instead, they say, the EAB invasion will probably alter successional patterns and composition of large areas of naturally regenerating forests, causing a cascade of ecological impacts in ash-containing ecosystems

Ward and colleagues used USDA Forest Service Forest Inventory and Analysis (FIA data) to quantify ash recruitment and regeneration across the entire eastern United States. Theirs is the first study to evaluate trends across the region, rather than specific locations or stands. They related the FIA recruitment data to EAB spread, as measured by USDA Animal and Plant Health Inspection Service’ (APHIS) record of the first EAB detection in each county.

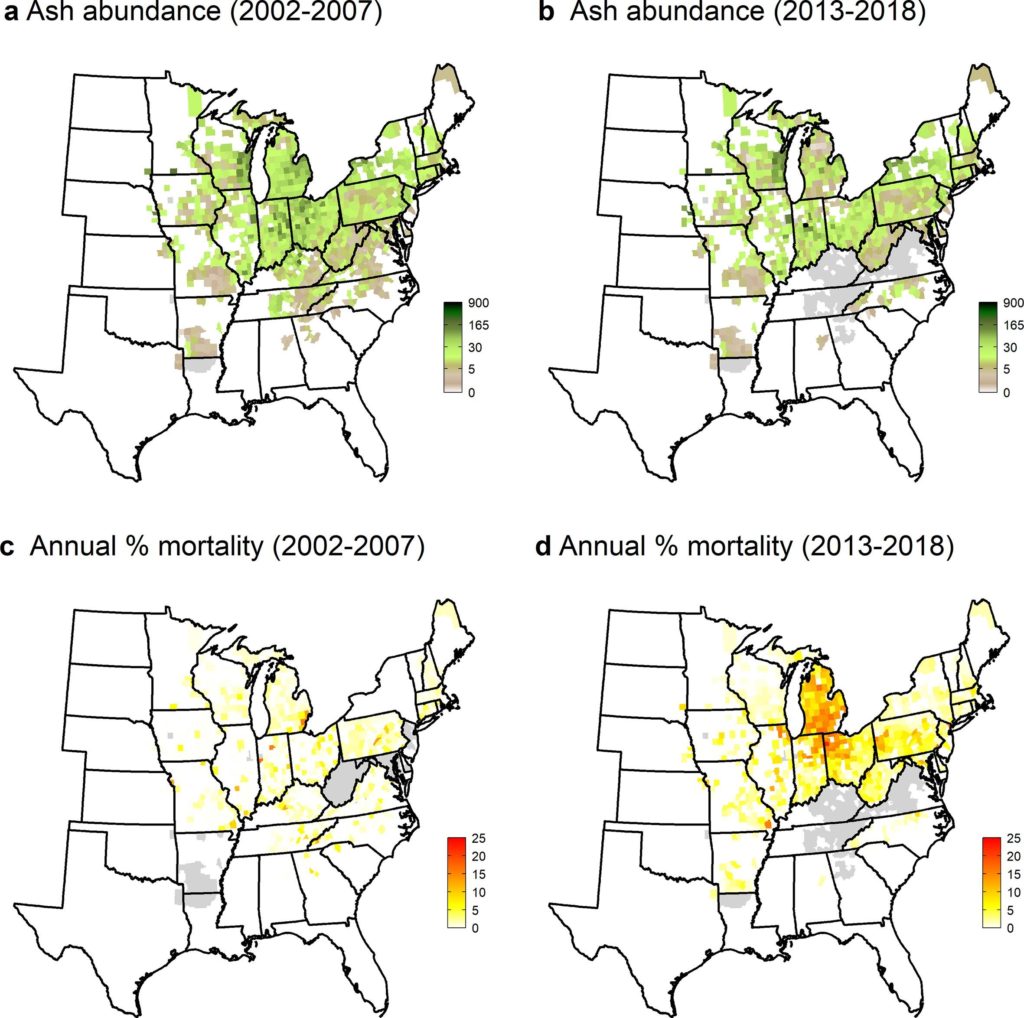
FIA inventories in 2002-2007 and 2013-2018 show large numbers of ash seedlings and saplings in counties invaded in the first wave of invasion, 2002–2006. These areas had higher densities of both seedlings and saplings than plots in other counties. The earliest-invaded counties were in areas that had extraordinarily high densities of ash before the EAB invasion, so the numbers of seedlings and saplings probably reflected that abundant seed source.

However, by the 2013-2018 inventory ash trees in the smallest overstory class (12.7 cm dbh) were dying at faster rates than they were recruited from seedlings or saplings in all 362 counties recorded by APHIS as EAB-infested before 2013. Ward and colleagues found these negative population trajectories on plots that have been invaded for more than about 10 years. This trend suggests that ash will continue to decline in abundance and may become functionally extinct across the invaded range.

Some U.S. Forest Service biologists are more optimistic about ash recovery in response to biocontrol of the EAB. See their podcast here.

In the risk of functional extinction, ash trees are unfortunately not unique. The authors note similar impacts from the invasion of the hemlock woolly adelgid and beech bark disease.

Data Reveal History of Invasion (spread)

Ward and colleagues focused on the risk of mortality for young ashes as they developed from seedlings to saplings, and, eventually, to overstory trees. The youngest “overstory” trees are 12.7 to 17 cm dbh. FIA data show that even the largest trees in this class are 3 cm smaller than trees that produce seeds.

Mortality was initially uniformly low – less than 2.1% — as measured by the first FIA inventory (2002–2007). This is not surprising because EAB was detected only in 2002, and then in only few counties. (EAB had probably been present for a decade before it was detected.)

By the 2013-2018 FIA inventory, mortality had quadrupled to 8–11% in counties invaded during the 2002–2006 period. In the counties invaded during the 2007–2012 period, morality also rose to 3-5%. Both measurements included all diameter classes. Annual mortality rates in the FIA 2013-2018 inventory were still highest for the counties invaded during 2002–2006 except for the largest trees (those greater than 40 cm dbh). By the time of the 2013-2018 FIA survey, overstory ash densities near the epicenter had since declined substantially. They had been nearly eliminated in some counties in southeastern Michigan. There were still sufficient numbers of smaller trees in the region to exhibit an elevated mortality rate – more than 10% per year in several counties in Michigan, Indian, and Ohio. By contrast, in the most recently invaded areas – those counties recorded by APHIS as infested after 2013 – there was very little change in ash densities compared to the 2002-2007 period. This is hardly surprising since it takes years for mortality to reach levels observable by the FIA process.

dead ash on edge of Pohick Bay, Fairfax County, Virginia photo by F.T. Campbell

Considering trees just entering the overstory category (those with diameters of 12.7 cm dbh), annual mortality increased substantially across the region. Between the first FIA inventory (conducted in 2002-2007) and the second inventory (conducted in 2013-2018), their average annual mortality rose more than four-fold, from 0.08 trees per ha to 0.37 trees per ha. By 2013-2018, recruitment in the 2002–2006 invasion cohort was about 50% less than tree mortality levels; recruitment and mortality were about equivalent for the counties invaded in the 2007–2012 period. Recruitment was [still] significantly higher than mortality for the counties recorded as invaded in 2013–2018. However, Ward and colleagues expect mortality rates of this cohort to accelerate over the next five to 10 years – even in areas with lower ash densities.

Ward and colleagues note that many of the young ash trees were dying before they could reach reproductive age – which they estimated to be about 20 years with a dbh of about 20 cm.

As the invasion progresses and hosts are depleted, mortality rates could slow, but, for ash to persist, it is critical that sufficient numbers of trees reach reproductive age before succumbing to residual EAB populations.

Other factors that might influence ash include competition with trees in other genera. The biocontrol agents now becoming established in young ash forests might increase the likelihood of ash persistence. Still, seed production and seedling survival will need to be frequent and widespread if they are to offset expected mortality. Resilience might also vary depending on individual species’ vulnerability to changes in the climate and to EAB (green and black ash are more vulnerable than white ash).

SOURCE

Ward, S.F., A.M. Liebhold, R.S. Morin, S. Fei. 2021. Population dynamics of ash across the eastern USA following invasion by emerald ash borer. Forest Ecology and Management 479 (2021) 118574

Posted by Faith Campbell

We welcome comments that supplement or correct factual information, suggest new approaches, or promote thoughtful consideration. We post comments that disagree with us — but not those we judge to be not civil or inflammatory.

For a detailed discussion of the policies and practices that have allowed these pests to enter and spread – and that do not promote effective restoration strategies – review the Fading Forests report at http://treeimprovement.utk.edu/FadingForests.htm
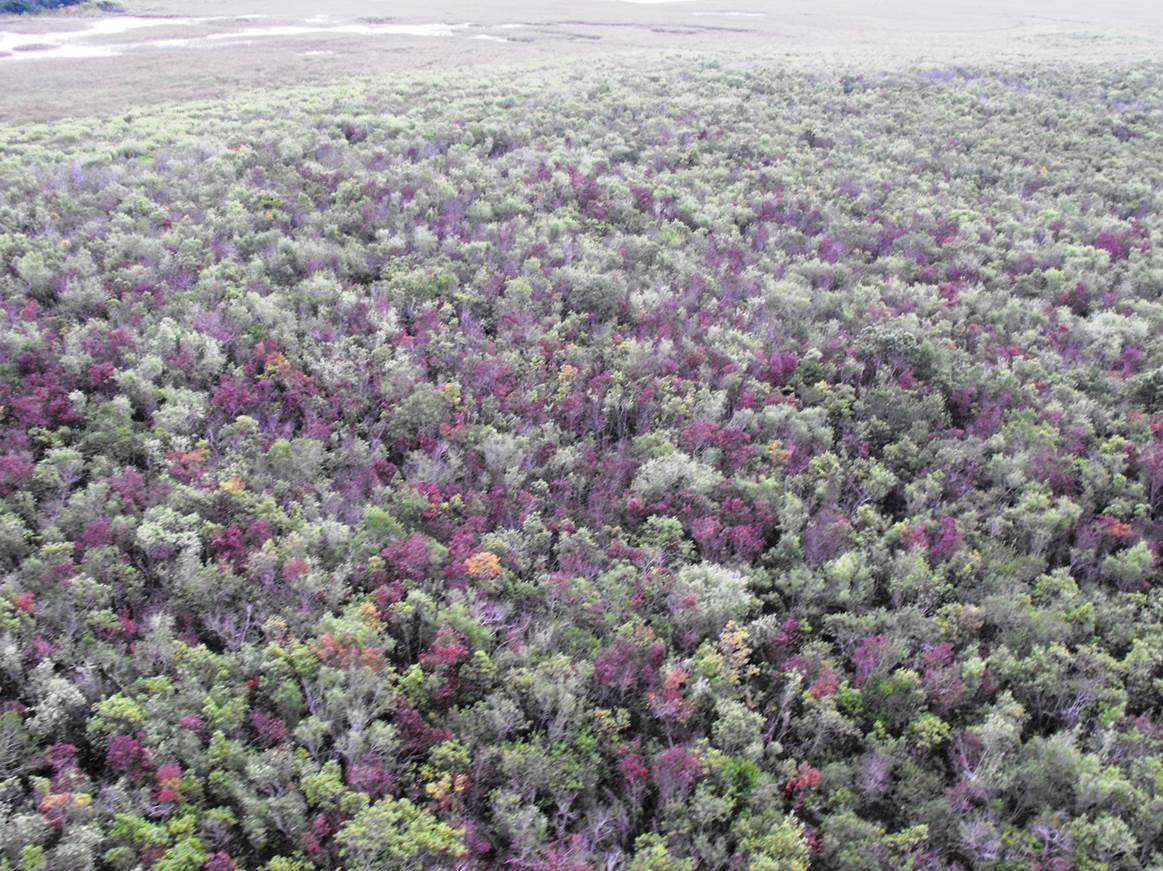
Asian giant hornet – US & Canada Differ – What are the Implications? – Updated!

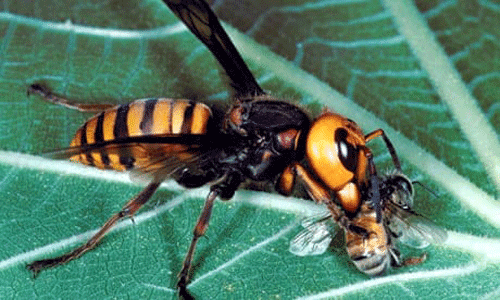
Asian giant hornet; photo from University of Florida Department of Entomology

Asian giant hornet (AGH) (Vespa mandarinia) is the world’s largest hornet, reaching sizes of 1.5 – 2 inches long. Its native range includes much of Asia. While media attention has focused on the hornet’s frightening size, the real threat is to honey bees (Apis spp.) and – especially – to the many important crops that bees pollinate.

Over the past year or so, several detections of the Asian giant hornet have been found in the Pacific Northwest – in British Columbia and Washington State. Four of the sites are within a few miles of each other. Two others are separated by miles of open water from the mainland sites. As of mid-October, 18 hornets had been detected in Washington State.

USDA’s Animal and Plant Health Inspection Service (APHIS) has partnered with the Washington Department of Agriculture to try to eradicate the hornet – which will not be easy! However, the Canadian Food Inspection Service (CFIA) has decided not to designate the hornet as a quarantine pest. This decision seems to threaten divergent approaches to the bioinvader. Fortunately, the Province of British Columbia is trying to eradicate its populations – so perhaps the diverging federal approaches will not result in facilitating the hornet’s establishment and spread.

Where the Hornet Is Known to Be

The first detected outbreak of the Asian giant hornet was in Nanaimo, British Columbia – on Vancouver Island. A single hornet was detected in August 2019. [A Canadian commenter said in March 2021 that this turned out to be a different species, V. soror.] A nest was detected in September and destroyed by local beekeepers and BC government officials. However, another hornet was found on the mainland – in White Rock, B.C. – in November 2019 [CFIA Decision Document]. In 2020, there have been several unconfirmed sightings in the Cowichan Valley on Vancouver Island (van Westendorp, pers. comm.).

Meanwhile, beekeepers discovered two AGH outbreaks in Whatcom County, WA, on the U.S. side of the border. These discoveries were in December 2019 and May 2020. There were other, unconfirmed reports in both Washington and British Columbia. [USDA APHIS Environmental Assessment (EA)] Indeed, later in 2020, Washington reported a few more sightings — in the Birch Bay area, just south of Blaine and at a site about eight miles east of Blaine (van Westendorp, pers. comm.)

Three of the hornets found in spring 2020 were mated queens (Zhu et al. 2020), which means at least one colony successfully reproduced last year. One of the mated queens was the second detection in Whatcom County – in Custer, Washington. One article said that the locations of this spring’s queens meant either that the new queens travelled up to 35 kilometres (about 22 miles) before founding their nests or that they came from more than one colony. Either way, it probably means that giant hornets could spread faster than initially thought.

White Rock, BC and Blaine, Washington are a few miles apart on the Canada-U.S. border. Langley is 12 miles to the northeast of White Rock – in the Fraser Valley. Custer is 7 miles southeast of Blaine. Birch Bay is 5 miles south of Blaine. The most recent detection is 8 miles east of Blaine. So all these detections are in close proximity and might represent spread from a single introduction site – or maybe not!

Nanaimo and the Cowichan Valley are on Vancouver Island, which is separated from the other locations by a significant distance and open water. The two island sites are about 30 miles apart. They surely represent one or more separate introductions.

One study found that a single hornet collected from Blaine, Washington differed genetically from  a single hornet collected at Nanaimo on Vancouver Island. This suggests separate introductions. However, too little is known about the hornet’s genetic variability across Asia to allow conclusions about possibly separate origins (van Westendorp, pers. comm.; Wilson et al. 2020).

Areas at Risk

The area at risk is potentially much broader than the Pacific Northwest. APHIS’ initial analyses, based on plant hardiness zones, indicated that the hornet could thrive in virtually all the lower 48 states. APHIS’s Environmental Assessment did not address vulnerable areas in Canada or – apparently – in Hawai`i.

Zhu et al. (2020) carried out an assessment of areas most at risk and the hornet’s potential rate of spread. They found that areas with warm to cool annual mean temperature, high precipitation, and high human activity were most likely to be suitable for the hornet. Areas meeting these criteria are found across western and eastern North America, Europe, northwestern and southeastern South America, central Africa, eastern Australia, and New Zealand. Most of central North America and California are less suitable.

Spread could be rapid in the Pacific Northwest: they predicted that the hornet could reach Oregon in 10 years, eastern Washington and British Columbia within 20 years. This prediction is based in part by experience with the invasive congener V. velutina in Europe; it has expanded by 78 km/year in France, 18 km/year in Italy.

Oregon is relying on beekeepers to detect the hornet, which they expect will arrive even earlier than 10 years from now. The Oregon Department of Agriculture has suffered severe budget cuts because of the Covid-19 crash in state tax collections, so the program is trying to save money. As of the beginning of October, none of the hundreds of citizen reports has been a Vespa of any species (J. Vlach, Oregon Department of Agriculture, pers. comm).

Pathways of Introduction

It is not known how the hornet reached North America. Reports from other countries indicate that they can hitchhike in shipments of empty plant containers, or in the straw in which the containers are packed. In addition, some Asian cultures regard the hornets as delicacies, so deliberate importation is possible. Both APHIS and the Canadian Food Inspection Agency (CFIA) have intercepted such shipments (CFIA Decision document; USDA APHIS PPQ New Pest Response).

The Threat

The AGH typically feeds on a variety of terrestrial invertebrates including beetles, mantids, caterpillars, and spiders (EA). During the spring and summer, hornets attack their prey singly. However, in the Aautumn, hornet workers carry out mass attacks against other social Hymenoptera – including other species of Vespa, yellowjackets (Vespula spp.), various paper wasps (Polistes spp.), and honey bees (Apis spp.). Commercial honeybee colonies are typically lost when attacked en masse. They are especially vulnerable because they are more concentrated than wild bee colonies. [EA]

Commercial honeybee colonies pollinate a wide variety of crops, including tree fruits, cane fruits (berries), tree nuts, tomatoes, and even potatoes. Supplies of beef and milk might also be at risk because alfalfa hay is pollinated by bees. Of course, honey production would also be threatened. As USDA APHIS has stated, if the Asian giant hornet spreads it would become a new stress on top of the multiple existing causes of honeybee decline.

Also, there is a direct threat to people. The AGH has a painful sting that can result in anaphylaxis, cardiac arrest, and other complications in susceptible people. Officials emphasize that most people will not be at risk of stings. However, beekeepers are – their usual Personal Protective Equipment (PPE) is not adequate to ward off the hornet’s sting [APHIS EA & New Pest .

APHIS’ programmatic Environmental Assessment notes that the hornet might also pose a threat to vertebrates that nest in ground burrows and decayed trunks and roots near the ground. Burrows chosen by female hornets for nest construction can be surprisingly large, up to 60 cm (24 inches) in diameter. The EA notes that, in Washington State, badgers, marmots, ground squirrels, and other small mammals use dens or burrows. Among these, four pocket gophers and the American wolverine are federally listed under the Endangered Species Act in Washington State. [For a list, see the environmental assessment.] The EA does not discuss whether cavity-nesting birds might also be affected – although the hornets do prefer hollows near or at ground level. The authors of the EA expect vertebrates to abandon any burrows used by the hornet, so they would be displaced rather than harmed by pesticides applied by the program described below.  

APHIS program

APHIS and the Washington State Department of Agriculture (WSDA) have begun an eradication program. I think eradication will be challenging because it will be very difficult both to find nests and to destroy them.

  • Hornets nest typically in forested areas or urban green spaces. There are lots of suitable places in the Pacific Northwest! These wooded areas are interspersed with farms, orchards, and settlements that will provide vulnerable insects as food sources.  
  • Nest destruction involves excavating a hole two meters by two meters. This digging must be in woodlands, often right next to trees.

The key to successful eradication is finding and destroying the nests before they produce reproductive females and males – in autumn. Nest detection will be carried out as follows [EA]:

  • Starting in April, the agencies bottle traps in trees near the 2019 detection points. The traps are baited with a solution of rice cooking wine and orange juice to attract the worker bees. (The rice wine is added to discourage honeybees from visiting the trap.)  Traps catches help define areas where nests are located.

WSDA successfully tracked radio-tagged workers to a nest in mid-October. That nest was in a tree hollow, not underground.

WSDA scientists think there were approximately 200 queens in that single nest. Two were vacuumed out during the initial extraction. Inside the nest they found 76 emergent queens and 108 capped cells with pupae that they believe were also queens. Three more queens were trapped in a bucket of water. This nest had approximately 776 cells; large nests can have up to 4,000.  WSDA believes there are other nests in the area; they continue to search.

APHIS’ original plan to use pesticides to kill hornets in the nest has been dropped. Washington plans now to use vacuum extraction followed by introduction of CO2 and excavation of the nest.  Washington has also not decided whether to deploy traps with the pesticide fipronil (S. Spichiger, pers. comm.)

WSDA has also asked members of the public to set out homemade hornet traps, and to report any suspicious sightings.

Canada Takes Opposite Tack

The Canadian Food Inspection Agency (CFIA) announced in February 2020 (CFIA Decision Document) that it will not attempt to regulate the Asian giant hornet as a quarantine pest for Canada. Therefore, CFIA will place no restrictions on the import or movement of any commodities that may harbor the Asian giant hornet. CFIA will, however, require permits for deliberate importation of the hornets.

CFIA’s reasoning appears to focus on two factors:

  • The hornet is an indirect threat to plant health (since AGH attacks pollinators. CFIA has traditionally regulated quarantine pests based primarily on significant direct threats to plant health.
  • Under the international phytosanitary system, countries that designate an organism to be a quarantine pest must put in place the necessary measures to prevent its entry into the country, as well as officially control the pest when present. CFIA states that “High uncertainties about the pathways of entry puts into question the ability to manage this risk, and ultimately the ability and feasibility of regulating V. mandarinia as a quarantine pest.”

Neither APHIS nor CFIA has authority to regulate threats to human health.

Detection and Eradication Efforts in British Columbia  (information from van Westendorp, British Columbia Ministry of Agriculture)

In 2020, British Columbia has focused on detection surveillance. Target areas include vicinity of Nanaimo on Vancouver Island; Fraser Valley from White Rock in the West to Langley/Aldergrove in the East (along the US border); and after several credible (but non-verified) sightings, the Cowichan Valley on Vancouver Island. Because of resource limits, the surveillance effort has sought to engage local governments, border agencies, First Nations, forestry & mining companies, farmers, and beekeepers.  The ministry also placed numerous bottle traps and encouraged 170 beekeepers in the Fraser Valley to install and monitor traps in their apiaries. 

So far, only one AGH specimen has been sighted or collected in the three British Columbia survey areas during 2020 – the single specimen at Langley detected in May. However, the several detections along the U.S. side of the border (see above on recent detections) has spurred BC officials to intensify survey efforts in the Fraser Valley (van Westendorp). A specimen was collected adjacent to the US border in mid-October just north of the multiple detections in the US, and South of the Langley detection last spring (S. Spicher, pers. comm.).

British Columbia will continue to monitor well into the fall season and resume our surveillance in 2021 and 2022 (van Westendorp).

Hornets are clearly able to be transported and introduced. Vespa ducalis was detected in Vancouver, BC in 2019 and in Texas in 2020. Vespa velutina has become established in Europe (J. Vlach, Oregon Department of Agriculture, pers. comm).

SOURCES

CFIA Decision document: Vespa mandarinia (Asian giant hornet) February 2020. https://www.inspection.gc.ca/plant-health/plant-pests-invasive-species/insects/asian-giant-hornet/decision-document/eng/1593718645505/1593718645899

USDA APHIS Asian Giant Hornet Control Program in Washington State Final Environmental Assessment—July 2020

USDA AHIS PPQ New Pest Response

van Westendorp, Paul. British Columbia Ministry of Agriculture, pers. comm.

Wilson, T.M., J. Takahashi, S-Erik Spichiger, I. Kim, and P. van Westendorp. 2020. First Reports of Vespa mandarinia (Hymenoptera: Vespidae) in North America Represent Two Separate Maternal Lineages in WA State, US, and BC, Canada. Annals of the Entomological Society of America · October 2020

Zhu, G., J. Gutierrez Illan, C. Looney, and D.W. Crowder. 2020. Assessing the ecological niche and invasion potential of the Asian giant hornet. PNAS Latest Articles ECOLOGY

Reminder: comment on ALB EA

Reminder: Friday is the deadline for commenting on APHIS’ draft environmental assessment for the Asian longhorned beetle eradication program in South Carolina. Comments should be submitted at https://beta.regulations.gov/commenton/APHIS-2020-0086-0001

The draft EA can be downloaded from https://www.aphis.usda.gov/aphis/newsroom/federal-register-posts/sa_by_date/sa-2020/alb-draft-ea

The Center for Invasive Species Prevention submitted comments that supported the eradication effort because of the well-documented threat that the ALB poses to the forests of North America. We also supported the preferred alternative in the EA.

However, we found the environmental assessment (EA) to be deficient in several ways:

  • the EA does not identify the host species present in the program area – not even of the 5,800 trees inspected by the program as of mid-August.
  • the EA provides no estimate of the proportion of deciduous trees and shrubs in the area that are host species. Conifers dominate the area. This means that any fauna dependent on deciduous trees and shrubs for food and shelter already contend with limited resources. Consequently, while we concur with the EA that any impacts will be localized, they might be exacerbated by the relative rarity of hardwood species in the local area. It is particularly important that the EA address this question since the Programmatic EIS was written under the assumption that forests at risk to the ALB are like those in the Northeast and Midwest, where hardwoods dominate.

Without knowing the proportion of deciduous flora comprised of host species, no one can evaluate the amount of wildlife food that could be removed or treated by pesticides. Some wildlife species are potentially vulnerable, including those that feed on pollen and nectar (i.e., bees and other pollinators) and those that feed on insects and other invertebrates. The latter include two species listed federally as threatened species: the frosted flatwood salamander (Ambystoma cingulatum) and northern long-eared bat (Myotis septentrionalis). Also vulnerable are birds, 96% of which feed their young on insects and other invertebrates. I worry about sublethal effects and possible bioaccumulation. Aquatic organisms, especially invertebrates, might also be affected.

The information gaps in the EA highlight weaknesses in the Programmatic EIS, on which it relies. The most important gap is the dearth of pesticide dose/mortality data for terrestrial amphibians. Apparently, EPA has not required such studies before approving pesticides. 

Posted by Faith Campbell

We welcome comments that supplement or correct factual information, suggest new approaches, or promote thoughtful consideration. We post comments that disagree with us — but not those we judge to be not civil or inflammatory.

For a detailed discussion of the policies and practices that have allowed these pests to enter and spread – and that do not promote effective restoration strategies – review the Fading Forests report at http://treeimprovement.utk.edu/FadingForests.htm
APHIS Drops the Ball on China’s Wood Packaging

APHIS has apparently passed up an opportunity to pressure China to clean up its wood packaging – although China ranks among the countries that most often violates ISPM#15 and sends wood packaging infested by quarantine pests. (See the blogs under the category “wood packaging” on this site.)

In May, a large delegation of APHIS employees met (virtually) with an equally large delegation of its Chinese counterpart to negotiate “technical protocols” linked to the Phase 1 trade agreement with China. The focus of the negotiations was on Chinese phytosanitary barriers that block exports of US products to China.

The two countries have now signed technical protocols to allow the United States to export to China a wide range of commodities estimated to be worth between $700 million and $760 million annually when the agreement is fully implemented. These commodities include barley for processing, hay, some fruits (blueberries, avocados, nectarines), almond meal, and chipping potatoes.

Some of the agreements cap years of effort. The example cited is chipping potatoes. Negotiations continue on some other U.S. exports to China, including logs.

An article in APHIS’ online newsletter reports that “On the import side, we are working on the requirements for China’s requested commodities….” Presumably these would be exports to the U.S. The examples listed were all fruits.

US & Chinese delegations (APHIS photo)

 I inquired whether wood packaging was part of the negotiation.

Andrea B. Simao, Assistant Deputy Administrator and Director of PPQ’s Phytosanitary Issues Management unit, replied that SWPM was not raised “since there has [sic] not been significant issues.”
Instead, she detailed efforts in the ongoing negotiations to persuade China that U.S. phytosanitary treatments are sufficient to control various pathogens in logs: oak wilt, phosphine on conifers, pinewood nematode.

Apparently the focus was fully on US exports and nobody raised US concerns about the risks of imports from China. This approach fits the Administration’s emphasis on exporting agricultural commodities to China. However, this is not reality. Over the past five years, I have frequently cited USDA’s own data – which demonstrate the likelihood that wood packaging will transport tree-killing pests from China to the U.S.

APHIS PPQ Deputy Administrator Osama El-Lissy & Chinese counterpart Li Jainwei sign agreement (APHIS photo)

Please inform your Member of Congress and Senators (or candidates for House or Senate) about how you feel about this failure of USDA to protect America’s natural resources. We must raise the political heat in order to pressure USDA into placing as high a priority on protecting US natural resources as it does on supporting agricultural exports.

Posted by Faith Campbell

We welcome comments that supplement or correct factual information, suggest new approaches, or promote thoughtful consideration. We post comments that disagree with us — but not those we judge to be not civil or inflammatory.

For a detailed discussion of the policies and practices that have allowed these pests to enter and spread – and that do not promote effective restoration strategies – review the Fading Forests report at http://treeimprovement.utk.edu/FadingForests.htm
Correcting Problems that Allow Woodborers to Enter – What We Can Do

U.S. phytosanitary policy is set by politicians – the Secretary of Agriculture, trade officials, and members of the House and Senate. Elected or appointed state officials determine how aggressively trees are protected in their jurisdictions. To fix the problems, those politicians need to hear from those of us who know about the pest risk associated with wood packaging and other imports. 

Politics is how our country makes important decisions. And in politics, the squeaky wheel gets the grease.

Election seasons provide opportunities to raise issues. Politicians pay more attention to constituents’ concerns when they are courting our votes.

Further, if new people take up positions in January (whether elected or appointed), they will be more open to learning about issues new to them than were the people who have occupied an office for some time.

These messages need to be repeated periodically. Proctor and Gamble does not make its profits by asking us to buy their toothpaste once a year. We cannot duplicate a major corporation’s advertising budget – but we can speak up!

  1. Tell your member of Congress and senators that you are worried that our trees are still being put at risk by insects arriving in wood packaging or diseases being spread by shipments of plants. Ask them to urge the USDA Secretary to take action to curtail introductions of additional tree-killing pests.
  2. Ask your friends and neighbors to join you in communicating these concerns to their Congressional representatives and senators.
  3. If you are a member of an association – a scientific or professional society, an environmental advocacy group, a homeowners’ association – ask your association and fellow members to join you in communicating these concerns to their Congressional representatives and senators.
  4. Write letters to the editors of your local newspaper or TV news station. 

What should we say?

Our goal should be to hold foreign suppliers responsible for complying with ISPM#15. Here are five pieces of a comprehensive approach. It is best to advocate for all. However, if you feel more comfortable focusing on one or two specific actions, please do so!

1) One approach is to penalize violators. APHIS should:

  • Fine an importer for each new shipment found to be out of compliance with ISPM#15 in those cases where the foreign supplier of that shipment has a record of repeated violations.
  • Prohibit imports in packaging made from solid wood (boards, 4 x 4s, etc.) from foreign suppliers that have a record of repeated violations.

Allow continued imports from those same suppliers as long as they are contained in other types of packaging materials, including plastic, metals, fiberboards.

APHIS has the authority to take these action under the “emergency action” provision (Sec. 5.7) of the World Trade Organization Agreement on Sanitary and Phytosanitary Standards. (See a lengthy discussion of the SPS agreement in Chapter III of Fading Forests II, available here.) http://treeimprovement.utk.edu/FadingForests.htm

USDA and CBP should take other steps to help importers comply with ISPM#15.

  • USDA should also step up efforts to help U.S. importers to determine – and then use – those foreign suppliers of wood packaging and dunnage have good compliance records.
  • APHIS should join the DHS CBP in providing incentives to importers to join an expanded Customs-Trade Partnership Against Terrorism program (C-TPAT) that would require participants to assume full responsibility for ensuring that their packaging complies with IPPC standards.

The Government should strengthen underlying regulations.

  •  Once a new president is elected, urge him to instruct the Office of Management and Budget to allow APHIS to finalize regulations – proposed more than five years ago! – that would apply ISPM#15 to wood packaging used in trade between the US and Canada. (Canada has been ready to adopt this measure for several years.)
  • USDA needs to understand the “approach rate” of pests in wood packaging in order to identify and fix weaknesses in its policies. To reach this understanding, APHIS should authorize Robert Haack to repeat the study documented in Haack et al. (2014). Furthermore, APHIS should collaborate with foreign counterparts to determine the relative importance of possible causes of the persistent pest presence problem – fraud, accidental misapplication of treatments, or other failures of treatment. Once the study has been completed, APHIS and its colleagues should work through the IPPC to fix the problems.

There are also recommendations of the Tree-Smart Trade program at www.tree-smart-trade.org  Tree-Smart also has a Twitter account: @treeSMARTtrade

Posted by Faith Campbell

We welcome comments that supplement or correct factual information, suggest new approaches, or promote thoughtful consideration. We post comments that disagree with us — but not those we judge to be not civil or inflammatory.

For a detailed discussion of the policies and practices that have allowed these pests to enter and spread – and that do not promote effective restoration strategies – review the Fading Forests report at http://treeimprovement.utk.edu/FadingForests.htm

Another Set of Official Data Demonstrates Impact of Non-Native Forest Pests

Ash forest in Michigan killed by emerald ash borer
photo by Nate Siegert

As I reported in December, the USDA Forest Service Forest Health Management program has been issuing reports on the status of pest invasions, based on annual national Insect and Disease Surveys (IDS). This survey is carried out by low-level aerial surveys of statistically valid geographic units. (For a discussion of quadrat establishment, see the Introduction to the 2019 report here.  

Here I compare the pest situation as it appeared in two recent years, based on these surveys: 2017 and 2018.

Of course, two years is too short a time to see trends. The second report provides  USFS scientists attempt to provide context by analyzing 20 years of data (Chapter 6 of the 2019 report).

These reports are important sources of data on the status of non-native pests in our forests, but I raise several caveats that necessitate our continuing to rely on additional sources, some of which I have cited in previous blogs. I will address these in greater detail below. But in brief, these caveats are:

1) Major pests – both in extent and damage caused – are not adequately included (see below).

2) The survey technique resulted in delays in detecting mortality. It cannot be used as an early detection tool.

3) There is little analysis of the statistics cited.

Why Stakeholders Cannot Rely on These Two Survey Reports Alone

I hope stakeholders, analysts, and decision-makers will utilize the full range of reports and other data to evaluate the presence and impacts of various invasive pests and pathogens. Even the reports’ authors advise decision-makers to use other forest health indicators in addition to this report. It is not the “fault” of the authors that these reports cannot serve all needs. However, we all need to be aware this caveat.

1. Important Pests Not Adequately Included.

Many of the most damaging non-native pests caused extensive damage before these surveys were initiated. These include white pine blister rust, chestnut blight, Dutch elm disease, butternut canker, Port-Orford cedar root disease, European gypsy moth, and balsam woolly adelgid on Fraser fir. [For further discussion, see pest write-ups here and my earlier blogs reviewing 30 years of engagement and survey data from Shenandoah National Park.]

2. Major Damaging Pests Are Poorly Captured by the Survey Method. Morin found that non-native pests had caused a five percent increase in mortality nation-wide – as measured by tree volume. Three of the species suffering the highest rates of this “exacerbated mortality” are redbay, ash, and hemlock. The current studies’ authors concede all three are poorly detected by the survey methods. The aerial survey techniques are ill-suited to detect mortality of tree species that grow scattered throughout a diverse forest. Other seriously damaging pests that are poorly detected by aerial surveys are Dutch elm disease, white pine blister rust, and thousand cankers disease. Again, see the species write-ups here to be reminded about how great the pest’s impact are. Also review my earlier blog reviewing 30 years of my engagement with the issue and survey data from Shenandoah National Park.

dead redbay in woods
photo by F.T. Campbell

Given these caveats above, what do these studies show us?

Areas surveyed.

Since 1999, the annual Insect and Disease Survey (IDS) has covered on average 266,655,000 ha, although the area varied from a maximum of 320,712,000 ha (in 2007) to a minimum of 202,170,000 ha (in 2017), then increased to 211,34,000 ha in 2018. For reasons not clear to me, the proportion of forested area in the lower 48 states surveyed actually declined from 2017 to 2018 – from 55.1% to 46.6%.  In Alaska, the 2017 surveys covered about 7.3% of the total forested area but 12.7% of the forested area in 2018. In Hawai`i, the survey covered about 80.1% of the forested area in 2017, but only 69.4% of the State’s total tree canopy area in 2018.

Tree-Killing Insects and Pathogens Found.

The 2017 survey identified 63 mortality-causing agents and complexes that cumulatively affected 3.27 million ha in the lower 48 states – about 1.3% of the total 252 million ha of forested land in these states. Of these agents of tree mortality, 23 were detected killing trees on areas totaling larger than 5,000 ha each.

The 2018 survey identified seven fewer mortality-causing agents – only 56. These agents were detected on about 2.13 million ha across the lower 48 (slightly less than the combined land area of New Jersey and Rhode Island), or about 0.8% of the total forested area. Of the total, 22 agents were detected killing trees on areas totaling larger than 5,000 ha each.

The more recent report does not discuss these declines from the 2017 findings or whether they might be related to the smaller percentages of forested areas covered by the aerial survey in 2018.

In both 2017 and 2018, as well as in the 20-year trend analysis (Chapter 6 of the  report published in 2020), overall mortality is greatest in the West due to the impact of several native western bark beetles. Overall mortality rates in other regions was considered low, despite severe impacts of some non-native species.

The 2017 survey found that the emerald ash borer (EAB) was the most widespread single agent, causing measurable tree mortality on 1.42 million ha. In 2018, the area of EAB damage was reduced by 76% — to just 338,000 ha. (Still, the latter figure represented 15.8% of the total area displaying mortality). These figures were probably underestimates – especially in areas outside North Central Region – because EAB is one of the pests poorly detected by the aerial survey technique – at least when ash are growing scattered in a diverse forest ecosystem. Although the USFS report doesn’t say so, this decline probably reflected the collapse of dead ash trees and reduction in numbers of still-alive but vulnerable ash trees as the EAB invasion wave matured.

The reports document a huge increase in mortality attributed to the sudden oak death pathogen between 2017 and 2018. (SOD is the only widespread non-native agent of mortality on the West coast.)  The area affected increased nearly seven-fold – from 6,335 ha in the 2017 survey to 42,771 ha in the 2018 survey. This equated to causing mortality on 3.9% of the total Regional mortality area. This finding parallels finding reported by the California Oak Mortality Task Force. Note that SOD-related mortality was not detected by the aerial surveys until 2008 – 13 year or more after scientists working on the ground detected the presence of the then-unknown pathogen in the forests of California.

tanoak killed by Phytophthora ramorum on Big Sur peninsula
photo by Matteo Garbelotto

Another alarming increase detected in 2018 was that of balsam woolly adelgid (BWA) in the Interior West. BWA-caused mortality was evident on 44,000 ha – 8.4% of the total area with mortality. BWA impacts were especially severe in central Idaho. There are several native pests in the same area. (See BWA write-up here.)   BWA was first detected in Idaho in 1983 – 35 years earlier.

Geographic Hot Spots

The EAB caused the principal hot spots in the East. In the USFS North Central Region, 91% of the area suffering tree mortality in 2017 was attributed to the EAB. The EAB was also causing mortality across 10,346 ha (16% of the total areas suffering mortality) in the Northeast (especially Connecticut) and more than 5,000 ha in the South (especially Kentucky). (See my December blog for a discussion of the puzzling situation in several Great Plains ecoregions, where mortality was attributed largely to drought rather than either EAB or Dutch elm disease.)

Another mortality agent in the Northeastern Region was the European gypsy moth. In 2018, it was responsible for tree death on 31% of the total 70,000 ha affected area.

Another hot spot was in Hawai`i. In 2017, about 37,000 ha of mortality was detected. By 2018, the dead zone had increased to 46,000 ha – despite a 12% decrease in the area surveyed. In both years, the data collectors officially called the cause unknown. The reports’ authors stated that the probable cause was they rapid ‘ōhi‘a death fungi.  (I ask why the surveyors did not state the cause since rapid ‘ōhi‘a death was identified on the Big Island in 2014.)   

rapid ‘ōhi‘a death
photo by J.B. Friday

Other non-native pests that affected more than 5,000 ha in the lower 48 states in 2017 were the BWA outbreak in the Northeast (20,758 ha, primarily in Maine); beech bark disease (12,222 ha, primarily in the North Central Region), and oak wilt (9,573 ha, primarily in the North Central Region and Texas).

In the Southern Region, mortality agents were detected on 1% or less of the forested area in 2017. In 2018, EAB-caused mortality was detected on 9.7% of the total 13,000 ha area experiencing mortality. An earlier gypsy moth outbreak had apparently calmed. I remind you that the report authors have conceded that laurel wilt and hemlock woolly adelgid are poorly detected by the survey technique.

eastern hemlock in Shenandoah National Park (Virgina)

DEFOLIATORS

The 2017 survey detected defoliation caused by 50 agents and complexes across the lower 48. These impacted 2.3 million ha. The 2018 survey identified six more defoliation agents and complexes (56), but they affected a much smaller area – about 1.72 million ha.

Unsurprisingly, the most widespread was the European gypsy moth. The data demonstrated the gypsy moth’s boom/bust cycle. In 2017, gypsy moth impacts were detected on 39% of the total forested area of the lower 48 states (913,000 ha) in 2017. By 2018, the total area affected by the gyspy moth had fallen to 156,000 ha. 

In both years, gypsy moth defoliation was particularly severe in the Northeast Region. In 2018, a second non-native species, browntail moth (Euproctis chrysorrhoea) was also causing severe defoliation in the region, primarily in Maine.

In the South, the European gypsy moth affected only 5.8% of the total area of defoliation; native defoliators predominated.

The report does not discuss the relationship between gypsy-moth caused defoliation and mortality. True, there must be repeated defoliations to cause tree mortality.

Other non-native defoliation agents affecting more than 5,000 ha in the lower 48 in 2017 were the larch casebearer (25,891 ha in the North Central Region and another 7,400 ha in the West Coast Region); and winter moth (12,760 ha in the Northeast Region). Is the decline of winter moth in 2018 data related to introduction of a biocontrol agent?

In 2018, the Larch casebearer (Coleophora laricella) continued to be a significant defoliator, affected 3.1% of the North Central Region’s total defoliated area. A new agent, the balsam woolly adelgid (BWA), was detected defoliating firs in the West Coast Region. The affected area was 15,000 ha – 5% of the total affected area Again, there was no discussion of as to whether defoliation precedes mortality. Admittedly, the progression of BWA damage in firs is extremely complicated.

Alaskan forests suffered widespread defoliation, mostly by native species. The survey detected an unknown canker on quaking aspen (Populus tremuloides).

Twenty Years of Data: Trends   

In addition to reporting on the 2018 survey, the more recent report contains an analysis (in Chapter 6) of data over 20 years.   The analysis is intended to be used in analyses required under the Resource Protection Act (RPA). The RPA analysis uses the same set of Insect and Disease Survey data, although it groups them in four rather than five regions.

The authors grouped the annual data into four five-year windows (1996-2001; 2002-2006; 2007–2011; 2012-2016).

An overview comprising all mortality agents across the nation found a major “spurt” in area exposed to mortality-causing agents in 2002-2006. The 14.2 million ha was 4.5 times greater than the 3.1 million ha affected in the preceding 1997-2001 period. This was attributed, in part, to a sampling change. The mortality footprint fell slowly in later periods – to 9.9 million ha in 2007-2011 and 6.9 million ha in 2012-2016. Other than during the 2002-2006 period, mortality was relatively low in the Northern Region – despite EAB – especially when compared to high mortality in the Rocky Mountain and Pacific Coast Regions attributed to bark beetles.

The mortality area attributed to pathogens was also highest in 2002-2006. This was due to three pests: a root diseases-bark beetle complex killing subalpine fir, oak wilt, and beech bark disease.

Very little disease mortality was reported in the South during any of the five-year periods – an alarming failure given damage to redbay by laurel wilt. The lapse is more confusing because past IDS reports have listed redbay as heavily damaged (see USDA FS FHTET 2014).

The Pacific states saw a modest increase over time. The sudden oak death infestation was first detected by the IDS survey in 2008 – approximately 13years after it was detected on the ground.

Over the 20 years, non-native species caused mortality on an average of 500,000 ha in each five-year period except 2002-2006 (described above). The proportion of the total mortality footprint associated with non-native species was14.8% in 1997-2001, 34.4% in 2002-2006, 3.6% in 2007-2011 & 7.4% in 2012-2016.

Only in the Northern Region was a large proportion of the mortality footprint consistently attributed to non-native species – 35.1% in 1997-2011 to 98.5% in 2002-2006. The suite of species changed over time. In the first period (1997-2001), the principal species were beech bark disease, European gypsy moth, oak wilt, and hemlock woolly adelgid. During two periods – 2002-2006 and 2007-2011 – those present earlier were joined by BWA, EAB, and Dutch elm disease. By the final period – 2012-2016 – the principal agents were EAB and red pine scale.

beech bark disease
Photo by Linda Haugen
courtesy of Bugwood

Non-native mortality agents detected in the South included hemlock woolly agelgid and oak wilt. HWA affected 71.8% of the affected area in 2006 – 2012, 21.9% in 2012-2016. EAB was first detected by the aerial survey in 2016.

In the two western regions, non-native agents had low footprints. The highest impacts were associated with BWA and white pine blister rust in the Rocky Mountain Region, Port-Orford cedar root disease and SOD in the Pacific Region, with the addition of BWA in some years and ROD in 2015 and 2016.

(All these pests are described here.)

Generally, woodborers have caused the highest mortality levels, seconded by pathogens. Only in the 2002-2006 period did another insect feeding guild exceed 10% of total mortality area – when BWA (a sap feeder) reached 18.7% of detected mortality – on balsam fir in Maine.

In the Western regions, the disease white pine blister rust was second to the subalpine fir mortality complex. Even this ranking fails to reflect widespread mortality of lower-elevation five-needle pines in previous decades.

In the Northern Region, a disease – beech bark disease – was most important in the first five-year period. It was replaced by a wood-boring beetle – EAB. I have noted the importance of the BWA (a sap-feeder) infestation during 2002-2006.

In the Southern Region, native bark beetles usually predominated. There were outbreaks of the foliage-feeding European gypsy moth in2007-2011 and hemlock woolly adelgid (sap-feeder) in 2012-2016.

The authors of the report note that the South might be underrepresented for several reasons – but without mentioning the severe impacts on the understory trees redbay and more recently sassafras.

SOURCES

Bailey, R.G.. 1995. Descriptions of the ecoregions of the United States. 2d ed. Miscellaneous Publication No. 1391. Washington, D.C.: U.S. Department of Agriculture Forest Service. 108 p.

Fei, S., R.S. Morin, C.M. Oswalt, and A.M. 2019. Biomass losses resulting from insect and disease invasions in United States forests

Guo, Q., S. Feib, K.M. Potter, A.M. Liebhold, and J. Wenf. 2019. Tree diversity regulates forest pest invasion. PNAS. www.pnas.org/cgi/doi/10.1073/pnas.1821039116

Morin, R.S., K.W. Gottschalk, M.E. Ostry, A.M. Liebhold. 2018. Regional patterns of declining butternut (Juglans cinerea L.) suggest site characteristics for restoration. Ecology and Evolution.2018;8:546-559

Morin, R. A. Liebhold, S. Pugh, and S. Fie. 2019. Current Status of Hosts and Future Risk of EAB Across the Range of Ash: Online Tools for Broad-Scale Impact Assessment. Presentation at the 81st Northeastern Forest Pest Council, West Chester, PA, March 14, 2019

Potter, K.M., B.S. Crane, W.W. Hargrove. 2017. A US national prioritization framework for tree species vulnerability to climate change. New Forests (2017) 48:275–300 DOI 10.1007/s11056-017-9569-5

Potter, K.M., M.E. Escanferla, R.M. Jetton, and G. Man. 2019a. Important Insect and Disease Threats to United States Tree Species and Geographic Patterns of Their Potential Impacts. Forests. 2019 10 304.

Potter, K.M., M.E. Escanferla, R.M. Jetton, G. Man, and B.S. Crane. 2019b. Prioritizing the conservation needs of United States tree species: Evaluating vulnerability to forest insect and disease threats. Global Ecology and Conservation. (2019)

USDA Forest Service. Forest Health Monitoring: National Status, Trends, and Analysis 2018. General Technical Report SRS-239. June 2019. Editors Kevin M. Potter Barbara L. Conkling

USDA Forest Service. Forest Health Technology Enterprise Team. 2014. 2013-2027 National Insect and Disease Forest Risk Assessment. FHTET-14-01

Posted by Faith Campbell

We welcome comments that supplement or correct factual information, suggest new approaches, or promote thoughtful consideration. We post comments that disagree with us — but not those we judge to be not civil or inflammatory.

For a detailed discussion of the policies and practices that have allowed these pests to enter and spread – and that do not promote effective restoration strategies – review the Fading Forests report at http://treeimprovement.utk.edu/FadingForests.htm

Hopeful Developments for One Bioinvader – KSHB; Possible implications of research & management recommendations

Willow forest in the Tijuana River Valley killed by Kuroshio shot hole borer
the “boom” part of the cycle
photo by John Boland

I have blogged earlier about the damage caused by the Kuroshio shot hole borer (KSHB, Euwallacea kuroshio), which is one of two invasive shot hole borers established in southern California. The beetle and its symbiotic fungi had caused amazing levels of damage in the Tijuana River Valley in San Diego County, California. The wood borer is described here and here.  

Most of the earlier blogs focused on the absence of a response by California’s phytosanitary agency and here – until John Kabashima created sufficient political demand for a response.

A scientist who has devoted considerable effort to understanding the KSHB is John Boland of Boland Ecological Services. He has posted annual reports analyzing five years of the outbreak in the Tijuana River Valley (see full citations at the end of the blog). His principal findings (Boland and Uyeda 2020): the invasion went through a boom and bust cycle, with willows in the wettest parts of the estuary having largely recovered. So far, Kuroshio shot hole borers have not re-infested the growing trees, despite the presence of all conditions seeming to favor invasion. His principal worry is enhanced invasion by the non-native grass or reed Arundo donax.

The study site is a coastal floodplain crossed by an intermittent stream. The Tijuana River valley provides several ecosystem services, including filtering pollutants before the water reaches the ocean, open space, and important wildlife habitat, including Critical Habitat for the federally endangered least Bell’s vireo (Vireo bellii pusillus).

There is a mosaic of forests of different ages and at different distances from the current flows. They range from wet forests growing in the current river beds; dry forests growing in older river beds that get some current flows; and scrub forests growing far from current river flows. All these forests are dominated by two willows: the black willow (Salix gooddingii) and the arroyo willow (Salix lasiolepis). Both are preferred hosts of KSHB; both are pioneer species that establish in disturbed wet areas; both resprout vigorously. The riparian scrub woodlands surrounding the forests are dominated by the perennial shrub, mule fat (Baccharis salicifolia), with scattered willows of both species (Boland and Uyeda 2020).

The river carries high levels of raw sewage and industrial waste from Tijuana, Mexico. Raw sewage contains important plant nutrients – nitrogen, phosphorus and potassium. The willows in or near the nutrient-enriched channel water were growing quickly and vigorously, and had wood characteristics that differed significantly from those of trees in the dry or scrub forests. Dr. Boland notes that these trees’ phloem sap is loaded with sugars from the fast-growing leaves, and xylem sap is loaded with nutrients from the enriched soil. His Enriched Tree Hypothesis (discussed further below) suggests that these nutrients promote fast growth of the symbiotic fungi and ideal conditions for KSHB (Boland and Woodward 2019).

Boland and his colleagues have carried out detailed annual field surveys of the infestation since 2015. Using the same study plots in each year, they analyzed infestation and mortality rates, canopy damage, and survivorship of tagged willows.

Funding originally came from the U.S. Navy and U.S. Fish and Wildlife Service – agencies probably worried about the potential destruction of the vireos’ habitat. As of 2019 KSHB had infested 91% of all the willows in the valley – estimated to be more than 350,000 willows. KSHB had killed 30% of the trees, or nearly 123,000 (Boland 2019). Dr. Boland considers this estimate to be an underestimate because he could not accurately carry out surveys of individual trees in the extensively-damaged Wet Forest units in 2018. There was considerable variation in pest impacts depending on host trees’ proximity to the intermittent river. Of all of the willow deaths in the valley, 93.8% occurred in the Wet Forests, 6.1% in the Dry Forests and 0.1% in the Scrub Forests. This variation occurred even though the sites contain the same willow species (Boland and Uyeda 2020).

Infestation rates over the four-year period averaged 99% of willows in the Wet Forest units, 82% in the Dry Forests and 3% in the Scrub Woodlands. Considering 2019 alone, the overall infestation rate was only 9%. Looking at differences among forest types, 1% of the willows in Wet Forests were infested (down from 95% in 2015), 29% of the willows in dry forests (down from 73% in 2016), and 0% of the willows in the scrub forests (down from 2% in  2018). (2019 infestation rates from Boland and Uyeda 2020; earlier years from Boland 2019.)

Infestation rates had to be very high before trees died, but then mortality was very high. Only after sites reached infestation rates of more than 95% did sites have significant mortality rates – and then, very high — up to 97%. In agreement with other findings, most of the high-mortality sites were in Wet Forest units. These had a mean maximum mortality rate of 49%. The mean maximum mortality rate was only 9% in Dry Forest and 2% in Scrub Forest units (Boland and Uyeda 2020).

The size of the tree is also important. In the Wet Forests, in 2019, infestation rates were 0% for seedlings and young trees; 3% for the relatively undamaged trees that are more than 5 years old; and 1% of the resprouting adult trees that had been broken during the first wave of invasion. KSHB prefers young trees with a trunk dbh of at least 4.5 cm. Smaller trees were generally avoided. Trees with very large dbh (> 30 cm) appear to be able to survive a KSHB attack (Boland and Uyeda 2020).

At the end of the five year period, Dr. Boland had documented interesting/puzzling findings.

Recovery of the willow forest in Tijuana River Valley – 2019
photo by John Boland

Wet Forests

KSHB in the valley went through a rapid boom-and-bust cycle. In the Wet Forests, KSHB infestation progressed over the course of a few months from barely noticeable to heavy infestation and dramatic canopy collapse. Infestation rates of 80 – 95% in the West Forests in 2015 and 2016 led to virtual elimination of the canopy between 2016 and 2017 as tunnel-ridden trees were broken by wind storms.  These severe damage levels occurred over 94 acres (Boland and Uyeda 2020).

After apparently depleting their preferred hosts in the wettest parts of the forest, beetle numbers fell and host trees began a rapid recovery. Mean canopy cover rose from 5% in 2017 to 56% in 2019. This recovery has taken three forms: survival of a few, scattered mature infested trees (‘Big Trees’) which grew new wood over KSHB galleries (Boland 2019); resprouting of mature KSHB-damaged trees (‘resprouts’); and seeding of new trees (‘seedlings’). Some of the forests have recovered so much in just 4 years that they are now similar to their pre-KSHB stature (Boland and Uyeda 2020).

Dr. Boland suggests that KSHB is promoted by high nutrient (pollution) levels in the water, which result in rapid growth by trees near the most steady of the intermittent streams. He has developed an Enriched Tree Hypothesis (explained briefly below; for a full discussion, see Boland and Woodland 2019).

As of autumn 2019, beetles have not attacked the recovering hosts – despite apparently favorable conditions and the absence of management interventions. 2019 infestation rates were 3% of the remaining Big Trees, 2% of the resprouting trees, 1% of the young trees, and 0% of the seedlings. Dr. Boland suggests three possible reasons (Boland and Uyeda 2020), which I will discuss below.

The resprouting trees are now old & vigorous enough to flower

It is likely that these recovering willow forests will provide good breeding habitat for least Bell’s vireo (all Boland publications).

Dry Forests

Infestation in the Dry Forests spread more slowly – infestation rates averaged 82% in the Dry Forests over four years. The infestation progressed more slowly and the canopy remained mostly intact. But in 2019 the infestation rate in the Dry Forest was substantially higher than in the Wet Forest — 29% versus 1% (Boland and Uyeda 2020).

Still, only 16% of more than 200 willows tagged in February 2016 had been killed by KSHB by autumn 2019. Among the living trees were three quarters of trees already infested in 2016, and half of trees that became infested after 2016 (Boland and Uyeda 2020).

Lack of Reinfestation (Boland and Uyeda 2020).

The absence of reinfestation is surprising, especially because the conditions thought favorable to KSHB are all present:

1. The regenerating trees belong to host species known to be preferred – black and arroyo willows.

2. The regenerating trees have reached the preferred size with trunk dbh exceeding 4.5 cm. In fall 2019 the trees in the recovering Wet Forests included many resprouting trees with mean diameters of 6.5 cm, and many new seedlings with mean diameters of 11.7 cm.

3. Recovering forests are located in the preferred nutrient-rich sites. Sewage levels remain high.

4. The trees in the recovering forests are in the condition preferred by KSHB, i.e., the trees are fast-growing and vigorous.

5. The KSHB is present – in low numbers in the Wet Forests, more numerous in Dry Forests which are < 1 km away.

It is not known whether KSHB will eventually re-infest.

The KSHB infestation reversed the presence of large trees. Originally 53% of the large trees were in the Wet Forests, 38% in the Dry Forests. The KSHB invasion damaged so many of the trees in the Wet Forests that now they represent only 24% of all the ‘Big Trees’ in the Valley; 58% of the ‘Big Trees’ are now in the Dry Forests. In many Dry Forests the remaining tall trees form a continuous canopy layer, whereas in the polluted Wet Forests they are usually only single ‘Big Trees’ (Boland and Uyeda 2020).

Other plant species

Dr. Boland expresses great concern about the spread of the invasive plant, Arundo donax, in response to canopy openings caused by the initial invasion and canopy collapse (willow trees are Arundo’s only competitors in the valley).

Surveys during fall 2019 found that most plant species growing in the Tijuana River Valley are native, dominated by the willows (mean cover of 60%). The most abundant non-native species is castor bean (10% cover). Arundo had a mean cover of only 6% in the belt transects, but it was more abundant outside the transects. Arundo is spreading as rhizomes cut loose by bulldozing, disking, and mowing on property managed by International Boundary and Water Commission (Boland and Uyeda 2020). Both willows and Arundo had increased their percent cover between 2018 and 2019 (Boland 2019).

Dr. Boland’s Recommendations (Boland and Uyeda 2020)

1) The different invasion trajectories in the three habitat types contradict some researchers’ expectation that all trajectories are similar from regardless of site characteristics or that a light infestation must be recent while a heavy infestation must be old.

2) Unique characteristics of the Tijuana River valley – especially the high sewage levels – mean that the severe infestation and damage seen there should not be expected to occur at other natural, unpolluted riparian sites.

3) Dr. Boland disputes recommendations that “heavily infested” trees be removed because they are doomed and support beetle reproduction. Although Dr. Boland studied primarily willows, he did evaluate 24 California sycamores (Platanus spp.) that had been planted in various parts of the valley.

He found that none had died and only two (8%) were infested. The two infested trees were lightly infested and growing near the sewage-enriched stream. Dr. Boland concluded that sycamores were also unlikely to be heavily infested and killed in habitats less favorable to shot hole borers (Boland 2019).

4) The ease with which native willows became densely established in wet forest sites after the first infestation wave leads Dr. Boland to advocate reliance on natural restoration projects … as long as Arundo invasion can be controlled.

5) Avoid over-fertilization or over-watering of trees in planted landscapes.

6) Focus detection searches for KSHB in nutrient-enriched areas. … e.g., near storm drain outfalls.

Research recommendations:

A) Determine why KSHB has not substantially reinvaded the recovering willow forests despite the presence of preferred species in “correct” condition and size. Dr. Boland suggests testing of three hypotheses:

  • Induced response of hosts. Have the infested willows changed their chemistry as a result of the borer attack, thus increasing their resistance ….
  • Overall forest structure. Have the less dense and more mixed forest stands reduced attractiveness to the beetle?
  • A disease or predator. Has a biocontrol agent been introduced accidentally? None has yet been identified …

B) Understand the possible mechanisms for the high initial infestations rates in the Wet Forests.

  • To evaluate the Enriched Tree Hypothesis measure the sugars and nutrients (both concentrations and loading rates) in trees subject to differing amounts of sewage or fertilizers. Then conduct controlled trials in the lab on the growth response of ISHB’s fungal symbionts to various sugar and nutrient concentrations and loading rates.
  • Evaluate whether willows growing in the nutrient-enriched sites produced fewer tannins that might inhibit beetle and fungal growth.

C) Can ISHB disperse by wind?  Dr. Boland recommends searching for ISHB in the air high above infested trees; this could involve the use of nets or traps attached to aircraft, hot-air balloons, helium balloons or drones.

D) Determine whether surviving mature trees have superior characteristics re: morphology, vigor, and pest or disease resistance that make them less vulnerable to KSHB attack.  

E) Incorporate site and ecology data and varying levels of host vulnerability into models predicting KSHB impacts. Include the ecological costs of removing the trees.

My questions

Are other scientists applying these findings in their research on KSHB or polyphagous shot hole borer outbreaks in other parts of California? I am particularly interested in the issues of possible resistance in some willows – innate or induced; and the potential role of excess nutrients in promoting fungal and beetle growth. Are they finding the ecological components of the Enriched Tree Hypothesis to be helpful in defining the impact of PSHB outbreaks in other parts of the state, and of older ages?

SOURCES

Boland, J.M. 2109. The Ecology and Management of the Kuroshio Shot Hole Borer in the Tijuana River Valley. Final Report for Naval Base Coronado under Cooperative Agreement N62473-18-2-0008

Boland, J.M. and D.L. Woodward. 2019. Impacts of the invasive shot hole borer (Euwallacea kuroshio) are linked to sewage pollution in southern Calif: the Enriched Tree Hypothesis. PeerJ 7:6812

Boland, J.M. and K.A Uyeda. 2020. The Ecology and Management of the Kuroshio Shot Hole Borer in the Tijuana River Valley 2019-20 (Year 5) Final Report. For Naval Base Coronado, Department of Navy and Southwest Wetlands Interpretive Association. Under Cooperative Agreement N62473-18-2-0008

All these reports are available here:  The Ecology and Management of the Kuroshio Shot Hole Borer in the Tijuana River Valley — Tijuana Estuary : TRNERR

Posted by Faith Campbell

We welcome comments that supplement or correct factual information, suggest new approaches, or promote thoughtful consideration. We post comments that disagree with us — but not those we judge to be not civil or inflammatory.

For a detailed discussion of the policies and practices that have allowed these pests to enter and spread – and that do not promote effective restoration strategies – review the Fading Forests report at http://treeimprovement.utk.edu/FadingForests.htm