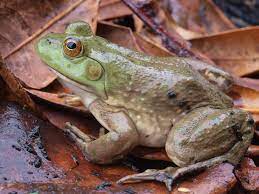
American bullfrog (Lithobates catesbeianus); photo by Will Brown via Wikimedia; one of invasive animals deliberately introduced to Europe in the past
In February 2024 the European Parliament approved legislation outlawing “ecocide” and providing sanctions for environmental crimes. Member states now have two years to enshrine its provisions in national law.
The new rules update the list of environmental crimes adopted in 2008 and enhance the sanctions. The goal is to ensure more effective enforcement. Listed among the offenses are:
the import and use of mercury and fluorinated greenhouse gases,
the import of invasive species,
the illegal depletion of water resources, and
pollution caused by ships.
This action followed an in-depth analysis of the failures of the previous EU environmental directive, first adopted in 2008 (Directive 2008/99/EC). The review found that:
The Directive had little effect on the ground.
Over the 10 years since its adoption few environmental crime cases were successfully investigated and sentenced.
Sanction levels were too low to dissuade violations.
There had been little systematic cross-border cooperation.
EU Member states were not enforcing the Directive’s provisions. They had provided insufficient resources to the task. They had not developed the needed specialized knowledge and public awareness. They were not sharing information or coordinating either among individual governments’ several agencies or with neighboring countries.
The review found that poor data hampered attempts by both the EU body and national policy-makers to evaluate the Directive’s efficacy.
The new Directive attempts to address these weaknesses. To me, the most important change is that complying with a permit no longer frees a company or its leadership from criminal liability. These individuals now have a “duty of care”. According to Antonius Manders, Dutch MEP from the Group of the European People’s Party (Christian Democrats), if new information shows that actions conducted under the permit are “causing irreversible damage to health and nature – you will have to stop.” This action reverses the previous EU environmental crime directive – and most member state laws. Until now, environmental crime could be punished only if it is unlawful; as long as an enterprise was complying with a permit, its actions would not be considered unlawful. Michael Faure, a professor of comparative and international environmental law at Maastricht University, calls this change revolutionary.
Lorton Prison; via Flickr
Another step was to make corporate leadership personally liable to penalties, including imprisonment. If a company’s actions cause substantial environmental harm, the CEOs and board members can face prison sentences of up to eight years. If the environmental harm results in the death of any person, the penalty can be increased to ten years.
Financial penalties were also raised. Each Member state sets the fines within certain parameters. Fines may be based on either a proportion of annual worldwide turnover (3 to 5%) or set at a fixed fine (up to 40 million euros). Companies might also be obliged to reinstate the damaged environment or compensate for the damage caused.Companies might also lose their licenses or access to public funding, or even be forced to close.
Proponents of making ecocide the fifth international crime at the International Criminal Court argue that the updated directive effectively criminalizes “ecocide”— defined as “unlawful or wanton acts committed with knowledge that there is a substantial likelihood of severe and either widespread or long-term damage to the environment being caused by those acts.”
Individual member states also decide whether the directive will apply to offences committed outside EU borders by EU companies.
Some members of the European Parliament advocate for an even stronger stance: creation of a public prosecutor at the European Union level. They hope that the Council of Europe will incorporate this idea during its ongoing revision of the Convention on the Protection of the Environment through Criminal Law. To me, this seems unlikely since the current text of the Convention, adopted by the Council in 1998, has never been ratified so it has not come into force.
The Council of Europe covers a wider geographic area than the European Union – 46 member states compared to 27. Members of the Council of Europe which are not in the EU include the United Kingdom, Norway, Switzerland, Bosnia-Hercegovina, Serbia, Kosovo, Albania; several mini-states, e.g., Monaco and San Remo; and countries in arguably neighboring regions, e.g., Armenia, Azerbaijan, Georgia, and Turkey.
While I rejoice that invasive species are included in the new Directive, I confess that I am uncertain about the extent to which this inclusion will advance efforts to prevent spread. The species under consideration would apparently have to be identified by some European body as “invasive” and its importation restricted. As we know, many of the most damaging species are not recognized as invasive before their introduction to a naïve environment. On the other side, the requirement that companies recognize new information and halt damaging actions – even when complying with a permit! – provides for needed flexibility.
Posted by Faith Campbell
We welcome comments that supplement or correct factual information, suggest new approaches, or promote thoughtful consideration. We post comments that disagree with us — but not those we judge to be not civil or inflammatory.
For a detailed discussion of the policies and practices that have allowed these pests to enter and spread – and that do not promote effective restoration strategies – review the Fading Forests report at http://treeimprovement.utk.edu/FadingForests.htm
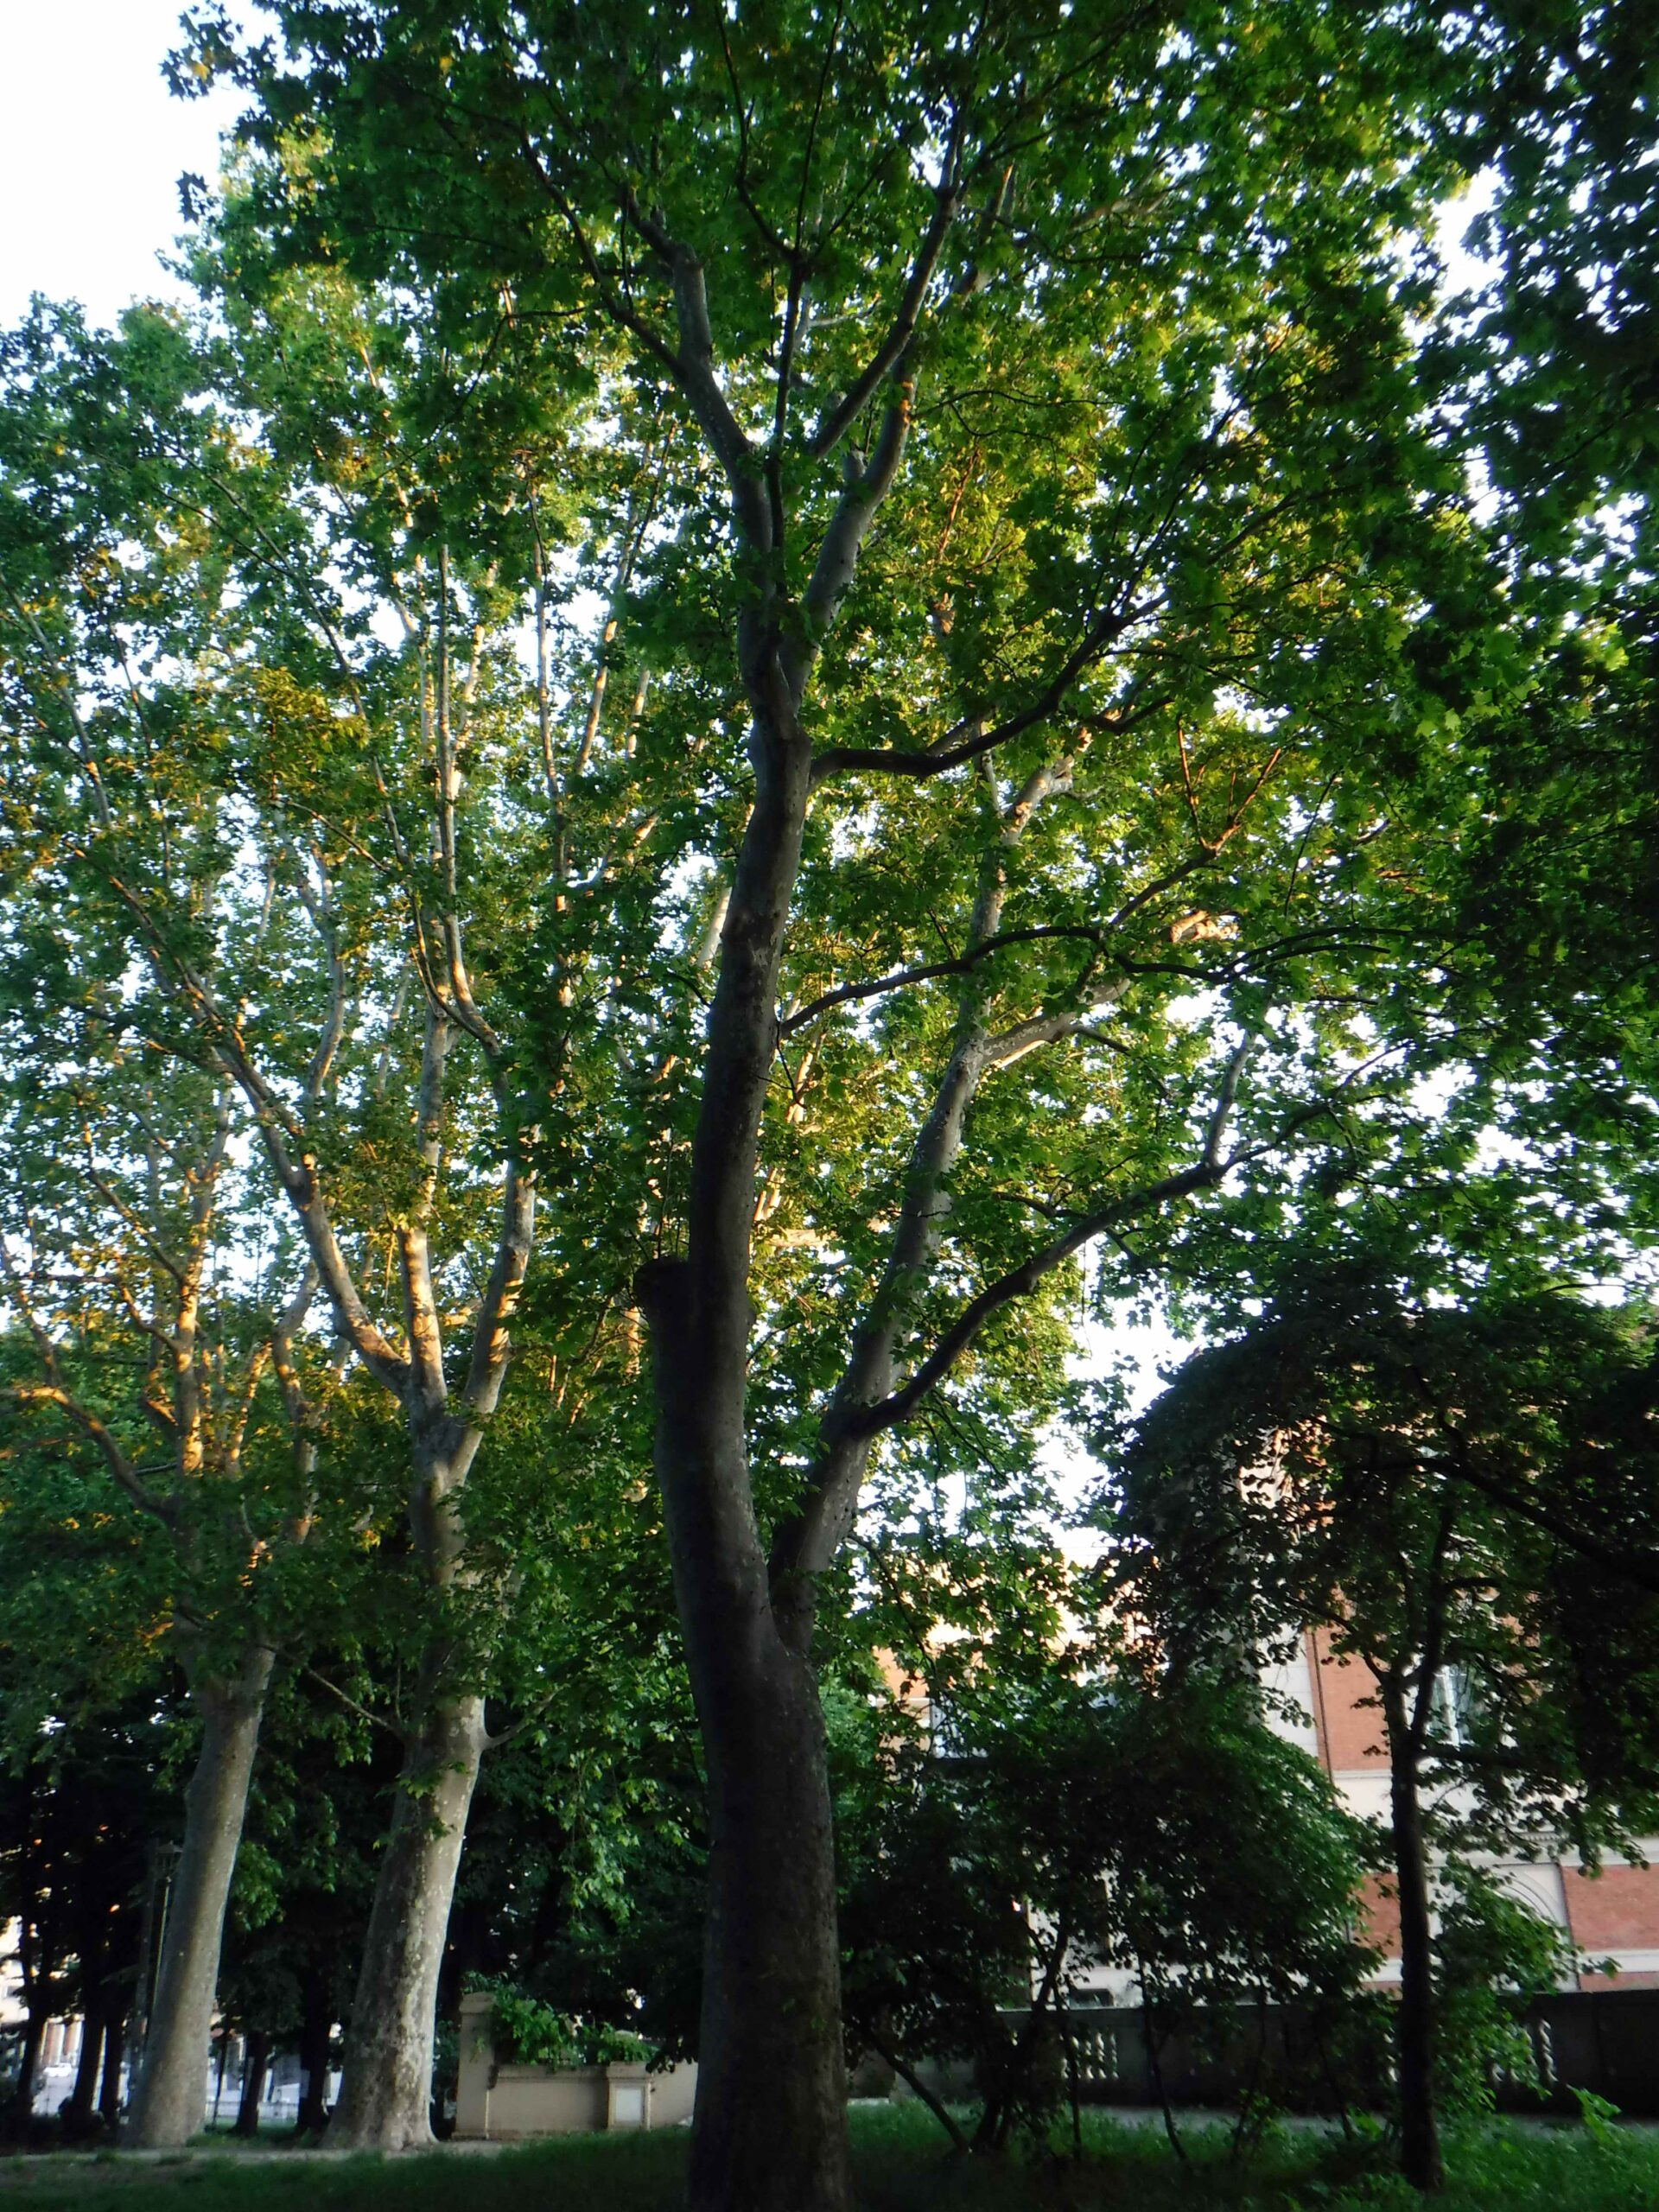
plane trees in Parco della Montagnola, Bologna, Italy
The CISP blog has had a pause while I travelled in Italy, Slovenia, and Croatia. My purpose was tourism … but I could not forget my interest in invasive species! Most prominent was that global traveller, Ailanthus altissima. I saw lots of the trees in both urban and rural settings. I am unclear about whether some other plant taxa are native v. non-native, e.g., ivy and several species of pines widespread along the Dinaric mountains. Scotch broom Cytisus scoparius was widespread along the Dalmatian coast – but it is native there so not a concern. (Should have been a warning that it would invade other areas with Mediterranean climates!) We were told that the city of Split is even named for the shrub – a shortened/corrupted version of the Greek name for the plant.
Regarding tree-killing pests, I was pleased to see lots of young olive trees along the Dalmatian coast – apparently the Xylella fastidiosa bacterial pathogen that is killing trees in Italy, France, Spain and Portugal is not yet a problem there.
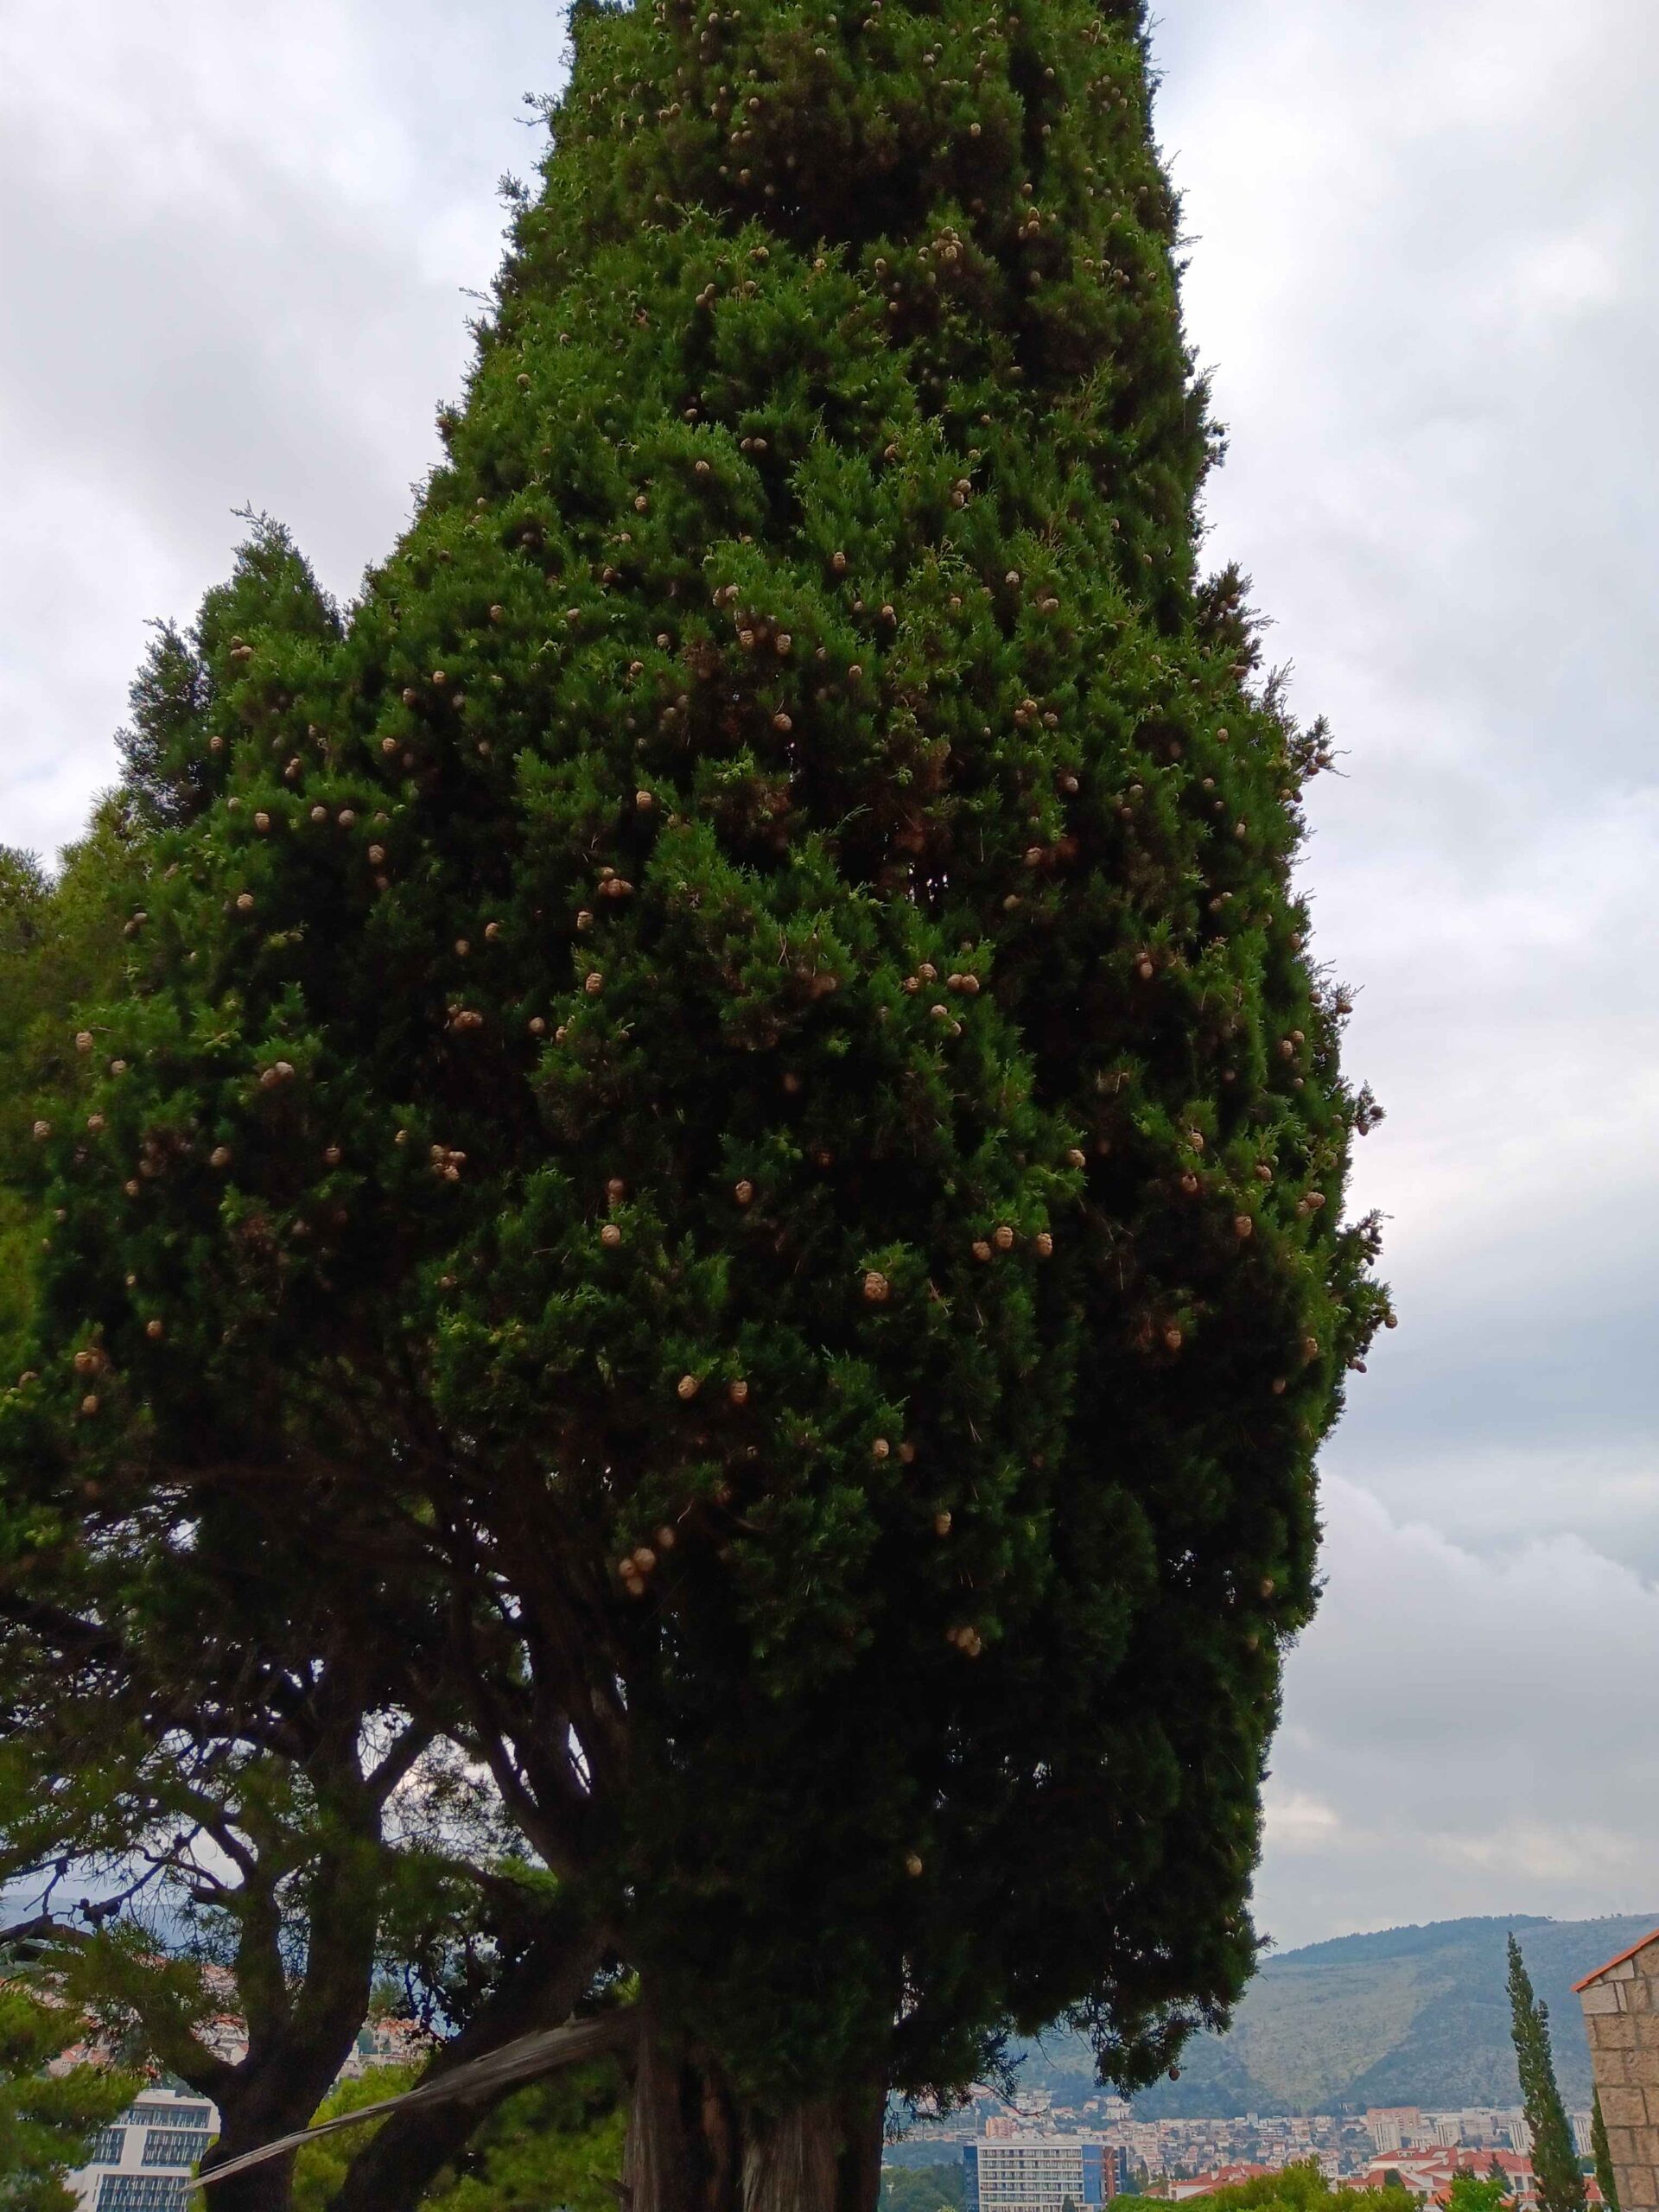
I also saw many of the columnar cedars that I understand are under attack by fungi in the genus Seiridium in Italy. I also saw apparently healthy boxwoods at our hotel near Dubrovnik.
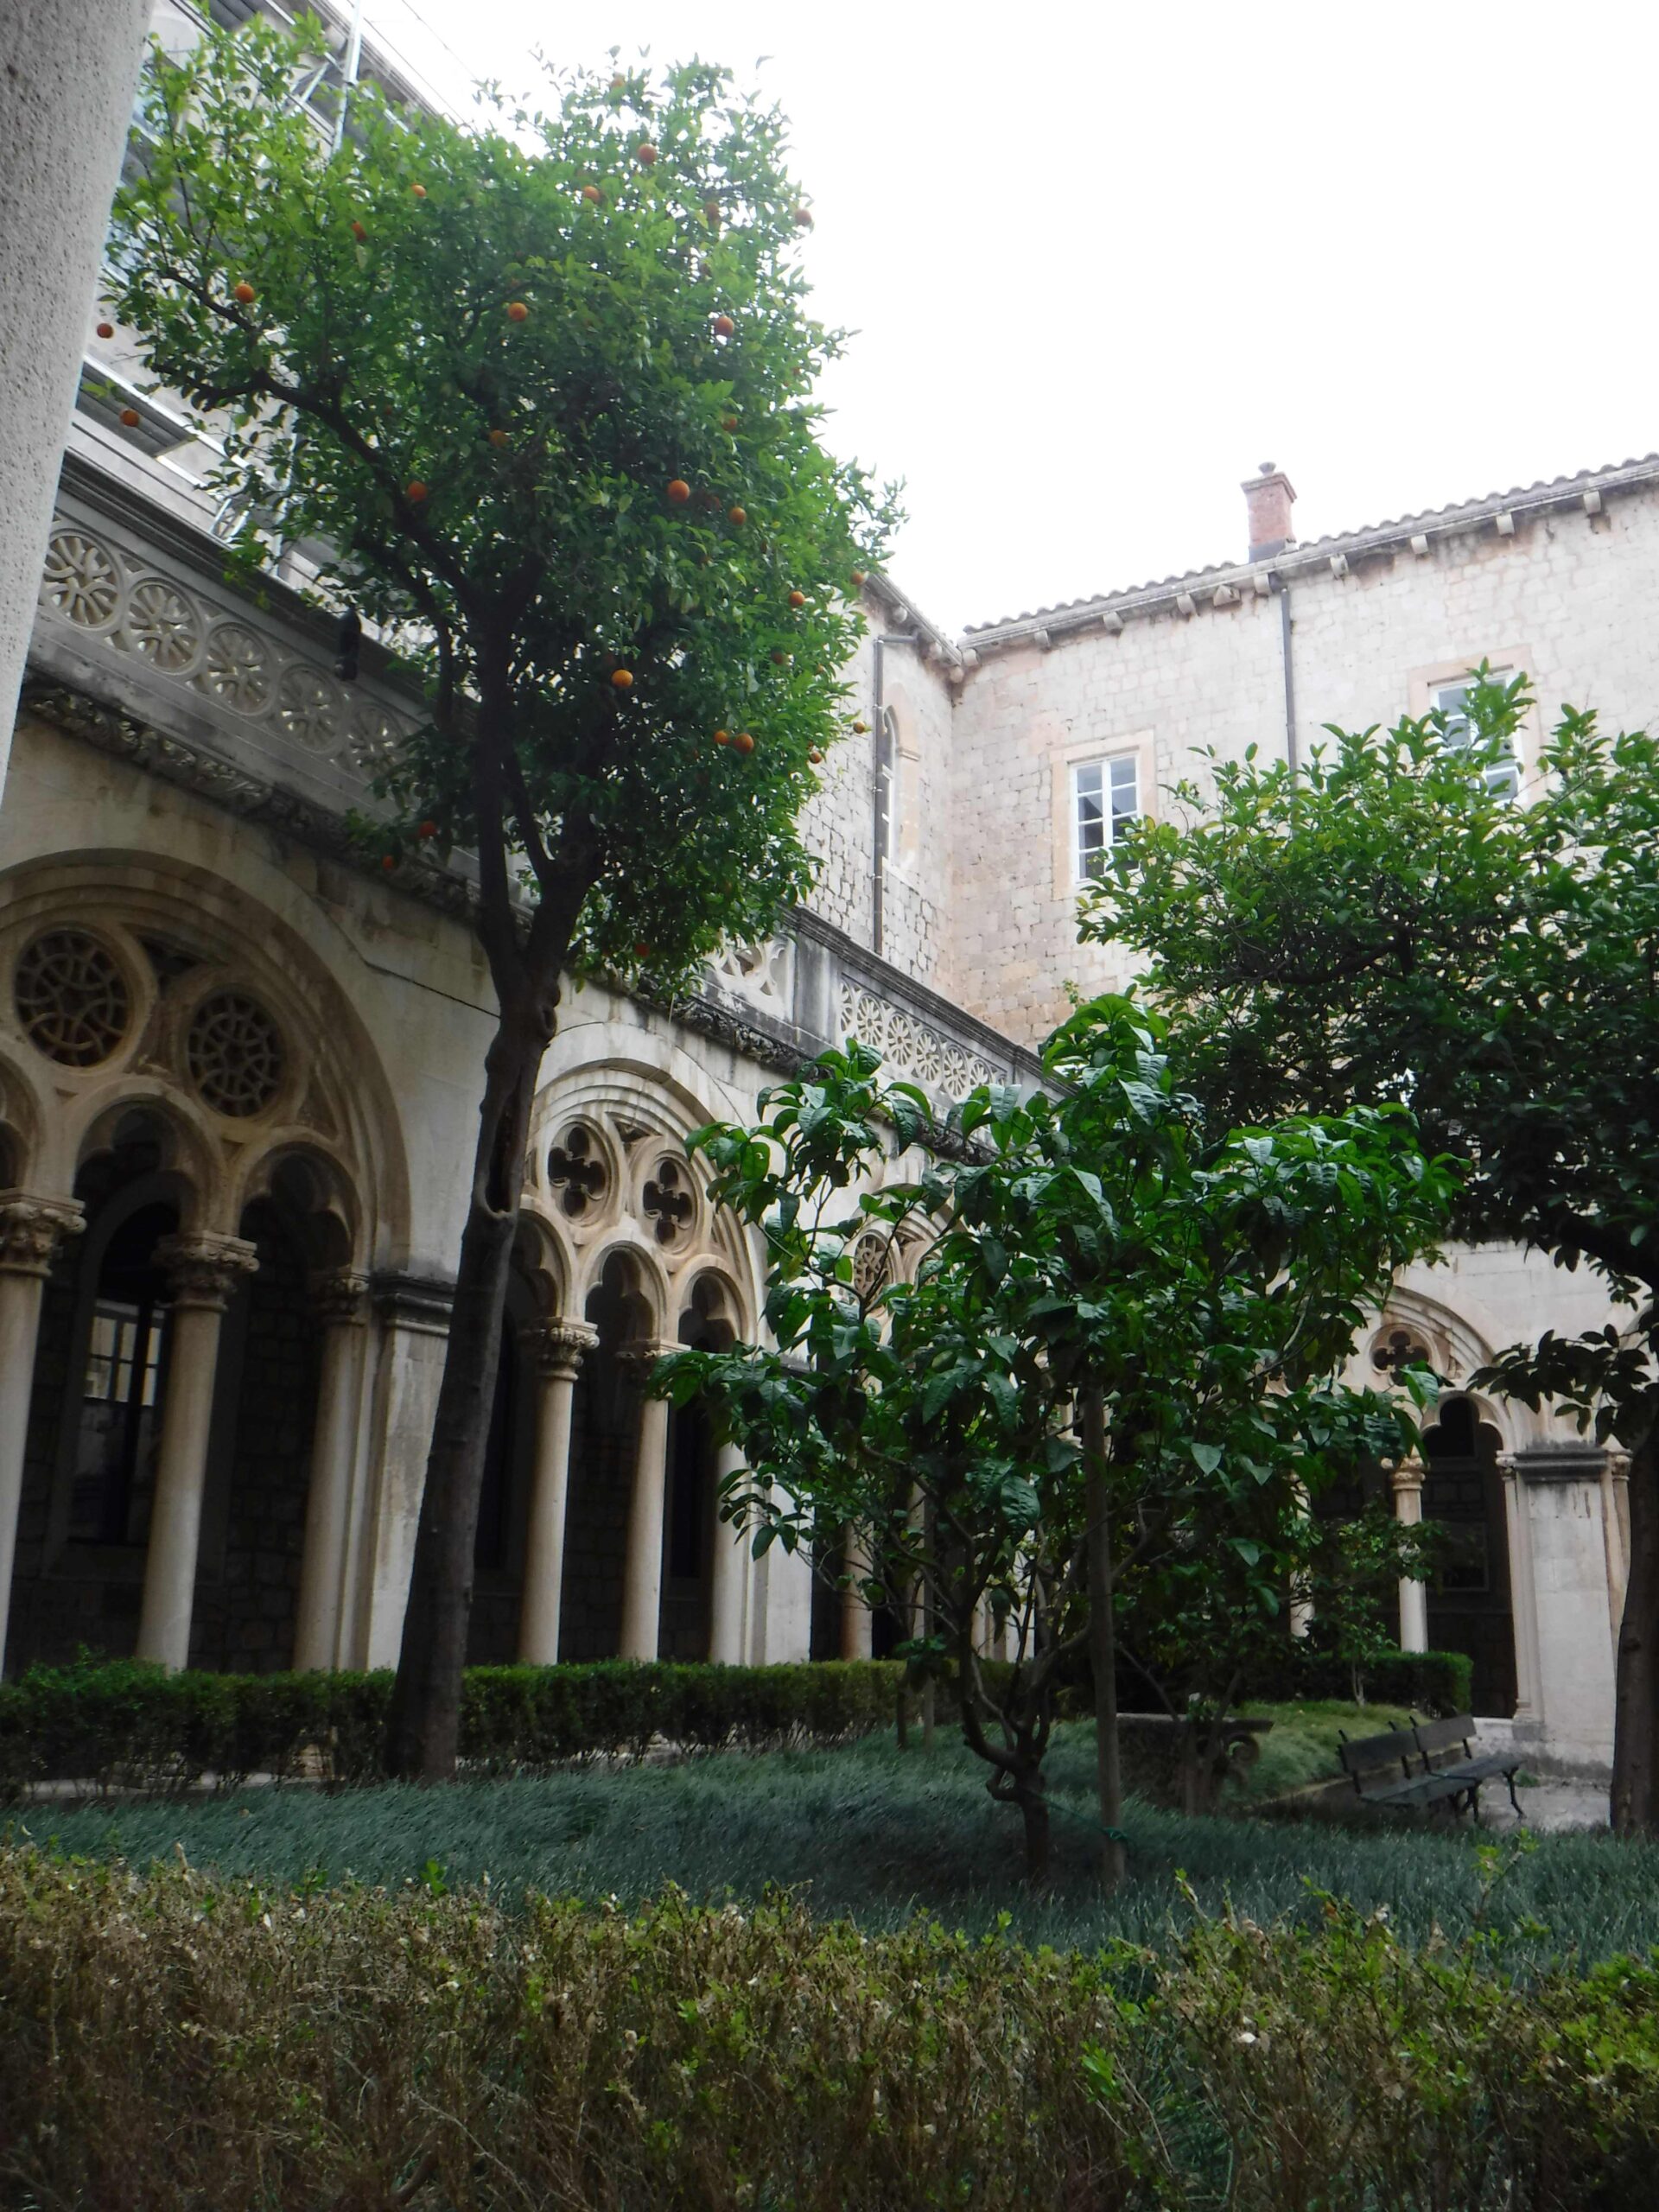
Some of the boxwoods growing in monastery cloisters in Dubrovnik looked as if they have been hit by box tree moth (Cydalima perspectalis) — which is no surprising since the pest was detected in northern Croatia a decade ago.
Dominican monastry in Dubrovnik
Finally, I saw apparently healthy plane trees growing in parks in Bologna; apparently this region has not yet been invaded by the canker stain disease caused by North American fungus Ceratocystis platani. – reported to have caused high levels of mortality in Italy, France, and especially in Greece. (See photo at top of blog) [See Tsopelas, Santini, Wingfield and de Beer. 2017. Canker stain: a Lethal Disease Destroying Iconic Plane Trees. Plant Disease. 2017. 101:645-658. American Phytopathological Society]
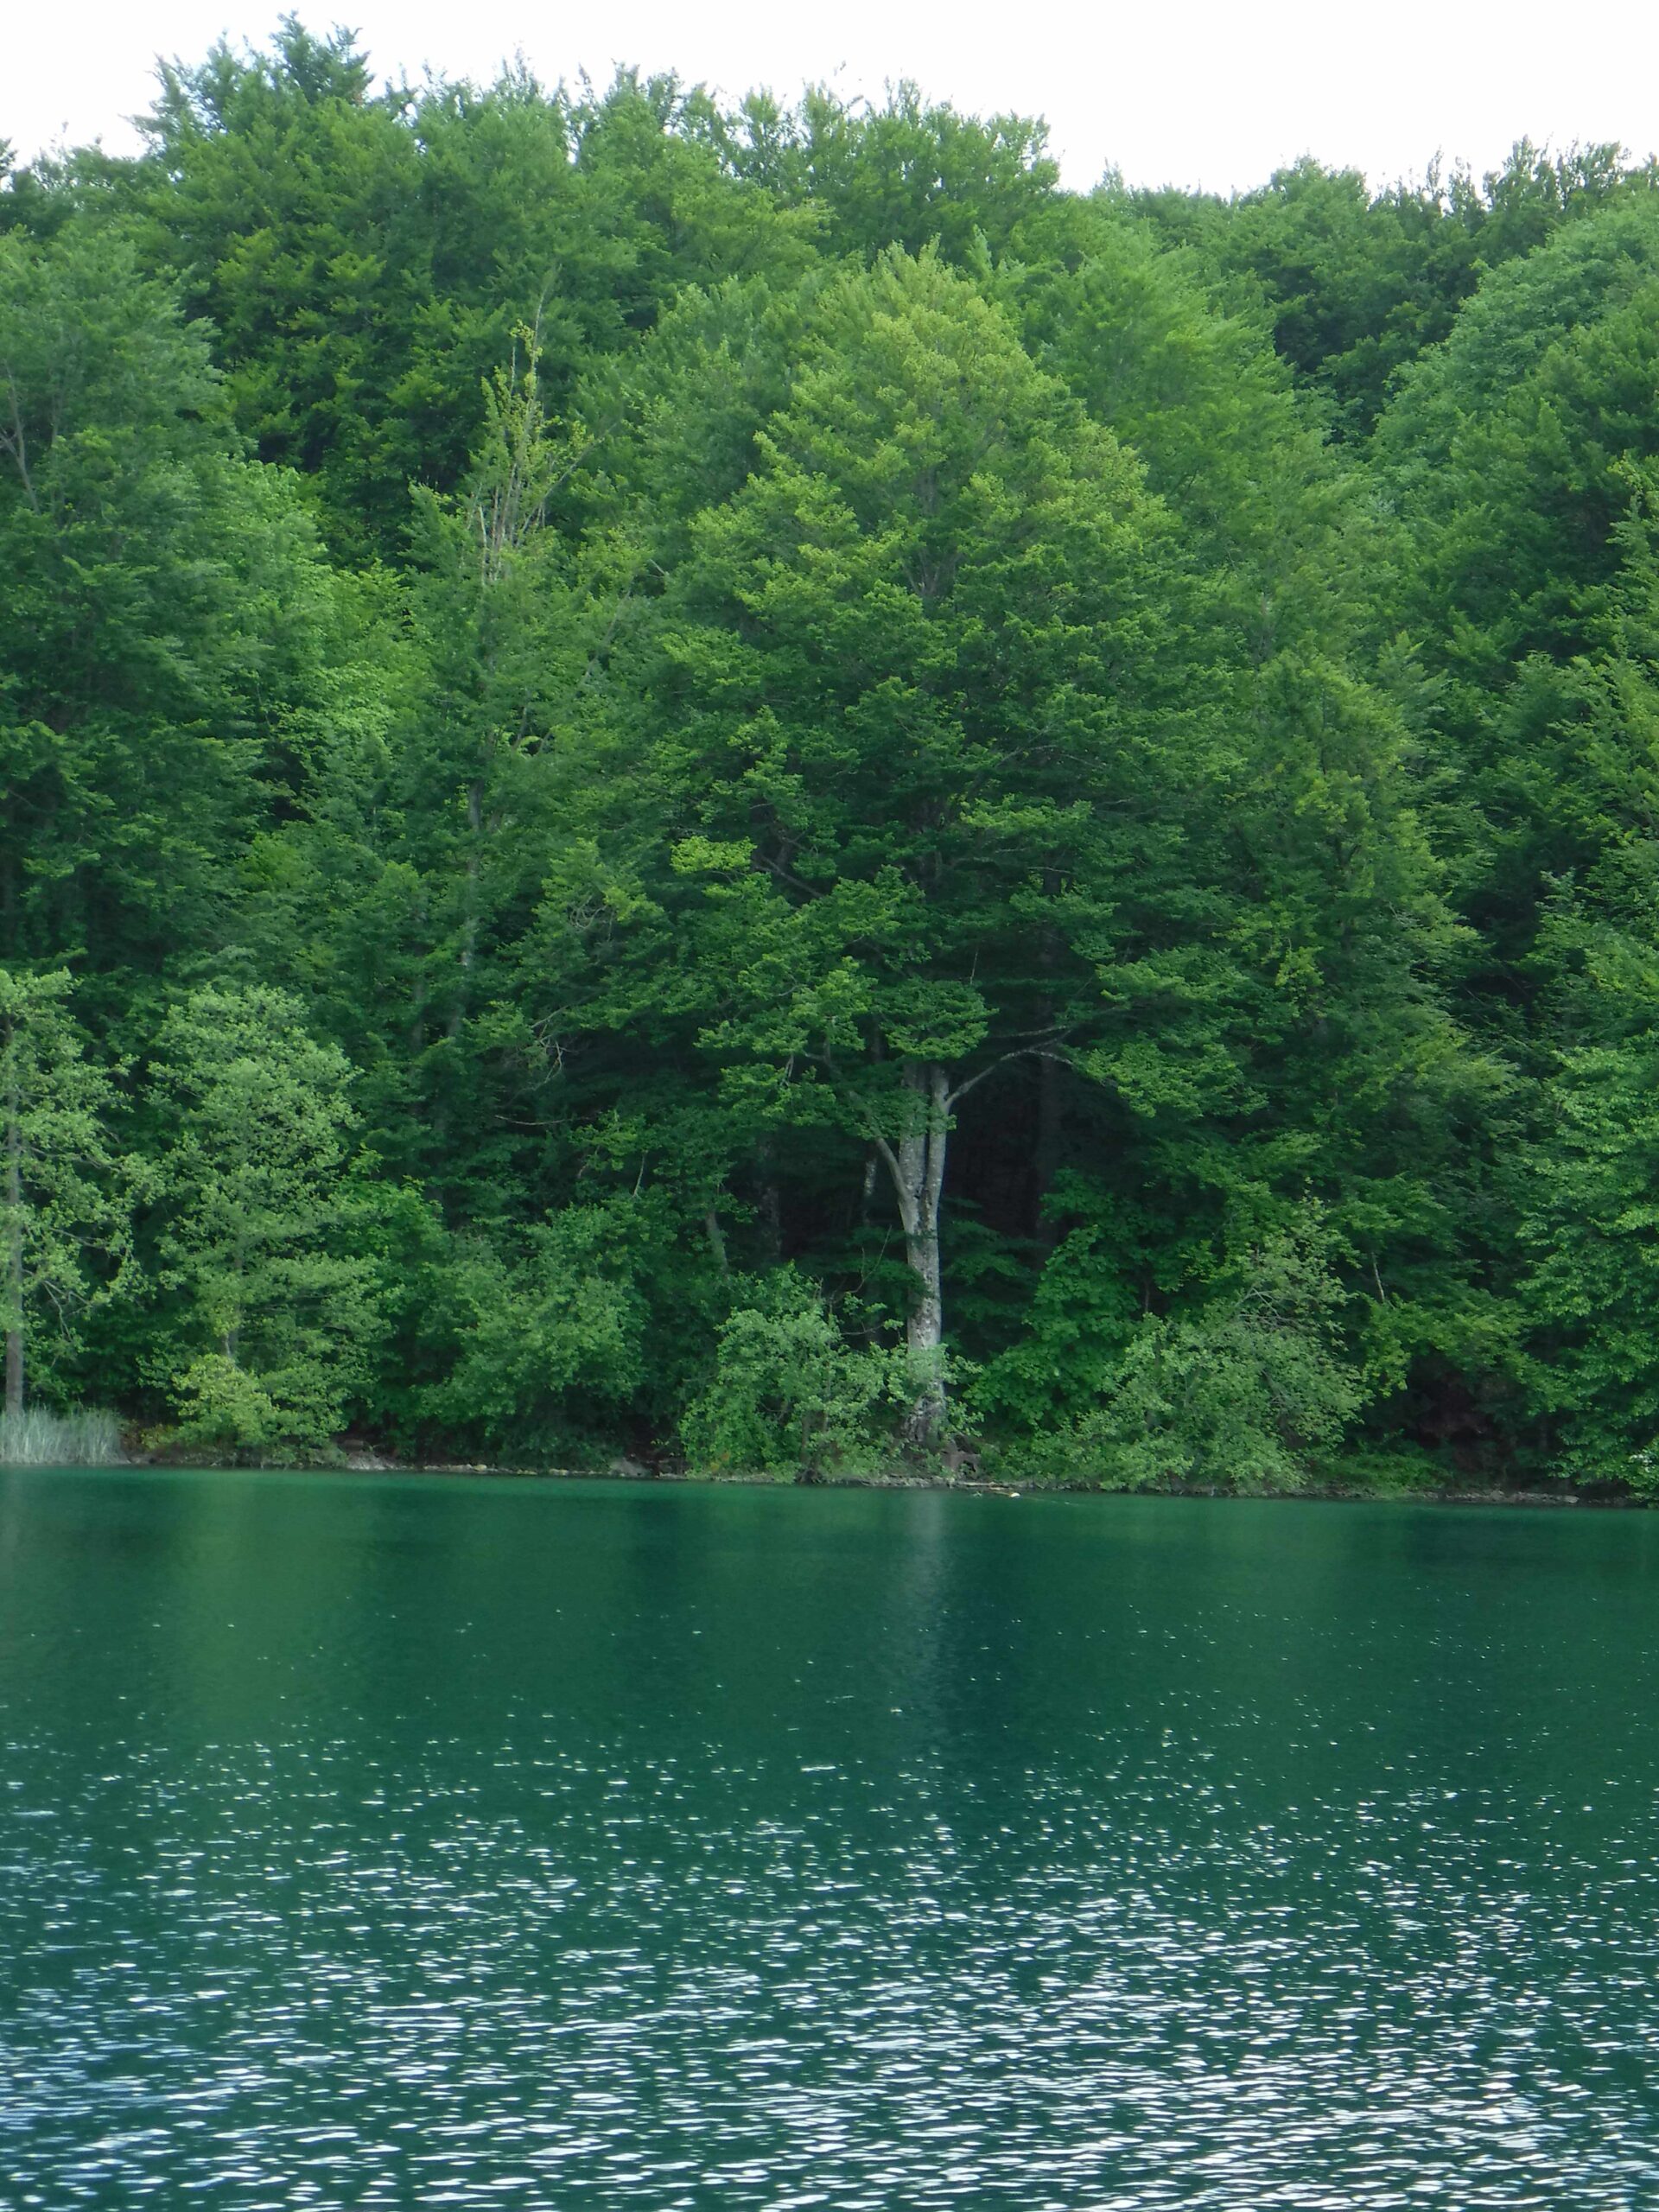
I am concerned that the forests at Plitvice National Park are composed of European beech, which is vulnerable to beech leaf disease if it arrives there.
Posted by Faith Campbell
We welcome comments that supplement or correct factual information, suggest new approaches, or promote thoughtful consideration. We post comments that disagree with us — but not those we judge to be not civil or inflammatory.
For a detailed discussion of the policies and practices that have allowed these pests to enter and spread – and that do not promote effective restoration strategies – review the Fading Forests report at http://treeimprovement.utk.edu/FadingForests.htm
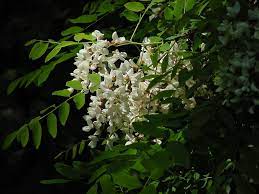
black locust – one of the most widespread invasive tree species on Earth; photo via Flickr
In recent years there has been an encouraging effort to examine bioinvasions writ large see earlier blogs re: costs of invasive species – here and here. One of these products is the Routledge Handbook of Biosecurity and Invasive Species (full citation at end of this blog). I have seen only the chapter on bioinvasion in forest ecosystems written by Sitzia et al. While they describe this situation around the globe, their examples are mostly from Europe.
Similar to other overviews, this article re-states the widely-accepted attribution of rising numbers of species introductions to globalization, especially trade. In so doing, Sitzia et al. assert that the solution is not to curtail trade and movement of people, but to improve scientific knowledge with the goal of strengthening biosecurity and control programs. As readers of this blog know, I have long advocated more aggressive application of stronger restrictions on the most high-risk pathways. Still, I applaud efforts to apply science to risk assessment.
Sitzia et al. attempt to provide a global perspective. They remind readers that all major forest ecosystems of Earth are undergoing significant change as a result of conversion to different land-uses; invasion by a wide range of non-native introduced species—including plants, insects, and mammals; and climate change. These change agents act individually and synergistically. Sitzia et al. give greater emphasis than other writers to managing the tree component of forests. They explain this focus by asserting that forest management could be either the major disturbance favoring spread of non-native species or, conversely, the only way to prevent further invasions. They explore these relationships with the goal of improving conservation of forest habitats.
Japanese stiltgrass invasion; photo by mightyjoepye via Flickr
Sitzia et al. focus first on plant invasions. They contend that – contrary to some expectations – plants can invade even dense forests despite competition for resources. They cite a recent assessment by Rejmánek & Richardson that identified 434 tree species that are invasive around Earth. Many of these species are from Asia, South America, Europe, and Australia. These non-native trees can drive not only changes in composition but also in conservation trajectories in natural forests. However, the example they cite, Japanese stilt grass (Microstegium vimineum) in the United States, is not a tree! Sitzia et al. note that in other cases it is difficult to separate the impacts of management decisions, native competitive species, and non-native species.
Sitzia et al. note that plant invasions might have a wide array of ecological impacts on forests. They attempt to distinguish between
“drivers” of environmental change – including those with such powerful effects that they call them “transformers”;
“passengers” whose invasions are facilitated by other changes in ecosystem properties; and
“backseat drivers” that benefit from changes to ecosystem processes or properties and cause additional changes to native plant communities.
An example of the last is black locust (Robinia pseudoacacia). This North American tree has naturalized on all continents. It is a good example of the management complexities raised by conflicting views of an invasive species’ value, since it is used for timber, firewood, and honey production.
Sitzia et al. then consider invasions by plant pathogens. They say that these invasions are one of the main causes of decline or extirpations in tree populations. I applaud their explicit recognition that even when a host is not driven to extinction, the strong and sudden reduction in tree numbers produces significant changes in the impacted ecosystems.
American chestnut – not extinct but ecological role gone; photo by F.T. Campbell
Sitzia et al. contend that social and economic factors determine the likelihood of a species’ transportation and introduction. Specifically, global trade in plants for planting is widely recognized as being responsible for the majority of introductions. Introductions via this pathway are difficult to regulate because of the economic importance (and political clout) of the ornamental plants industry, large volumes of plants traded, rapid changes in varieties available, and multiple origins of trade. As noted above, the authors seek to resolve these challenges by improving the scientific knowledge guiding biosecurity and control programs. In the case of plant pathogens, they suggest adopting innovative molecular techniques to improve interception efficiency, esp. in the case of latent fungi in asymptomatic plants.
The likelihood that a pathogen transported to a new region will establish is determined by biogeographic and ecological factors. Like other recent studies, Sitzia et al. attempt to identify important factors. They name a large and confusing combination of pathogen- and host-specific traits and ecosystem conditions. These include the fungus’ virulence, host specificity, and modes of action, reproduction, and dispersal, as well as the host’s abundance, demography, and phytosociology. A key attribute is the non-native fungus’ ability to exploit micro-organism-insect interactions in the introduced range. (A separate study by Raffa et al. listed Dutch elm disease as an example of this phenomenon.) I find it interesting that they also say that pathogens that attack both ornamental and forest trees spread faster. They do not discuss why this might be so. I suggest a possible explanation: the ornamental hosts are probably shipped over wide areas by the plant trade.
surviving elms in an urban environment; photo by F.T. Campbell
Sitzia et al. devote considerable attention to bioinvasions that involve symbiotic relationships between bark and ambrosia beetles and their associated fungi. These beetles are highly invasive and present high ecological risk in forest ecosystems. Since ambrosia beetle larvae feed on symbiotic fungi carried on and farmed by the adults inside the host trees, they are often polyphagous. Bark beetles feed on the tree host’s tissues directly, so they tend to develop in a more restricted number of hosts. Both can be transported in almost all kinds of wood products, where they are protected from environmental extremes and detection by inspectors. Sitzia et al. specify the usual suspects: wood packaging and plants for planting, as ideal pathways. These invasions threaten indigenous species by shifting the distribution and abundance of certain plants, altering habitats, and changing food supplies. The resulting damage to native forests induces severe alterations of the landscape and causes economic losses in tree plantations and managed forests. The latter losses are primarily in the high costs of eradication efforts – and their frequent failure.
Eucalyptus plantation in Kwa-Zulu-Natal, South Africa; photo by Kwa-Zulu-Natal Department of Transportation
Perhaps their greatest contribution is their warning about probable damage caused by invasive forest pests in tropical forests. (See an earlier blog about invasive pests in Africa.) Sitzia et al. believe that bark and ambrosia beetles introduced to tropical forests threaten to cause damage of the same magnitude as climate change and clear cutting, but there is little information about such introductions. Tropical forests are exposed to invading beetles in several ways:
1) A long history of plant movement has occurred between tropical regions. Sitzia et al. contend that the same traits sought for commercial production contribute to risk of invasion.
2) Logging and conversion of tropical forests into plantation forestry and agriculture entails movement of potentially invasive plants to new areas. Canopies, understory plant communities, and soils are all disturbed. Seeds, insects, and pathogens can be introduced via contaminated equipment.
3) Less developed nations are often at a disadvantage in managing potential invasion. Resources may be fewer, competing priorities more compelling, or potential threats less obvious.
Sitzia et al. call for development of invasive species management strategies that are relevant to and realistic for less developed countries. These strategies must account for interactions between non-native species and other aspects of global environmental change. Professional foresters have a role here. One clear need is to set out practices for dealing with conflicts between actors driven by contrasting forestry and conservation interests. These approaches should incorporate the goals of shielding protected areas, habitat types and species from bioinvasion risk. Sitzia et al. also discuss how to address the fact that many widely used forestry trees are invasive. (See my earlier blog about pines planted in New Zealand.)
planted forest in Sardinia, Italy; photo by Torvlag via Flickr
In Europe, bark beetle invasions have damaged an estimated ~124 M m2 between 1958 and 2001. Sitzia et al. report that the introduction rate of non-native scolytins has increased sharply. As in the US, many are from Asia. They expect this trend to increase in the future, following rising global trade and climate change. Southern – Mediterranean – Europe is especially vulnerable. The region has great habitat diversity; a large number of potential host trees; and the climate is dry and warm with mild winters. The region has a legacy of widespread planting of non-native trees which are now important components of the region’s economy, history and culture. These include a significant number of tree species that are controversial because they are – or appear to be – invasive. Thus, new problems related to invasive plants are likely to emerge.
Noting that different species and invasion stages require different action, Sitzia et al. point to forest planning as an important tool. Again the discussion centers on Europe. Individual states set forest policies. Two complications are the facts that nearly half of European forests are privately owned; and stakeholders differ in their understanding of the concept of “sustainability”. Does it mean ‘sustainable yield’ of timber? Or providing multiple goods and services? Or sustaining evolution of forest ecosystems with restrictions on the use of non-native species? Resolving these issues requires engagement of all the stakeholders.
Sitzia et al. say there has recently been progress. The Council of Europe issued a voluntary Code of Conduct on Invasive Alien Trees in 2017 that provides guidelines on key pathways. A workshop in 2019 elaborated global guidelines for the sustainable use of non-native tree species, based on the Bern Convention Code of Conduct on Invasive Alien Trees. The workshop issued eight recommendations:
Use native trees, or non-invasive non-native trees;
Comply with international, national, and regional regulations concerning non-native trees;
Be aware of the risk of bioinvasion and consider global change trends;
Design and adopt tailored practices for plantation site selection and silvicultural management;
Promote and implement early detection and rapid response programs;
Design and adopt practices for invasive non-native tree control, habitat restoration, and for dealing with highly modified ecosystems;
Engage with stakeholders on the risks posed by invasive NIS trees, the impacts caused, and the options for management; and
Develop and support global networks, collaborative research, and information sharing on native and non-native trees.
SOURCE
Sitzia, T., T. Campagnaro, G. Brundu, M. Faccoli, A. Santini and B.L. Webber. 2021 Forest Ecosystems. in Barker, K. and R.A. Francis. Routledge Handbook of Biosecurity and Invasive Species. ISBN 9780367763213
Posted by Faith Campbell
We welcome comments that supplement or correct factual information, suggest new approaches, or promote thoughtful consideration. We post comments that disagree with us — but not those we judge to be not civil or inflammatory.
For a detailed discussion of the policies and practices that have allowed these pests to enter and spread – and that do not promote effective restoration strategies – review the Fading Forests report at http://treeimprovement.utk.edu/FadingForests.htm
Platanus orientalis in Turkey; photo by Zeynek Zebeci
A current issue of the journal Forests (2022 Vol. 13) is a special issue focused on forest pests. This topic was chosen because of increased pest incursions. Choi and Park (full citations at the end of the blog) link this to climate change and increased international trade, as well as difficulties of predicting which pests will cause damage where.
The journal issue contains 15 papers. Several patterns appear throughout. First is the important role of international trade in living plants – “plants for planting” – in introductions. This is hardly news! A second pattern is that at least two North American species were introduced to Europe during the 1940s, probably in wood packaging used to transport military supplies during World War II.
This compilation provides the opportunity to review which organisms of North American origin have become damaging invaders in Eurasia — and sometimes other continents. For example, the journal carries four articles discussing pine wilt disease (PWD). It is caused by the North American nematode Bursaphelenchus xylophilus, and is vectored by wood-boring insects in the genus Monochamus. Beetles introduced from North America and those native to the invaded area are both involved. This disease is considered a severe threat to forest health globally. No apparent association with WWII exists for PWD.
Two fungal pathogens from North America cause serious damage in urban and natural forests of Europe and central Asia. Neither is discussed in the special issue:
Ceratocystis platani has devastated urban trees in the Platanus genus, especially the “London plane” hybrid, and the native European tree, Platanus orientalis. This fungus was accidentally introduced to southern Europe during WWII – as were the two insects described by Musolin et al. It was first reported in northern Italy and Mediterranean France in the early 1970s, but disease symptoms had been observed years earlier. C. platani is established across the northern rim of the Mediterranean and to the east in Armenia and Iran. The worst damage has been in Greece, especially in natural forest stands in riparian areas. Spread of the pathogen there is facilitated by root grafts and by tree wounds caused by floating wooden debris during floods (Tsopelas et al. 2017.)
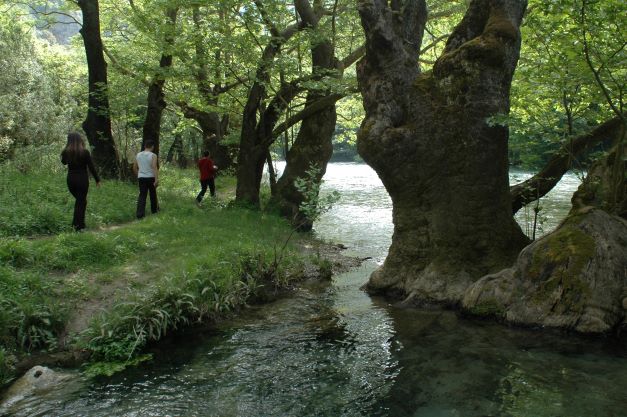
Platanus orientalis along Voidomatis River in Greece; photo by Onno Zweers, via Wikimedia
Heterobasidion irregulare infects conifers. It has spread and killed large numbers of Italian stone pine (Pinus pinea). The disease was inadvertently introduced to central Italy in the 1940s. H. irregulare has greater sporulation potential and decays wood more quickly than the native congener H. annosum. H. irregulare appears to be replacing the European species; scientists fear it will exacerbate tree infection and mortality rates (Garbelotto, Leone, and Martiniuc. date?)
A third North American pathogen, sooty bark disease (Cryptostroma corticale) has been introduced to Europe. This disease, found on sugar maple in eastern North America, was detected in Great Britain in 1945; it is now throughout Europe (Tanney 2022). EPPO reports that it is widespread in western Europe and in some Balkan countries. The website provides no information on its impact in Europe.
Pests in Russia
A paper authored by Musolin, et al. discusses 14 species of invasive or emerging tree pests found in Russian forest and urban ecosystems. Of these, two are native to North America. Another eight pose a threat to North America if they are introduced here.
As Musolin et al. point out, Russia covers a huge territory across Europe and Asia – stretching 10,500 km, or 6,500 miles. These encompass a great variety of ecological zones. Russia is also actively involved in international trade. It is not surprising, then, numerous non-native organisms have been introduced.
As of 2011, 192 species of phytophagous non-native insects from 48 families and eight orders were documented in the European part of Russia. This number does not include the vast areas in Asian Russia. Additional introductions have probably occurred in the most recent decade. Some of these introduced species have cause significant economic losses. Still, Russia appears to rarely mount a serious control effort.
Of course, the opposite is also true: pests native to some part of Russia can be transported to new regions of Russia or beyond its borders. We North Americans have focused on various species of tussock moths (Lymantria spp., etc.). There are many others. Musolin et al. describe eight in detail. All the information in this blog are from that article unless otherwise indicated.
Two North American Species’ Damage in Eurasia
Both these introductions were detected around the year 2000. Was there some event – other than simply expanding trade – that might explain these introductions?
Leptoglossus occidentalis; photo by nutmeg66 via Flickr
Western Coniferous Seed Bug, Leptoglossus occidentalis
This insect from western North America has invaded Eurasia, North Africa, and Central America. The first detection in Europe was in 1999 in Italy. It spread quickly and is present now from Morocco to Japan, as well as in South Africa and South America. The seed bug is spreading northward in European Russia, including into the forest-steppe zone. Its ability to spread to the East is uncertain.
L. occidentalis attacks a wide range of Pinaceae and Cupressaceae. In the Mediterranean region it has had serious impacts on the pine nut supply (Ana Farinha, IUFRO, Prague, September 2021). In southern parts of Russia it has caused “significant damage”. L. occidentalis also vectors a pathogenic fungus Sphaeropsis sapinea (=Diplodia pinea), which causes diplodia tip blight. The cumulative damage of insect and pathogen to pines can be significant.
The introduction pathway to Russia is unknown. It might have flown from established populations in Europe, or it might have been transported on plants for planting or Christmas decorations.
Oak Lace Bug, Corythucha arcuata
This insect is widespread in the United States and southern Canada. It was first detected in Europe – again, Italy – in 2000. Twenty years later it has spread to almost 20 countries.
Russia was invaded relatively recently; the first outbreak was detected in 2015 in the subtropical zone along the Black Sea coast and Caucasus. Musolin et al. expect the lace bug to spread to natural forests of Central Asia and other countries of the Caucasus. Its spread will be assisted by air currents and movement of plants for planting. The insect is causing considerable aesthetic damage, but other impacts have not been estimated.
Hosts include many species of oak (Quercus spp.), European and American chestnuts (Castanea spp.) plus trees from other botanical families: willows and maples (Salicaceae), redbay (Fagaceae), and alder (Betulaceae).
Pests in Russia that Could Damage North America if Introduced Here
Malus sierversii; photo by Lukacz Szczurowski via Wikimedia
Threat to Apples — Apple Buprestid, Agrilus mali
This Asian beetle has caused extensive mortality of wild apple (Malus sieversii) forests in Xinjiang, China. Wild apple trees are important components of deciduous forests in the Central Asian mountains. The species is also an ancestor of the domestic apple tree. Consequently, the borer is considered a potential threat to cultivated apple trees – presumably everywhere. A. mali might also attack other fruit trees in the Rose family, i.e., Prunus (plums, cherries, peaches, apricots, almonds) and Pyrus (pears).
Unlike most of the other species described here, A. mali is a quarantine pest in Russia and across Europe and the Mediterranean regions – the region where phytosanitary policies are coordinated by the European and Mediterranean Plant Protection Organization (EPPO). Russia bans imports of apple seedlings from infested areas.
China is reported to be experimenting with a possible biocontrol agent, Sclerodermus pupariae (a parasitoid of emerald ash borer).
Threat to Pines and Firs, Already Under Invasive Species Threats
Small Spruce Bark Beetle, Ips amitinus
This European beetle has been considered a secondary pest of dying conifers. Over the last 100 years, it has moved farther North. The first Russian record was 100 years ago, in the region where Russia, Belarus, and Ukraine meet. (Did military action during World War I play a role? This is not discussed by the authors.) By 2022, the beetle occupies 31 million ha. It is probably spread through transport of logs by rail.
In Western Siberia, the spruce beetle has attacked a new host, Siberian pine (Pinus sibirica).
The danger to North America arises from this beetle’s preference for five-needle pines (genus Pinus section Quinquefoliae). North America’s five-needle pines are already under severe pressure from the introduced pathogen white pine blister rust (Cornartium ribicola) and the native mountain pine beetle (Dendroctonus ponderosae).
Four-Eyed Fir Bark Beetle, Polygraphus proximus
This East Asian beetle feeds on firs (Abies spp.). Less commonly, it feeds on other genera in the Pinaceae: spruce (Picea ), pines (Pinus), larch (Larix), hemlock (Tsuga).
This beetle has been spreading west; the first substantiated record in European Russia was 2006 in Moscow. The beetle was probably present in western Siberia in the 1960s, although it was not detected until 2008. Again, the probable pathway of spread is movement of lumber by railroad.
P. proximus vectors an obligate symbiotic fungus, which can rapidly weaken the host. Musolin et al. comment on the beetle’s impacts – which they rarely do in this article. (Does this signify more damaging impacts, or availability of past studies?) They note significant changes in the forests’ ecosystem structure and microclimate, vegetation cover, and local insect fauna.
The danger to North America arises from this beetle’s preference for firs from the sections Balsamea and Grandis. Many North American firs are in these sections, including Fraser fir (Abies fraseri), balsam fir (A. balsamea), subalpine fir (A. lasiocarpa), grand fir (A. grandis), white fir (A. concolor), and others. Several of these firs already are challenged by the introduced balsam woolly adelgid. Firs in central and western Europe are less vulnerable since they are in the section Abies, which the beetle prefers less.
Threats to Poplars
Spotted Poplar Borer,Agrilus fleischeri
This boring beetle is native to northern Asia. It has caused significant mortality in native and exotic Populus plantations in China. Although there have been no reports of this beetle moving beyond its native range, many other Agrilus species have. Canada has twice intercepted adult spotted poplar borers on wood packaging. Musolin et al. fear that the adoption of non-native hosts might trigger an outbreak that would facilitate spread.
Poplar Leafminer, Phyllonorycter populifoliella
balsam poplar; photo by Matt Lavin via Flickr
This micromoth is widely distributed across the Palearctic. It was recently detected on introduced poplars growing in India.
The danger to North America arises from the beetle’s preference for black and balsam poplars. Several species in these taxonomic groups are common in North America, including Populus balsamifera, P. trichocarpa, P. deltoides, and Populus × Canadensis.
Threat to Oaks — Leaf Blotch Miner Moth, Acrocercops brongniardella
This micromoth is widely distributed in Europe and expanding to the north. The pest mines the leaves of several oak species (Quercus spp.), especially English oak, Q. robur; and sometimes European chestnut (Castanea sativa). Leaf blotch miner is considered one of the most important folivore insect pests of oaks in Russia. Damage has been greater in Omsk Oblast (Siberia), where both English oak and the micromoth are introduced species, than in St. Petersburg, which is on the northern limit of their natural range. Musolin et al. fear that the warming climate will lead to the pest causing greater damage in the northern portions of its range.
Threat to Basswood — Lime Leaf Miner, Phyllonorycter issikii
This Asian moth has been moving west since the mid-1980s. It now occupies most of European Russia with some outbreaks in Siberia. In Europe, it is a conspicuous pest of Tilia species.
In these invaded regions, the leaf miner has shifted to novel hosts, including American basswood (T. americana). Basswood is a common plant in the eastern deciduous forest of North America.
Threat to Horse Chestnuts & Urban Trees — Horse-Chestnut Leaf Miner, Cameraria ohridella
This tiny moth was unknown to science before the first recorded outbreak in the late 1980s. Over the next three decades it spread to most of Europe, where horse chestnut (Aesculus hippocastanum)has been widely planted for three centuries. It has caused significant damage.
The first Russian detection was in Kaliningrad, on the shores of the Baltic Sea, in 2003. The leaf miner now occupies 69% of administrative units of European Russia. It is considered one of the Top 100 most dangerous invasive species in Russia.
In North America, the moth might attack native horse chestnuts, Ae. octandra (=flava) and Ae. glabra. Urban plantings are at particular risk because the leaf miner might attack both European horse chestnuts and two non-native maples that have been planted widely, sycamore maple (Acer pseudoplatanus) and Norway maple (A. platanoides). Data cited by Musolin et al. are contradictory regarding larval development on the maples. Once introduced, the leaf miner is difficult to contain because it spreads through natural flight of adults, wind-blown leaves, hitchhiking on vehicles, and movement of infected plants.
Shared Pests
Russia has been invaded by two species that have been introduced in many countries (beyond pine wilt nematode). These two entered the country on plants for planting being imported to landscape venues for the XXII Winter Olympic Games – held in Sochi in 2014.
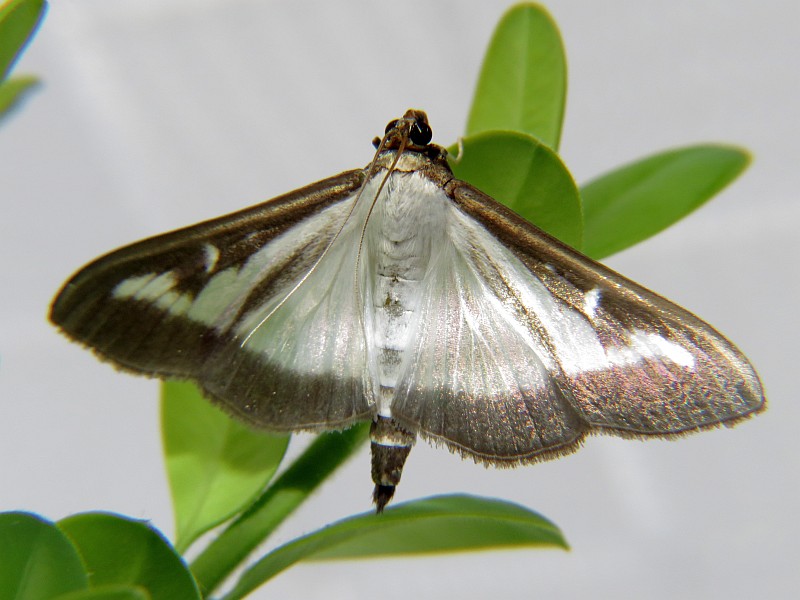
First to arrive was the Box Tree Moth, Cydalima perspectalis. This East Asian species was first detected outside its native range in Germany in 2006. By 2011 it was widespread in European and Mediterranean countries. In 2021, the boxwood moth was found in North America (first Canada, then the United States). [I discuss the boxwood moth briefly here.]
boxtree moth; photographer unknown
In Russia, box tree moth larvae were first recorded in 2012 on the planting stock of its principal host, Buxus sempervirens. The moth quickly spread around the Black Sea region and to the North Caucasus. It spread farther, too: it reached the Kaliningrad Oblast (southeast coast of the Baltic Sea) in 2020. The main pathway of C. perspectalis invasion was the introduction of infested box-wood planting material.
Further spread of C. perspectalis is likely from Russia into the natural forests across the Caucasus (Transcaucasia) and to countries located further south. This is most distressing because the region has extensive natural forests of Buxus sempervirens. In 2015–2017, C. perspectalis almost completely destroyed the natural boxwood populationsin these regions of Russia and further eastwards in Abkhazia. Boxwood stands in Georgia and northern Iran are already suffering intensive defoliation as the result of infection by two non-native pathogens, Calonectria pseudonaviculata [synonym Cylindrocladium buxicola] and Calonectria henricotiae. Damage to these forests could lead to reductions in soil stability and subsequent declines in water quality and flood protection, changes in forest structure and composition, and declines in Buxus-associated biodiversity (at least 63 species of lichens, fungi, chromista and invertebrates might be obligate). (In December 2022, Iryna Matsiakh presented a compelling overview of threats to these forests in a webinar sponsored by the Horticulture Research Initiative; apparently no recording is available.)
The second global invader to appear was the Brown Marmorated Stink Bug, Halyomorpha halys.
This insect from southeast and east Asia invaded the United States in 1996. The first detection in Europe was in Liechtenstein in 2004. In both cases, it spread quickly across these continents.
Russia’s first detection of stinkbug was in 2014 in parks in Sochi and elsewhere along the Black Sea coast. The spread in Russia appears to have been limited to the Black Sea – Caucasus area.
The brown marmorated stinkbug is highly polyphagous, feeding on more than 300 species of plants. In southern Russia, 107 species have been documented as hosts. At times, stinkbug feeding has caused severe losses in yields of fruit and vegetable crops.
Patterns
Musolin et al. stress the importance of the pest shifting to new hosts–usually from the same or a closely related genus. They cite several examples of these shifts occurring in the pest’s native range, including Agrilus planipennis (from local Asian ash species to introduced North American ash species); Phyllonorycter populifoliella and Agrilus fleischeri (from local poplars to widely cultivated introduced North American poplars and hybrids); Agrilus mali (from cultivated to wild apples).
As I noted above, the introduction and spread pathways are the usual ones: plants for planting (three species) and shipments of logs. There is one indication of wood packaging – Spotted Poplar Borer, Agrilus fleischeri at the Canadian border.
Garbelotto, M., G. Lione, and A.V. Martiniuc. date? The alien invasive forest pathogen Heterobasidion irregulare is replacing the native Heterobasidion annosum. Biological Invasions https://doi.org/10.1007/s10530-022-02775-w
Musolin, D.L.; Kirichenko, N.I.; Karpun, N.N.; Aksenenko, E.V.; Golub, V.B.; Kerchev, I.A.; Mandelshtam, M.Y.; Vasaitis, R.; Volkovitsh, M.G.; Zhuravleva, E.N.; et al. Invasive insect pests of forests and urban trees in Russia: Origin, pathways, damage, and management. Forests 2022, 13, 521.
Tanney, J. Forest Health Challenges Exacerbated by a Changing Climate: Swiss Needle Cast and Sooty Bark Disease in B.C. 65th ANNUAL FOREST PEST MANAGEMENT FORUM (Canada). December 7, 2022.
Tsopelas, P., A. Santini, M.J. Wingfield, and Z.W. de Beer. Canker Stain: A Lethal Disease Destroying Iconic Plane Trees. Plant Disease 2017. 101-645-658 American Phytopathological Society
A special issue of the journal Forests (Vol. 13 2022) seeks to improve understanding of the root causes of exacerbated threats from insect pests. The issue contains 15 papers; most focus on geographic areas other than North America. The journal is open access!
Choi and Park (full citations below) link increased pest risk to climate change and increased international trade. They provide brief summaries of all 15 papers. My focus here is on two articles that provide updates on the status of the emerald ash borer (EAB Agrilus planipennis) in Russia and Ukraine. The article by Davydenko et al. also examines interactions between EAB and the invasive pathogen Hymenoscyphus fraxineus, which causes ash dieback disease. In other blogs I will look at insects linked to North America (both species from North America that threaten forests on other continents, and species in Russia that pose a threat to North America) and at the overall Russian experience.
I blogged about EAB invasion of Russia in April 2021 so this is an update.
Musolin et al. (2022) (full citations below) remind us that the EAB invasions of North America and Russia were detected almost simultaneously: in Michigan and Ontario in 2002 and in European Russia (Moscow) in 2003. They conclude that both invasions probably originated from a common source (most probably China). They date the introduction to the late 1980s or early 1990s; pathways might have been wooden crafts, wood packaging, or ash seedlings. Nate Siegert used dendrological studies to estimate a similar introduction date for the North American invasion.
European ash (Fraxinus excelsior) specimen in Belgium; photo by Jean-Pol Granmont
EAB has spread far in the intervening 30 + years. By early 2022, outbreaks were recorded in five Canadian provinces, 35 US states, 18 provinces and several cities in European Russia, and two provinces in Ukraine (Musolin et al. 2022) Davydenko et al. report that EAB had also established in eastern Belarus, but provide no details.
As demonstrated in the earlier blog and confirmed by Musolin et al. (2022) and Davydenko et al., the EAB has spread much faster to the southwest than directly West and to the Northwest. Davydenko et al. attribute the slower spread in the St. Petersburg area to the colder and wetter climate of this region – which is ~1200 km north of Ukraine. While the EAB reproduces in two cohorts in Eastern Ukraine, to the north the beetle requires more than one year to complete its life cycle, at least two years in the St. Petersburg area. In 2021, Musolin et al. 2021 speculated that pressure by the native parasitoid Spathius polonicus Niezabitowski might also be slowing EAB’s spread in the North. In 2022, Musolin does not address this possibility. (I note that APHIS has approved two Spathius species as biocontrol agents in the U.S.).
Musolin et al. (2022) and Davydenko et al. agree that the EAB poses real threat to ash in central and western Europe. In both the south (Davydenko et al.) and in the northwestern area around St. Petersburg ash grows in continuous stretches, linking Russia or Ukraine to Romania, Hungary, Slovakia, and Poland. These ash consist of both natural woodlands, and extensive plantings of both one of the European ash species, F. excelsior and the highly-susceptible North America green ash (F. pennsyvanica). Furthermore, the EAB is an excellent hitchhiker on vehicles & railway cars. Davydenko et al. also consider the beetle to be a strong flyer. Musolin et al. (2022) cite a separate analysis in stating that EAB can probably invade most European countries. Only some regions of Norway, Sweden, Finland, Ireland, and Great Britain are probably protected by their low temperatures.
Both articles were written too early to consider how the current war in the relevant area of Ukraine might affect spread of the EAB, although we know Ukrainians are cutting firewood. The war has certainly interrupted monitoring and other efforts.
The sources agree on EAB’s severe impacts. Musolin et al. (2022) notes that the beetle has killed millions of trees in the forests and urban plantings in North America, European Russia, and Eastern Ukraine. Davydenko et al. note that the Fraxinus genus is one of the most widely distributed tree genera in North America. They then assert that the EAB could virtually eliminate it. I know that North American scientists agree that the beetle threatens many species in the genus; but do they agree that the genus would be “virtually eliminated”? Davydenko et al. think the EAB could pose similar threat to Euro ash F. excelsior.
Musolin et al. 2022 estimate that potential economic losses in Europe could reach US$1.81 billion. By this indicator, the species ranks fourth among the most “costly” invasive pests. Russia spent an estimated US$258.9 million between 2011 and 2016.
areas of Ukraine where studies conducted
Species’ varying vulnerability
Musolin et al. (2022) cite experience in the Moscow Botanical Garden as showing that only two Asian species — Chinese ash, F. chinensis, and Manchurian ash, F. mandshurica — are were resistant to the EAB. The beetle killed both North American ash (i.e., F. pennsylvanica and F. americana) and European ash (i.e., F. excelsior, F. angustifolia, and F. ornus).
Experience in the field in Ukraine (Davydenko et al.) suggests that F. excelsior is less vulnerable to EAB than F. pennsyvanica. The overwhelming majority of EAB infestations were found on the American species. Furthermore, although similar densities of EAB larvae were found in colonized branches of both species, the proportion of larvae that were viable was significantly higher on F. pennsyvnica (91.4%) than on F. excelsior (76.1%). However, the reverse was found in the Moscow and St. Petersburg regions. Davydenko et al. don’t address directly whether they think this discrepancy is attributable to climatic factors or to differences in vulnerability between trees growing in native forests vs. human plantings. They did note that all observed cases of infestation of the native F. excelsior in Ukraine occurred in artificial plantings rather than in natural woodlands.
Davydenko et al. studied parts of Eastern Ukraine where EAB was entering areas already infected by the invasive ascomycete fungus Hymenoscyphus fraxineus (cause of ash dieback, ADB). [Two of these regions — Luhansk and Kharkiv – have been the very center of the current war.] Other studies have shown that ~1 to 5% of F. excelsior trees exhibit some resistance to ADB. These trees are thus a potential foundation for future propagation and restoration of ash in Europe – if enough of them survive attack by EAB.
They found that F. excelsior is more resistant to EAB than F. pennsylvanica, but more susceptible to ADB.
The Luhansk and Kharkiv regions have both EAB and ADB; the Sumy region has only the pathogen. EAB probably invaded the Luhansk region by 2016 (although it was detected only in 2019). The proportion of ash trees (both native and introduced species) infested rose from ~ 10–30% in 2019 to 60 – 90% by 2020–2021. The EAB arrived later in the Kharkiv region, to the Northwest, but the proportion of infested trees was similar by 2021. Combining the two regions, 75% of F. pennsylvanica trees were EAB-infested, whereas only 31% of F. excelsior trees were.
Frequencies of infections by ADB were the reverse. Pooled data from all three study regions showed 21% of F. pennsylvanica trees were infected vs. 42% of F. excelsior. In the plots invaded by both EAB and ADB (in Luhansk and Kherson regions), 4%of F. pennsylvanica were affected by both invasive species vs. 14% of F. excelsior trees. Davydenko et al. conclude that ADB facilitates EAB attack on F. excelsior trees
The impact of EAB is seen in the fact that overall mortality rates were higher in F. pennsylvanica despite the fact that in the Sumy region mortality rates were higher in F. excelsior because of the disease (EAB was absent from this region). On the other hand, EAB infests and kills F. pennsylvanica trees regardless of their prior health condition (i.e., regardless of presence/absence of ADB).
Still, fewer than half the F. excelsior trees in sites affected by both EAB & ADB (in Luhansk and Kherson regions) have died. Davydenko et al. think the survivors constitute a source of material for eventual propagation. These trees need to be carefully mapped – a task certainly not facilitated by the war!
Davydenko et al. conclude that
1. Invasion of EAB in Ukraine occurred 2–3 years before detection in 2019 [I think this is actually quite prompt for detection of EAB invasions]; the invasion is currently expanding both in terms of newly infested trees and invaded geographic area.
2. Fraxinus excelsior (at least when growing in the interior of forest stands) is more resistant to EAB than F. pennsylvanica (when growing in field shelterbelts).
3. Fraxinus excelsior is more susceptible to ADB than F. pennsylvanica.
4. Infection by ADB is likely to predispose F. excelsior to infestation by EAB.
5. Ash trees infected by ADB are predisposed for the colonization by ash bark beetles Hylesinus spp. [I did not discuss these data.]
6. Inventory and mapping of surviving F. excelsior, affected by both ADB and EAB, is necessary to acquire genetic resources for the work on strategic, long-term restoration of devastated areas, thereby tackling a possible invasion of EAB to the EU.
I was surprised that Musolin et al. (2022) think EAB’s host shift from local Asian ash species to introduced North America ash planted in the Russian Far East and China triggered EAB outbreaks in Eastern China that contributed to the beetle’s introduction to North America and European Russia. American scientists apparently agree — Haack et al. (2022) refer to both this episode and a similar to one posited for Asian longhorned beetle (Anoplophora glabripennis) — that widespread planting of Populus plantations led to rapid expansion of ALB in northern China, and the pest-weakened wood was then used in wood packaging.
Davydenko, K.; Skrylnyk, Y.; Borysenko, O.; Menkis, A.; Vysotska, N.; Meshkova, V.; Olson, Å.; Elfstrand, M.; Vasaitis, R. Invasion of emerald ash borer Agrilus planipennis and ash dieback pathogen Hymenoscyphus fraxineus in Ukraine-A concerted action. Forests 2022, 13, 789.
Haack RA, Hardin JA, Caton BP and Petrice TR (2022) Wood borer detection rates on wood packaging materials entering the United States during different phases of ISPM#15 implementation and regulatory changes. Front. For. Glob. Change 5:1069117. doi: 10.3389/ffgc.2022.1069117
Musolin, D.L.; Selikhovkin, A.V.; Peregudova, E.Y.; Popovichev, B.G.; Mandelshtam, M.Y.; Baranchikov, Y.N.; Vasaitis, R. North-Westward Expansion of the Invasive Range of EAB, Agrilus planipennis Fairmaire (Coleoptera: Buprestidae) towards the EU: From Moscow to Saint Petersburg. Forests 2021, 12, 502. https://doi.org/10.3390/f12040502
Musolin, D.L.; Kirichenko, N.I.; Karpun, N.N.; Aksenenko, E.V.; Golub, V.B.; Kerchev, I.A.; Mandelshtam, M.Y.; Vasaitis, R.; Volkovitsh, M.G.; Zhuravleva, E.N.; et al. Invasive insect pests of forests and urban trees in Russia: Origin, pathways, damage, and management. Forests 2022, 13, 521.
Siegert, N.W. 2006. 17th USDA Interagency Research Forum on Gypsy Moth and Other Invasive Species. Annapolis, MD. January 10-13, 2006.
Posted by Faith Campbell
We welcome comments that supplement or correct factual information, suggest new approaches, or promote thoughtful consideration. We post comments that disagree with us — but not those we judge to be not civil or inflammatory.
For a detailed discussion of the policies and practices that have allowed these pests to enter and spread – and that do not promote effective restoration strategies – review the Fading Forests report at http://treeimprovement.utk.edu/FadingForests.htm
In a new paper, “Forest Resources of the World: Present Status and Future Prospects,” Singh et al. affirm the importance of forests for terrestrial biodiversity, provision of multiple ecosystem services, and supporting the economic well-being of approximately 1.6 billion people directly. This equals about a quarter of Earth’s population. The authors conclude that achieving global Sustainable Development Goals (SDGs), including poverty reduction, food security, and mitigating and adapting to climate change — all depend on sustaining forests.
According to the 2020 Global Forest Resource Assessment, Earth’s forested area comprises ~4.06 billion hectares, or 31% of the total land surface.More than half (54%) of all global forest area is found in five countries: the Russian Federation, Brazil, Canada, the United States, and China. Tropical forests constitute 45% of this total; boreal forests, 27%; temperate forests, 16%; and subtropical forests, 11%. An estimated 93% (3.75 billion ha) regenerate through natural processes; 7% (290 million ha) is planted forest.
The extent of global forest area has been declining for decades but the rate of loss slowed significantly between 1990 and 2020. This reflects decreased deforestation in some countries and an increase in forest area in others. The latter is due to both afforestation and also natural forest growth. However, conversion of tropical forests to agriculture continues apace. From 2010 to 2020, the net loss of forest area was highest in Africa (3.9 million ha) and South America (2.6 million ha). Increases in net forest area occurred in Asia, Oceania and Europe. The status of the top 10 countries or territories in global forest resources as of 2020 is given in Table 1.2 of the chapter. [News sources document that rapid deforestation continues in Brazil, at least.]
Several trends are concerning to those of us who value primary or undisturbed forests. First, the area of naturally regenerating forest has decreased, while the area of planted forest has expanded – but only by 123 million ha. In the last decade, the rate of increase in the area of planted forests has also slowed.
Second, total carbon stock in forests declined from 668 gigatons to 662 gt in 1990–2020. This is only 6%, but it is trending in the wrong direction. As we know, forest conservation counters climate change in two ways: conserved forests are a carbon sink, while degraded or destroyed forests are a significant source of atmospheric CO2. In fact, forests are the 2nd largest storehouses of carbon, after oceans. Global forests sequester about one-third of total CO2 emission from the combustion of fossil fuels. Almost all forest carbon is found in living biomass (44%) and soil organic matter (45%).
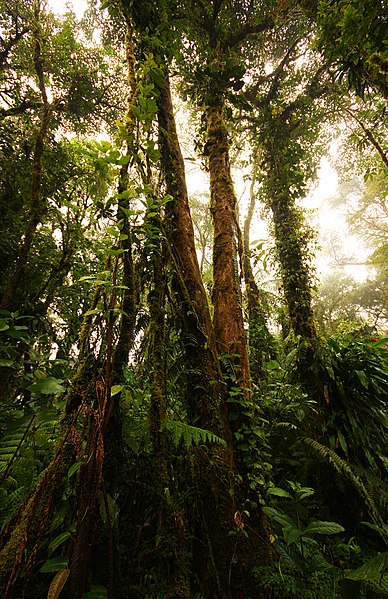
Costa Rican rainforest; photo by eflon via Flickr
Third, primary forests are already severely reduced and continue to shrink. Primary forests are those composed of native species, and supporting relatively undisturbed ecological processes. They are irreplaceable for sustaining biological diversity. These forests are already severely reduced – they cover only ~ 1 billion ha. Since 1990, the extent of primary forest has decreased by 81 million ha. More than half are in Brazil, Canada, and Russia.
Singh et al. report that only about 10% of the world’s forests are set aside for biodiversity conservation. Again, trends are in the wrong direction. The rate of increase in the area of forest designated largely for biodiversity conservation has slowed. On the other hand, forest areas designated for other non-extractive purposes have increased: soil and water conservation, recreation, tourism, education, research, and the protection of cultural and spiritual sites.
Singh et al. are cheered by the fact that more than 2 billion hectares are under management with well-defined management plans. The extent of forests under management plans has increased by 233 million ha since 2000.
Singh et al. say that continuously increasing anthropogenic pressure is the main cause of deforestation and forest degradation in unmanaged forests. Citing projections that the world’s population will reach almost 10 billion by 2050, they say this growth will make reconciling the need for forest conservation with the basic requirements of humans for food, shelter, and fuel more difficult than ever.
I appreciate this honesty. Too many experts interviewed on the day that the global population was estimated at 8 billion made optimistic statements about the consequences. They mentioned Earth’s carrying capacity only in reference to First World people demanding excessive resources. There was minimal discussion of humanity’s carbon footprint and no reference to ever-increasing threats to biological diversity. Nor to the fact that people in developing countries want to raise their standards of living – which entails higher demand for resources, including energy. For an example, see The Washington Post editorial, here.
On the other hand, Ruby Mellen in the Post on 15 November mentioned that, according to the World Wildlife Fund, 75% of Earth’s ice-free land has been significantly altered by people, and two-thirds of mammal, fish, reptile, and amphibian species have become endangered in the last ~50 years. Unfortunately, the on-line version of the paper doesn’t have this specific article!
fires in Siberian forest in 2016; European Space Agency
Threats to Forests: Fire
Singh et al. rank fire as the most disastrous threat, affecting biodiversity and carbon sequestration potential. According to the U.N. Food and Agriculture Organization, about 29% of the total geographical area in the world was affected by forest fires during 2001–2018; more than two-thirds of these fires occurred in Africa. U.S. media, however, focused on fires in the Amazon, temperate areas (U.S., Europe), and, sometimes, boreal forests or Australia. Singh et al. say that areas that are frequently affected by fire are prone to other types of disturbances like drought and outbreaks of insect pests.
tanoaks killed by Phytophthora ramorum in Oregon; photo by Oregon Department of Forestry
Threats to Forests: Diseases and Pests
I am glad that Singh et al. recognize the damage to forest productivity caused by disease and pest infestations. In doing so, they cite familiar sources – Clive Brasier, Peter Vitousek, Juliann Aukema, Gary Lovett, Sandy Liebhold, Kerry Britton, Bitty Roy, Hanno Seebens – regarding surges in pest attacks; the growing diversity of damaging pests; resulting changes in forest species composition and structure that impede ecosystem functions and productivity. Singh et al. follow these sources in calling for improved hygiene in nurseries, adoption of scientific silvicultural practices reducing physical damage to the vegetation, selection of genotypes that are resistant, and reinforcing national and international policies on quarantine and biosecurity measures to minimize pest impacts in the future. They also mention adoption of remote sensing technologies to detect the trees under stress and use of sentinel plantings. They list the 10 most important international agreements dealing with invasive species issues as the International Plant Protection Convention, Ramsar Convention, Convention on International Trade in Endangered Species of Wild Fauna and Flora, Convention on Migratory Species, Convention on Biological Diversity and its Cartagena Protocol on Biosafety, IUCN Invasive Species Specialist Group, World Trade Organization Agreement on Sanitary and Phytosanitary Measures, Global Invasive Species Program, and International Civil Aviation Organization, and Cartagena.
slash and burn agriculture in Bolivia; photo Neil Palmer
Threats to forests: Development Projects
Singh et al. consider development projects to be the third threat to forest conservation. Their roads, powerlines, and other linear developments cause habitat loss and fragment landscapes. In their view, environmental impact assessments and other similar requirements are not yet sufficient to safeguard sustainable use of forest resources.
Policy Responses
Singh et al. call for more inclusive forest management structures to respond to the threat climate change poses to forests, industries, and forest-dependent communities. They all for partnerships that bring together researchers from several disciplines with forest managers and local stakeholders. Geoffrey M. Williams and others (including me) advocate for similar conservation approaches. (See pre-print here.)
In this context, Singh et al. mention several reports, plans, and agreements aimed at global forest conservation. Participants in global fora have recognized the importance of forests in contributing to food security and sustainable development. Among agreements mentioned are the UN’s Strategic Plan for Forests 2030 and recommendations of the International Institute for Sustainable Development (IISD) published in 1994. The former tries to generate greater coherence, collaboration, and synergy across UN programs aimed at encouraging volunteer forest conservation by countries, international, regional, and local organizations, partners, and stakeholders. Unfortunately, they do not discuss the extent to which the 30-year old IISD recommendations have – or have not – been implemented.
They also describe Forest Landscape Restoration as an effective strategy to restore the functionality of forests.Again, the focus is on a collaborative approach aimed at integrating efforts by all forestry-related stakeholders, e.g., scientific and academic organizations, local communities, indigenous peoples, and private sectors, including forest-based enterprises and NGOs.
Also praised is rising attention to trees outside forest. This includes fostering use of trees in agroforestry systems ranging from home gardens to farm forestry systems, shelterbelts, and woodlots. This approach helps to sustain the livelihoods of rural communities and maintain a stable and secure food supply. Meanwhile, it reduces dependence on natural forests
Singh et al. say community forest management and decentralized governance have gained acceptance. They describe examples from Gambia and Rwanda. They concede that such decentralization has its own risks and challenges. For example, e the most marginalized sections of the community must be ensured adequate capacity for robust conflict resolution.
Singh et al. advocate that all nations seek to increase their forest cover; affluent countries that are hampered by physical and climatic conditions should aid poorer nations in increasing and upgrading their forest cover. They suggest “recognition” and encouragement of countries that maintain forest cover above 30% of territory.
Singh, M., N.N. Shahina, S. Das, A. Arshad, S. Siril, D. Barman, U. Mog, P. Panwar, G. Shukla, and S. Chakravarty. 2022. Forest Resources of the World: Present Status and Future Prospects. In Panwar, P., G. Shukla, J.A. Bhat, S. Chakravarty. 2022. Editors. Land Degradation Neutrality: Achieving SDG 15 by Forest Management; ISBN 978-981-19-5477-1 ISBN 978-981-19-5478-8 (eBook)
We welcome comments that supplement or correct factual information, suggest new approaches, or promote thoughtful consideration. We post comments that disagree with us — but not those we judge to be not civil or inflammatory.
For a detailed discussion of the policies and practices that have allowed these pests to enter and spread – and that do not promote effective restoration strategies – review the Fading Forests report at http://treeimprovement.utk.edu/FadingForests.htm
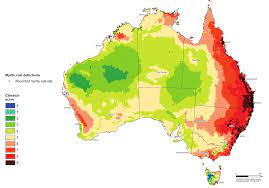
Australian Eucalypts; photo by John Turnbull via Flickr
I congratulate Australian scientists for bringing about substantial improvements of their country’s biosecurity program for forest pests. While it is too early to know how effective the changes will be in preventing new introductions, they are promising. What can we Americans learn from the Australian efforts? [I have previously praised South Africa’s efforts – there is much to learn there, too.]
Australia has a reputation of being very active in managing the invasive species threat. However, until recently biosecurity programs targetting forest pests were minimal and ad hoc. Scientists spent 30 years trying to close those gaps (Carnegie et al. 2022). Their efforts included publishing several reports or publications (listed at the end of the blog) and an international webinar on myrtle rust. Scientists are hopeful that the new early detection program (described below) will greatly enhance forest protection. However, thorough pest risk assessments are still not routinely conducted for forest pests. (Nahrung and Carnegie 2022).
The native flora of Australia is unique. That uniqueness has provided protection because fewer of the non-native insects and pathogens familiar to us in the Northern Hemisphere have found suitable hosts (Nahrung and Carnegie 2020). Also – I would argue – the uniqueness of this flora imposes a special responsibility to protect it from threats that do arise.
Only 17% of Australia’s landmass is covered by forests. Australia is large, however; consequently, these forests cover 134 million hectares (Nahrung and Carnegie 2020). This is the 7th largest forest estate in the world (Carnegie et al. 2022).
Australia’s forests are dominated by eucalypts (Eucalyptus, Corymbia and Angophora). These cover 101 million ha; or 75% of the forest). Acacia (11 million ha; 8%); and Melaleuca (6 million ha) are also significant. The forest also includes one million ha of plantations dominated by Pinus species native to North America (Carnegie et al. 2022). A wide range of native and exotic genera have been planted as amenity trees in urban and peri-urban areas, including pines, sycamores, poplars, oaks, and elms (Carnegie et al. 2022). These urban trees are highly valued for their ecosystem services as well as social, cultural, and property values (Nahrung and Carnegie 2020). Of course, these exotic trees can support establishment and spread of the forest pest species familiar to us in the Northern Hemisphere. On the positive side, they can also be used as sentinel plantings for early detection of non-native species (Carnegie et al. 2022 and Nahrung and Carnegie 2020).
Despite Australia’s geographic isolation, its unique native flora, and what is widely considered to be one of the world’s most robust biosecurity system, at least 260 non-native arthropods and pathogens of forests have established in Australia since 1885 (Nahrung and Carnegie 2020). [(This number is about half the number of non-native forest insects and pathogens that have established in the United States over a period just 25 years longer (Aukema et al. 2010).] As I noted, forest scientists have cited these introductions as a reason to strengthen Australia’s biosecurity system specifically as it applies to forest pests.
What steps have been taken to address this onslaught? For which pests? With what impacts? What gaps have been identified?
Which Pests?
Nahrung and Carnegie (2020) compiled the first comprehensive database of tree and forest pests established in Australia. The 260 species of non-native forest insect pests and pathogens comprise 143 arthropods, 117 pathogens. Nineteen of them (17 insects and 2 fungal species) had been detected before 1900. These species have accumulated at an overall rate of 1.9 species per year; the rate of accumulation after 1955 is slightly higher than during the earlier period, but it has not grown at the exponential rate of import volumes.
While over the entire period insects and pathogens were detected at an almost equal rate (insects at 1.1/year; pathogens at 0.9/year), this disguises an interesting disparity: half of the arthropods were detected before 1940; half of the pathogens after 1960 (Nahrung and Carnegie (2020). By 2022, Nahrung and Carnegie (2022) said that, on average, one new forest insect is introduced each year. Some of these recently detected organisms have probably been established for years. More robust surveillance has just detected them recently. I have blogged often about an apparent explosion of pathogens being transported globally in recent decades.
In a more recent article (Nahrung and Carnegie, 2022), gave 135 as the number of non-native forest insect pests. The authors don’t explain why this differs from the 143 arthropods listed before.
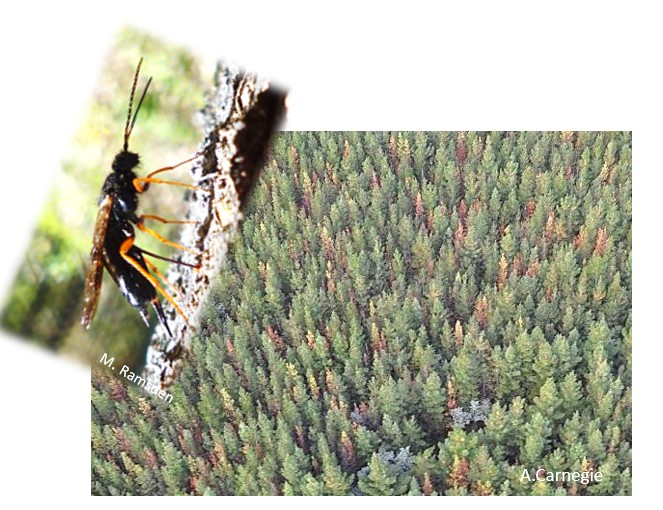
damage to pine plantations caused by Sirex noctilio; photo courtesy of Helen Nahrung
Eighty-seven percent of the established alien arthropods are associated with non-native hosts (e.g., Pinus, Platanus, Populus, Quercus, Ulmus) (Carnegie et al. 2022). Some of these have escaped eradication attempts and caused financial impact to commercial plantations (e.g., sirex wood wasp, Sirex noctilio) and amenity forests (e.g., elm leaf beetle, Xanthogaleruca luteola) (Carnegie and Nahrung 2019).
About 40% of the alien arthropods were largely cosmopolitan at the time of their introduction in Australia (Carnegie et al. 2022). Only six insects and six fungal species are not recorded as invasive elsewhere (Nahrung and Carnegie 2020). Of the species not yet established, 91% of interceptions from 2003 to- 2016 were known to be invasive elsewhere. There is strong evidence of the bridgehead effect: 95% of interceptions of three species were from their invaded range (Nahrung and Carnegie 2022). These included most of the insects detected in shipments from North America, Europe and New Zealand. These ubiquitous “superinvaders” have been circulating in trade for decades and continue to be intercepted at Australia’s borders. This situation suggests that higher interception rates of these species reflect their invasion success rather than predict it (Nahrung and Carnegie 2021).
I find it alarming that most species detected in shipments from Africa, South America, and New Zealand were of species not even recorded as established in those regions (Nahrung and Carnegie 2021; Nahrung and Carnegie 2022).
Arhopalus ferus, a Eurasian pine insect often detected in wood from New Zealand; photo by Jon Sullivan – in New Zealand; via Flickr
Half of the alien forest pests established in Australia are highly polyphagous. This includes 73% of Asian-origin pests but only 15% of those from Europe (Nahrung and Carnegie 2021). Nahrung and Carnegie (2022) confirm that polyphagous species are more likely to be detected during border inspections.
PATHWAYS
As in North America and Europe, introductions of Hemiptera are overwhelmingly (98%) associated with fresh plant material (e.g. nursery stock, fruit, foliage). Coleoptera introductions are predominantly (64%) associated with wood (e.g. packaging, timber, furniture, and artefacts). Both pathways are subject to strict regulations by Australia (Nahrung and Carnegie 2021).
Eradication of High-Priority Pests
Eight-five percent of all new detections were not considered high-priority risks. Of the four that were, two had not previously been recognized as threats (Carnegie and Nahrung 2019). One high-priority pest – expected to pose a severe threat to at least some of Australia’s endemic plant species – is myrtle rust, Austropuccinia psidii. Despite this designation, when the rust appeared in Australia in 2010, the response was confused and ended in an early decision that eradication was impossible. Myrtle rust has now spread along the continent’s east coast, with localized distribution in Victoria, Tasmania, the Northern Territory, and – in 2022, Western Australia. `
Melaleuca quinquenervia forest; photo by Doug Beckers via Wikimedia
There have been significant impacts to native plant communities. Several reviews of the emergency response criticized the haste with which the initial decision was made to end eradication (Carnegie and Nahrung 2019). (A review of these impacts is here; unfortunately, it is behind a paywall.)
A second newly introduced species has been recognized as a significant threat, but only after its introduction to offshore islands. This is Erythina gall waspQuadrastichus erythrinae (Carnegie and Nahrung 2019). DMF Although Australia is home to at least one native species in the Erythrina genus, E. vespertilio,, the gall wasp is not included on the environmental pest watch list.
Four of the recently detected species were considered to be high impact. Therefore eradication was attempted. Unfortunately, these attempts failed in three cases. The single success involved a pinewood nematode, Bursaphelenchus hunanesis. See Nahrung and Carnegie (2021) for a discussion of the reasons. This means three species recognized as high-impact pests have established in Australia over 15 years (Nahrung and Carnegie (2021). In fact, Australia’s record of successful forest pest eradications is only half the global average (Carnegie and Nahrung (2019).
Carnegie and Nahrung (2019) conclude that improving early detection strategies is key to increasing the likelihood of eradication. They discuss the strengths and weaknesses of various strategies. Non-officials (citizen scientists) reported 59% of the 260 forest pests detected (Carnegie and Nahrung 2019). Few alien pests have been detected by official surveillance (Carnegie et al 2022). However, managing citizen scientists’ reports involves a significant workload. Futhermore, surveillance by industry, while appreciated, is likely to detect only established species (Carnegie and Nahrung 2019).
Interception Frequency Is Not an Indicator of Likelihood of Establishment
Nahrung & Carnegie (2021) document that taxonomic groups already established in Australia are rarely detected at the border. Furthermore, only two species were intercepted before they were discovered to be established in Australia.
Indeed, 76% of species established in Australia were either never or rarely intercepted at the border. While more Hemiptera species are established in Australia, significantly more species of Coleoptera are intercepted at the border. Among beetles, the most-intercepted family is Bostrichid borers (powderpost beetles). Over the period 2003 – 2016, Bostrichid beetles made up 82% of interceptions in wood packaging and 44% in wood products (Nahrung and Carnegie 2022). This beetle family is not considered a quarantine concern by either Australian or American phytosanitary officials. I believe USDA APHIS does not even bother recording detections of powderpost beetles. Nahrung and Carnegie (2021) think the high proportion of Bostrichids might be partially explained by intense inspection of baggage, mail, and personal effects. While Australia actively instructs travelers not to bring in fruits and vegetables because of the pest risk, there are fewer warnings about risks associated with wood products.
Nahrung & Carnegie (2021) concluded that interception frequencies did not provide a good overall indicator of likelihood of risk of contemporaneous establishment.
Do Programs Focus on the Right Species?
Although Hemiptera comprise about a third of recent detections and establishments, and four of eight established species are causing medium-to-high impact, no Hemiptera are currently listed as high priority forestry pests by Australian phytosanitary agencies (Nahrung & Carnegie (2021). On the other hand, Lepidoptera make up about a third of the high-priority species, yet only two have established in Australia over 130 years. Similarly, Cerambycidae are the most frequently intercepted forest pests and several are listed as high risk. But only three forest-related species have established (Nahrung and Carnegie 2020). (Note discussion of Bostrichidae above.).
Unlike the transcontinental exchanges under way in the Northern Hemisphere, none of the established beetles is from Asia; all are native to Europe. This is especially striking since interceptions from Asia-Pacific areas account for more than half of all interceptions Nahrung and Carnegie (2021).
Interestingly, 32 Australian Lepidopteran and eight Cerambycid species are considered pests in New Zealand. However, no forest pests native to New Zealand have established in Australia despite high levels of trade, geographic proximity, and the high number of shared exotic tree forest species (Nahrung and Carnegie 2020).
STRUCTURE OF PROGRAM
The structure of Australia’s plant biosecurity system is described in detail in Carnegie et al. (2022). These authors call the program “comprehensive” but to me it looks highly fragmented. The federal Department of Agriculture and Water Resources (DAWR,[recently renamed the Department of Agriculture, Fisheries, and Forestry, or DAFF) is responsible for pre-border (e.g., off-shore compliance) and border (e.g., import inspection) activities. The seven state governments, along with DAFF, are responsible for surveillance within the country, management of pest incursions, and regulation of pests. Once an alien pest has become established, its management becomes the responsibility of the land manager. In Australia, then, biosecurity is considered to be a responsibility shared between governments, industry and individuals.
Even this fragmented approach was developed more recently than one might expect given Australia’s reputation for having a stringent biosecurity system. Perhaps this reflects the earlier worldwide neglect of the Plant Kingdom? Carnegie and Nahrung (2019) describe recent improvements. Until the year 2000, Australia’s response to the detection of exotic plant pests was primarily case-by-case. In that year Plant Health Australia (PHA) was incorporated. Its purpose was to facilitate preparedness and response arrangements between governments and industry for plant pests. In 2005, the Emergency Plant Pest Response Deed (EPPRD) was created. It is a legally-binding agreement between the federal, state, and territorial governments and plant industry bodies. As of 2022, 38 were engaged. It sets up a process to implement management and funding of agreed responses to the detection of exotic plant pests – including cost-sharing and owner reimbursement. A national response plan (PLANTPLAN) provides management guidelines and outlines procedures, roles and responsibilities for all parties. A national committee (Consultative Committee on Emergency Plant Pests (CCEPP) works with surveys to determine invaded areas (delimitation surveys) and other data to determine whether eradicating the pest is technically feasible and has higher economic benefits than costs..
Austropuccinia psidii on Melaleuca quinquenervia; photo by John Tann via Flickr
Even after creation of EPPRD in 2005, studies revealed significant gaps in Australia’s post-border forest biosecurity systems regarding forest pests (Carnegie et al. 2022; Carnegie and Nahrung 2019). These studies – and the disappointing response to the arrival of myrtle rust – led to development of the National Forest Biosecurity Surveillance Strategy (NFBSS) – published in 2018; accompanied by an Implementation Plan. A National Forest Biosecurity Coordinator was appointed.
The forest sector is funding a significant proportion of the proposed activities for the next five years; extension is probable. Drs. Carnegie and Nahrung are pleased that the national surveillance program has been established. It includes specific surveillance at high-risk sites and training of stakeholders who can be additional eyes on the ground. The Australian Forest Products Association has appointed a biosecurity manager (pers. comm.)
This mechanism is expected to ensure that current and future needs of the plant biosecurity system can be mutually agreed on, issues identified, and solutions found. Plant Health Australia’s independence and impartiality allow the company to put the interests of the plant biosecurity system first. It also supports a longer-term perspective (Carnegie et al. (2022). Leading natural resource management organizations are also engaged (Carnegie, pers. comm.).
Presumably the forest surveillance strategy (NFBSS) structure is intended to address the following problems (Carnegie and Nahrung 2019):
Alien forest pests are monitored offshore and at the border, but post-border surveillance is less structured and poorly resourced. Australia still lacks a surveillance strategy for environmental pests.
Several plant industries have developed their own biosecurity programs, co-funded by the government. These include the National Forest Biosecurity Surveillance Strategy (NFBSS).
Some pilot projects targetting high risk sites were initiated in the early 2000s. By 2019, only one surveillance program remained — trapping for Asian spongy (gypsy) moth.
The states of Victoria and New South Wales have set up sentinel site programs. Victoria’s uses local council tree databases. It is apparently focused on urban trees and is primarily pest-specific – e.g., Dutch elm disease. The New South Wales program monitors more than 1,500 sentinel trees and traps insects near ports. This program is funded by a single forest grower through 2022.
Dr. Carnegie states: “With the start of the national forest biosecurity surveillance program in December 2022, the issues and gaps identified by Carnegie et al. 2022 are starting to be addressed. The program will conduct biosecurity surveillance specifically for forest pests and pathogens and be integrated with national and state biosecurity activities. While biosecurity in Australia is still agri-centric, a concerted and sustained effort from technical experts from the forest industry is changing this. And finally, the new Biosecurity Levy should ensure sustained funding for biosecurity surveillance.”
There is a separate National Environmental Biosecurity Response Agreement (NEBRA), adopted in 2012. It is intended to provide guidelines for responding, cost-sharing arrangements, etc. when the alien pest threatens predominantly the environment or public amenity assets (Carnegie et al. (2022). However, when the polyphagous shot hole borer was detected, the system didn’t work as might have been expected. While PSHB had previously been identified as an environmental priority pest, specifically to Acacia, the decision whether to engage was made under auspices of the the Emergency Plant Pest Response Deed (EPPRD) rather than the environmental agreement (NEBRA). As a result, stakeholders focused on environmental, amenity and indigenous concerns had no formal representation in decision-making processes; instead, industries that had assessed the species as a low priority (e.g., avocado and plantation forestry) did (Nahrung, pers.comm.).
Additional Issues Needing Attention
Some needs are not addressed by the National Forest Pest Strategic Plan (Carnegie et al. 2022) (Nahrung, pers. comm.):
1) The long-term strategic investment from the commercial forestry sector and government needed to maintain surveillance and diagnostic expertise;
2) Studies to assess social acceptance of response and eradication activities such as tree removal;
3) Studies to improve pest risk prioritization and assessment methods; and
4) Resolving the biosecurity responsibilities for pests of timber that has been cut and used in construction.
In 2019, Carnegie and Nahrung (2019) called for developing more effective methods of detection, especially of Hemiptera and pathogens. They also promoted national standardization of data collection. Finally, they advocated inclusion of technical experts from state governments, research organizations and industry in developing and implementing responses to pest incursions. They note that surveillance and management programs must be prepared to expect and respond to the unexpected since 85% of the pests detected over the last 20 years—and 75% of subsequently mid-to high-impact species established—were not on high-priority pest list. See Nahrung and Carnegie 2022 for a thorough discussion of the usefulness and weaknesses of predictive pest listing.
SOURCES
Aukema, J.E., D.G. McCullough, B. Von Holle, A.M. Liebhold, K. Britton, & S.J. Frankel. 2010. Historical Accumulation of Nonindigenous Forest Pests in the Continental United States. Bioscience. December 2010 / Vol. 60 No. 11
Carnegie A.J. and H.F. Nahrung. 2019. Post-Border Forest Biosecurity in AU: Response to Recent Exotic Detections, Current Surveillance and Ongoing Needs. Forests 2019, 10, 336; doi:10.3390/f10040336 www.mdpi.com/journal/forests
Carnegie A.J., F. Tovar, S. Collins, S.A. Lawson, and H.F. Nahrung. 2022. A Coordinated, Risk-Based, National Forest Biosecurity Surveillance Program for AU Forests. Front. For. Glob. Change 4:756885. doi: 10.3389/ffgc.2021.756885
Nahrung H.F. and A.J. Carnegie. 2020. NIS Forest Insects and Pathogens in Australia: Establishmebt, Spread, and Impact. Frontiers in Forests and Global Change 3:37. doi: 10.3389/ffgc.2020.00037 March 2020 | Volume 3 | Article 37
Nahrung, H.F. and A.J. Carnegie. 2021. Border interceps of forest insects estab in AU: intercepted invaders travel early and often. NeoBiota 64: 69–86. https://doi.org/10.3897/neobiota.64.60424
Nahrung, H.F. & A.J. Carnegie. 2022. Predicting Forest Pest Threats in Australia: Are Risk Lists Worth the Paper they’re Written on? Global Biosecurity, 2022; 4(1).
Posted by Faith Campbell
We welcome comments that supplement or correct factual information, suggest new approaches, or promote thoughtful consideration. We post comments that disagree with us — but not those we judge to be not civil or inflammatory.
For a detailed discussion of the policies and practices that have allowed these pests to enter and spread – and that do not promote effective restoration strategies – review the Fading Forests report at http://treeimprovement.utk.edu/FadingForests.htm
Pinus radiata plantation in New Zealand; photo by Jon Sullivan
As countries and conservation organizations ramp up tree planting as one solution to climate change, I worry that many of the plantings will use species not native to the region – with the risk of promoting more bioinvasions. My second fear is that inadequate attention will be paid to ensuring that the propagules thrive.
Warning from New Zealand
New Zealand has adopted a major afforestation initiative (“One Billion Trees”). This program is ostensibly governed by a policy of “right tree, right place, right purpose”. However, Bellingham et al. (2022) [full citation at end of blog] say the program will probably increase the already extensive area of radiata pine plantations and thus the likelihood of exacerbated invasion. They say the species’ potential invasiveness and its effects in natural ecosystems have not been considered.
Bellingham et al. set out to raise the alarm by evaluating the current status of radiata, or Monterrey, pine (Pinus radiata) in the country. They note that the species already occupies ~1.6 M ha; the species makes up 90% of the country’s planted forests. Despite the species having been detected as spreading outside plantations in 1904, it is generally thought not to have invaded widely.
The authors contend that, to the contrary, radiata pine has already invaded several grasslands and shrublands, including three classes of ecosystems that are naturally uncommon. These are geothermal ecosystems, gumlands (infertile soils that formerly supported forests dominated by the endemic and threatened kauri tree Agathis australis), and inland cliffs. Invasions by pines – including radiata pine – are also affecting primary succession on volcanic substrates, landslides on New Zealand’s steep, erosion-prone terrain, and coastal sand dunes. Finally, pine invasions are overtopping native Myrtaceae shrubs during secondary succession. Bellingham et al. describe the situation as a pervasive and ongoing invasion resulting primarily from spread from plantations to relatively nearby areas.
kauri; photo by Natalia Volna, iTravelNZ
The New Zealanders cite data from South America and South Africa on the damaging effects of invasions by various pine species, especially with respect to fire regimes.
Furthermore, their modelling indicates that up to 76% of New Zealand’s land area is climatically capable of supporting radiata pine — most of the country except areas above 1000 m in elevation or receiving more than 2000 mm of rainfall per year. That is, all but the center and west of the South Island. This model is based on current climate; a warmer/drier climate would probably increase the area suitable to radiata pine.
These invasions by radiata pine have probably been overlooked because the focus has been on montane grasslands (which are invaded by other species of North American conifers). [See below — surveys of knowledge of invasive plants’ impacts.]
Bellingham et al. recognize the economic importance of radiata pine. They believe that early detection of spread from plantations and rapid deployment of containment programs would be the most effective management strategy. They therefore recommend
1) taxing new plantations of non-indigenous conifers to offset the costs of managing invasions, and
2) regulating these plantations more strictly to protect vulnerable ecosystems.
They also note several areas where additional research on the species’ invasiveness, dispersal, and impacts is needed.
Survey of Awareness of Invasive Plants
A few months later a separate group of New Zealand scientists published a study examining tourists’ understanding of invasive plant impacts and willingness to support eradication programs (Lovelock et al.; full citation at end of the blog). One of the invasive plant groups included in the study are conifers introduced from North America and Europe. These conifers are invading montane grasslands, so they are not the specific topic of the earlier article. The other is a beautiful flowering plant, Russell lupine. These authors say that both plant groups have profound ecological, economic, and environmental impacts. However, the conifers and lupines are also highly visible at places valued by tourists. Lovelock et al. explored whether the plants’ familiarity – and beauty – might affect how people reacted to descriptions of their ecosystem impacts.
Visitors from elsewhere in New Zealand were more aware of invasive plants’ impacts and more willing to support eradication programs for these species specifically. Asian visitors had lower awareness and willingness to support eradication of the invasives than tourists from the United Kingdom, Europe, or North America. This pattern remained after the tourists were informed about the plants’ ecological impacts. All groups were less willing to support eradication of the attractive Russell lupine than the conifers.
Conifers invading montane grasslands are perhaps the most publicized invasive plants in New Zealand [as noted above]. Lovelock et al. report that New Zealand authorities have spent an estimated $NZ166 million to eradicate non-native conifers over large tracts of land on the South Island. Still, only about half the New Zealand visitors surveyed were aware of the ecological problems caused by wild conifers.
invasive lupines in New Zealand; photo by Michael Button via Flickr
Russell lupine (Lupinus × russellii) is invading braided river systems, modifying river flows, reducing nesting site availability for several endangered birds, and provides cover for invasive predators. While initially planted in gardens, the lupines were soon being deliberately spread along the roads to ‘beautify’ the landscape. Foreign tourists often specifically seek river valley invaded by the lupine because pictures of the floral display appear in both official tourism promotional material & tourist-related social media. It is not surprising, then, that even among New Zealanders, only a third were aware of the lupines’ environmental impacts.
The oldest participants (those over 60) had the lowest acceptance of wild conifers. Participants 50–59 years old were most aware of ecological problems caused by wild conifers. Participants 30–39 years old showed the highest acceptance of wild conifers and lowest awareness of ecological issues.
Female participants showed a higher preference for the landscape with wild conifers (45.90%) than males (36.89%). Female participants were also half as aware of ecological problems (25.62% v. 46.12% among male participants).
Nearly all survey participants (96.1%) preferred the landscape with flowering lupine; only 19.4% were aware of associated ecological problems. New Zealand domestic visitors were more aware. After the impacts of lupines were explained, half decided to support eradication. However, the same proportion of all survey participants (42.5%) still wanted to see lupines in the landscape.
Once again, participants older than 50 were more aware of ecological problems arising from lupine invasions. Both men and women greatly preferred the landscape with Russell lupins.
While the authors do not explore the ramifications of the finding that younger people are less aware of invasive species impacts, I think they bode ill for future protection of the country’s unique flora and fauna. They did note that respondents had a high level of acceptance overall for these species on the New Zealand landscapes.
While the study supported use of simple environmental messaging to influence attitudes about invasive species, also showed that need to consider such social attributes as nationality and ethnicity. So Lovelock et al. call for investigation of how and why place of origin and ethnicity are important in shaping attitudes towards invasives. Conveying conservation messages will be more difficult because tourist materials often contain photographs of the lupines. Much of this information comes from informal media such as social media, which are beyond the control of invasive species managers.
SOURCES
Bellingham, P.J., E.A. Arnst, B.D. Clarkson, T.R. Etherington, L.J. Forester, W.B. Shaw, R. Sprague, S.K. Wiser, and D.A. Peltzer. 2022. The right tree in the right place? A major economic tree species poses major ecological threats. Biol Invasions Vol.: (0123456789) https://doi.org/10.1007/s10530-022-02892-6
Lovelock B., Y. Ji, A. Carr, and C-J. Blye. 2022. Should tourists care more about invasive species? International and domestic visitors’ perceptions of invasive plants and their control in New Zealand. Biological Invasions (2022) 24:3905–3918 https://doi.org/10.1007/s10530-022-02890-8
Posted by Faith Campbell
We welcome comments that supplement or correct factual information, suggest new approaches, or promote thoughtful consideration. We post comments that disagree with us — but not those we judge to be not civil or inflammatory.
For a detailed discussion of the policies and practices that have allowed these pests to enter and spread – and that do not promote effective restoration strategies – review the Fading Forests report at http://treeimprovement.utk.edu/FadingForests.htm
boxwood garden at Gunston Hall – home of founding father George Mason; Virginia; photo by Roger 4336 via Wikimedia
Boxwood blight is a disease caused by a group of fungal pathogens. While boxwoods are horticultural plants in the U.S. – important ones! – they are keystone forest species in several regions of the tropics and subtropics.
The situation with boxwood blight is yet another example of a too-frequent pattern for plant pathogens. This pattern applies even to plant taxa that are important to the ornamental horticulture industry – not only plants that are important in natural ecosystems. [See other blogs posted here under the category “plants as pest vectors”, e.g., here. The boxwood blight pathogens:
are of unknown origin;
have a wide range of known hosts; additional hosts probable;
have been introduced to many new sites over about 30 years;
have caused considerable economic, aesthetic, and ecological harm;
are a threat to centers of endemism;
have no known methods to treat plants in forests;
are spread by international plant trade;
complicate detection by having hosts that sometimes are asymptomatic; or symptoms can be suppressed by fungicides;
apparently few efforts to apply phytosanitary measures to prevent further spread.
Also typical: concerned scientists are trying to promote adoption of phytosanitary measures. This takes the form of a study by Barke, Coop and Hong (full citation at the end of the blog; unless otherwise stated, information in this blog is from this source). They use several models based largely on climatic factors to predict additional geographic areas where else boxwood blight might establish.
I think it is most unfortunate that the U.S. horticultural industry prefers to avoid federal regulation despite the significant costs to its members. Instead, it has advocated for a primarily voluntary response (see below). This undermines efforts to restructure regulatory programs to improve phytosanitary agencies’ management of pathogens. Since the U.S. is such a powerful player on this issue, reducing pressure on APHIS to find more effective measures has global implications. I recognize that preventing transmission of unknown and cryptic pathogens is an intrinsically difficult task. However, tackling this problem should be a top priority for people concerned about retaining healthy floral communities.
Specifics About Boxwood Blight
Boxwood blight is caused by two ascomycete fungi, Calonectria pseudonaviculata [synonym Cylindrocladium buxicola] and Calonectria henricotiae. Both can infect and blight boxwood foliage, resulting in rapid plant death. C. henricotiae is known from only five countries in Europe; C. pseudonaviculata is currently established in 24 countries in three geographic areas: Europe and western Asia; New Zealand; and North America (30 US states and British Columbia). The disease caused by C. pseudonaviculata could spread well beyond its currently invaded range in these regions.
range of Buxus sempervirens; via Wikimedia
Native plants in the family Buxaceae grow in tropical or subtropical areas around the world. Plants in the genera Buxus, Didymeles, Haptanthus, Pachysandra, Sarcococca, and Styloceras are found in some areas of western and southern Europe; Turkey and the Caucuses into Iran; several countries in southeast and east Asia (China, Japan, South Korea, Vietnam, Indonesia); coastal Australia; high elevation areas of Africa, including Madagascar; parts of South America (southern Brazil, Uruguay, northern Argentina, and southern Chile, and foothills of the Andes); parts of Central America and the Caribbean. Asia is home to about 40 species of Buxus, four species of Pachysandra, and 11 species of Sarcococca. In the Andes region, all five species of Styloceras are endemic. Central America and the Caribbean are home to about 50 species of Buxus; there are 37 species endemic to Cuba! Madagascar has nine endemic Buxus species.
Many Buxus species occur in small and isolated distributions resulting from both natural causes (e.g., island endemism) and anthropogenic disturbances (including deforestation and invasions of by other non-native pests, such as the box tree moth Cydalima perspectalis in Europe and western Asia).
In native stands of Buxus sempervirens in Georgia and northern Iran, where C. pseudonaviculata was detected in 2010, the disease has caused rapid and intensive defoliation of boxwood plants of different ages. [See also Lehtijarvi, Dogmus-Lehtijarvi and Oskay. Boxwood Blight in Turkey: Impact on Natural Boxwood Populations and Management Challenges. Baltic Forestry 2017, vol. 23(1)] Infected plants are also vulnerable to attacks by secondary opportunistic pathogens that can lead to eventual death. Damage to these forests could lead to reductions in soil stability and subsequent declines in water quality and flood protection, changes in forest structure and composition, and declines in Buxus-associated biodiversity (at least 63 species of lichens, fungi, chromista and invertebrates might be obligate).
Barke, Coop and Hong expect excessive heat and seasonal dryness at one extreme and excessive cold at the other to limit areas in North America and Europe/central Asia where the disease can establish. Areas with oceanic rather than continental climates are probably more vulnerable. However, heat and aridity barriers could be overcome by artificial irrigation of horticultural plantings.
Indeed, the conditions favoring C. pseudonaviculata establishment – warm temperatures and high humidity or water on the leaves – are commonly found in production nurseries. Overhead irrigation exacerbates the risk. Production nurseries also have large numbers of host plants in close proximity – so it is easy for disease to spread (Douglas).
I am reminded that the causal agent of sudden oak death, Phytophthora ramorum, has been spread from production nurseries located in hot, dry areas that were considered unsuitable to the pathogen – because conditions inside the nursery were suitable.
wild Buxus on island of Corsica; photo by Sten Porse via Wikimedia
As I noted, the origin of C. pseudonaviculata is unknown. Barke, Coop and Hong think it is most likely in eastern Asia, which is thought to be the likely native region of box tree moth. However, they cannot rule out some other center of diversity for Buxaceae species e.g., the Caribbean or Madagascar.
Barke, Coop and Hong call for additional studies to
Explore potential effects of climate change on establishment risk, especially higher latitude areas expected to see increasing humidity, precipitation, and rising temperatures.
Determine ability of C. pseudonaviculata microsclerotia to survive higher temperatures, e.g. in parts of the U.S. Deep South that may have ideal growing conditions during cool seasons.
Modify the CLIMEX model developed for this study to predict the potential distribution of C. henricotiae, a closely related but genetically distinct species with greater tolerance of higher temperatures.
They call for a strict phytosanitary protocol for risk mitigation of accidental intro, with effective surveillance for early detection, and development of a recovery plan.
Regulatory (non) Response
Boxwood blight was first detected in the United Kingdom in mid-1990s; then in New Zealand in 2002. Only then was the causal agent determined. It was first detected in the U.S. in October 2011 (in Connecticut). It was quickly determined to be established in the mid-Atlantic region. Apparently the British, other European countries, and APHIS all decided the pathogen was too widespread to regulate (Douglas).
The U.S. is relying on a voluntary program. The nursery industry, through its Horticultural Research Institute (HRI), and the National Plant Board developed guidance for best management practices – updated as recently as 2020.
boxwood blight symptoms; Oregon State University; via Flickr
In contrast, APHIS has acted to regulate the boxwood tree moth, Cydalima perspectalis. The moth was first detected in North America near Toronto in 2018. U.S. nurseries in six states received infected plants in spring 2021. On May 26, 2021, APHIS prohibited importation of host plants from Canada, including boxwood (Buxus spp), Euonymus (Euonymus spp), and holly (Ilex spp).
In July 2021, the moth was detected in Niagara County, New York. It was thought that the moths had flown or been blown into the area from Canada. New York adopted an intrastate quarantine of three counties (Erie, Niagara, and Orleans) in December 10, 2021. APHIS followed with an interstate quarantine on March 23, 2022.
SOURCES
Barke, B.S., L. Coop and C. Hong. 2022. Potential Distribution of Invasive Boxwood Blight Pathogen (Calonectria pseudonaviculata) as Predicted by Process-Based and Correlative Models. Biology 2022, 11, 849. https://doi.org/10.3390/biology11060849 www.mdpi.com/journal/biology
We welcome comments that supplement or correct factual information, suggest new approaches, or promote thoughtful consideration. We post comments that disagree with us — but not those we judge to be not civil or inflammatory.
For a detailed discussion of the policies and practices that have allowed these pests to enter and spread – and that do not promote effective restoration strategies – review the Fading Forests report at http://treeimprovement.utk.edu/FadingForests.htm
Burmese python in Everglades National Park; photo by Bob Reed, US FWS
Scientists continue to apply data collected in an international database (InvaCost; see “methods” section of Cuthbert et al.; full citation at end of this blog) to estimate the economic costs associated with invasive alien species (IAS). These sources reported $22.24 billion in economic costs of bioinvasion in protected areas over the 35-year period 1975 – 2020. Because the data has significant gaps, no doubt invasions really cost much more.
Moodley et al. 2022 (full citation at end of this blog) attempt to apply these data to analyze economic costs in protected areas. As they note, protected areas are a pillar of global biodiversity conservation. So it is important to understand the extent to which bioinvasion threatens this purpose.
Unfortunately, the data are still too scant to support any conclusions. Such distortions are acknowledged by Moodley et al. I will discuss the data gaps below a summary of the study’s findings.
The Details
Of the estimated $22.24 billion, only 4% were observed costs; 96% were “potential” costs (= extrapolated or predicted based on models). Both had generally increased in more recent years, especially “potential” costs after 1995. As is true in other analyses of InvaCost data, the great majority (73%) of observed costs covered management efforts rather than losses due to impacts. The 24% of total costs ascribed to losses, or damage, exceeded the authors’ expectation. They had thought that the minimal presence of human infrastructure inside protected areas would result in low records of “economic” damages.
The great majority (83%) of reported management costs were reactive, that is, undertaken after the invasion had occurred. In terrestrial environments, there were significantly higher bioinvasion costs inside protected areas than outside (although this varied by continent). However, when considering predicted or modelled costs, the importance was reversed: expected management costs represented only 5% while these “potential” damages were 94%.
Higher expenditures were reported in more developed countries – which have more resources to allocate and are better able to carry out research documenting both damage and effort.
More than 80% of management costs were shouldered by governmental services and/or official organizations (e.g. conservation agencies, forest services, or associations). The “agriculture” and “public and social welfare” sectors sustained 60% of observed “damage” and 89% of “mixed damage and management” costs respectively. The “environmental” and “public and social welfare” sectors together accounted for 94% of all the “potential” costs (predicted based on models) generated by invasive species in protected areas; 99% of damage costs. With the partial exception of the agricultural sector, the economic sectors that contribute the most to movement to invasive species are spared from carrying the resulting costs.
Lord Howe Island, Australia; threatened by myrtle rust; photo by Robert Whyte, via Flickr
Invasive plants dominated by numbers of published reports – 64% of reports of observed costs, 79% of reports of “potential”. However, both actual and “potential” costs allotted to plant invasions were much lower than for vertebrates and invertebrates. Mammals and insects dominated observed animal costs.
It is often asserted that protected areas are less vulnerable to bioinvasion because of the relative absence of human activity. Moodley et al. suggest the contrary: that protected areas might be more vulnerable to bioinvasion because they often host a larger proportion of native, endemic and threatened species less adapted to anthropogenic disturbances. Of course, no place on Earth is free of anthropogenic influences; this was true even before climate change became an overriding threat. Plenty of U.S. National parks and wilderness areas have suffered invasion by species that are causing significant change (see, for example, here, here, and here).
Despite Best Efforts, Data are Scant and Skewed
Economic data on invasive species in protected areas were available for only a tiny proportion of these sites — 55 out of 266,561 protected areas.
As Moodley et al. state, their study was hampered by several data gaps:
Taxonomic bias – plants are both more frequently studied and managed in protected areas, but their reported observed costs are substantially lower than those of either mammals or insects.
The data relate to economic rather than ecological effects. The costliest species economically might not cause the greatest ecological harm.
Geographical bias – studies are more plentiful in the Americas and Pacific Islands. However, studies from Europe, Africa and South America more often report observed costs. The South African attention to invasive species (see blogs here, here, and here), and economic importance of tourism to the Galápagos Islands exacerbate these data biases.
Methodological bias – although reporting bioinvasion costs has steadily increased, it is still erratic and dominated by “potential” costs = predictions, models or simulations.
I note that, in addition, individual examples of high-cost invasive species are not representative. The highest costs reported pertained to one agricultural pest (mango beetle) and one human health threat (mosquitoes).
Great Smokey Mountains National Park; threatened by mammals (pigs), forest pests, worms, invasive plants … Photo by Domenico Convertini via Flickr
As these weaknesses demonstrate, a significant need remains for increased attention to the economic aspects of bioinvasion – especially since political leaders pay so much greater attention to economics than to other metrics. However, the reported costs – $22.24 billion over 35 years, and growing! – are sufficient in the view of Moodley et al. to support advocating investment of more resources in invasive species management in protected areas, including – or especially – it is not quite clear — preventative measures.
SOURCES
Cuthbert, R.N., C Diagne, E.J. Hudgins, A. Turbelin, D.A. Ahmed, C. Albert, T.W. Bodey, E. Briski, F. Essl, P.J. Haubrock, R.E. Gozlan, N. Kirichenko, M. Kourantidou, A.M. Kramer, F. Courchamp. 2022. Bioinvasion cost reveals insufficient proactive management worldwide. Science of The Total Environment Volume 819, 1 May, 2022, 153404
Moodley, D., E. Angulo, R.N. Cuthbert, B. Leung, A. Turbelin, A. Novoa, M. Kourantidou, G. Heringer, P.J. Haubrock, D. Renault, M. Robuchon, J. Fantle-Lepczyk, F. Courchamp, C. Diagne. 2022. Surprisingly high economic costs of bioinvasions in protected areas. Biol Invasions. https://doi.org/10.1007/s10530-022-02732-7
Posted by Faith Campbell
We welcome comments that supplement or correct factual information, suggest new approaches, or promote thoughtful consideration. We post comments that disagree with us — but not those we judge to be not civil or inflammatory.
For a detailed discussion of the policies and practices that have allowed these pests to enter and spread – and that do not promote effective restoration strategies – review the Fading Forests report at http://treeimprovement.utk.edu/FadingForests.htm