
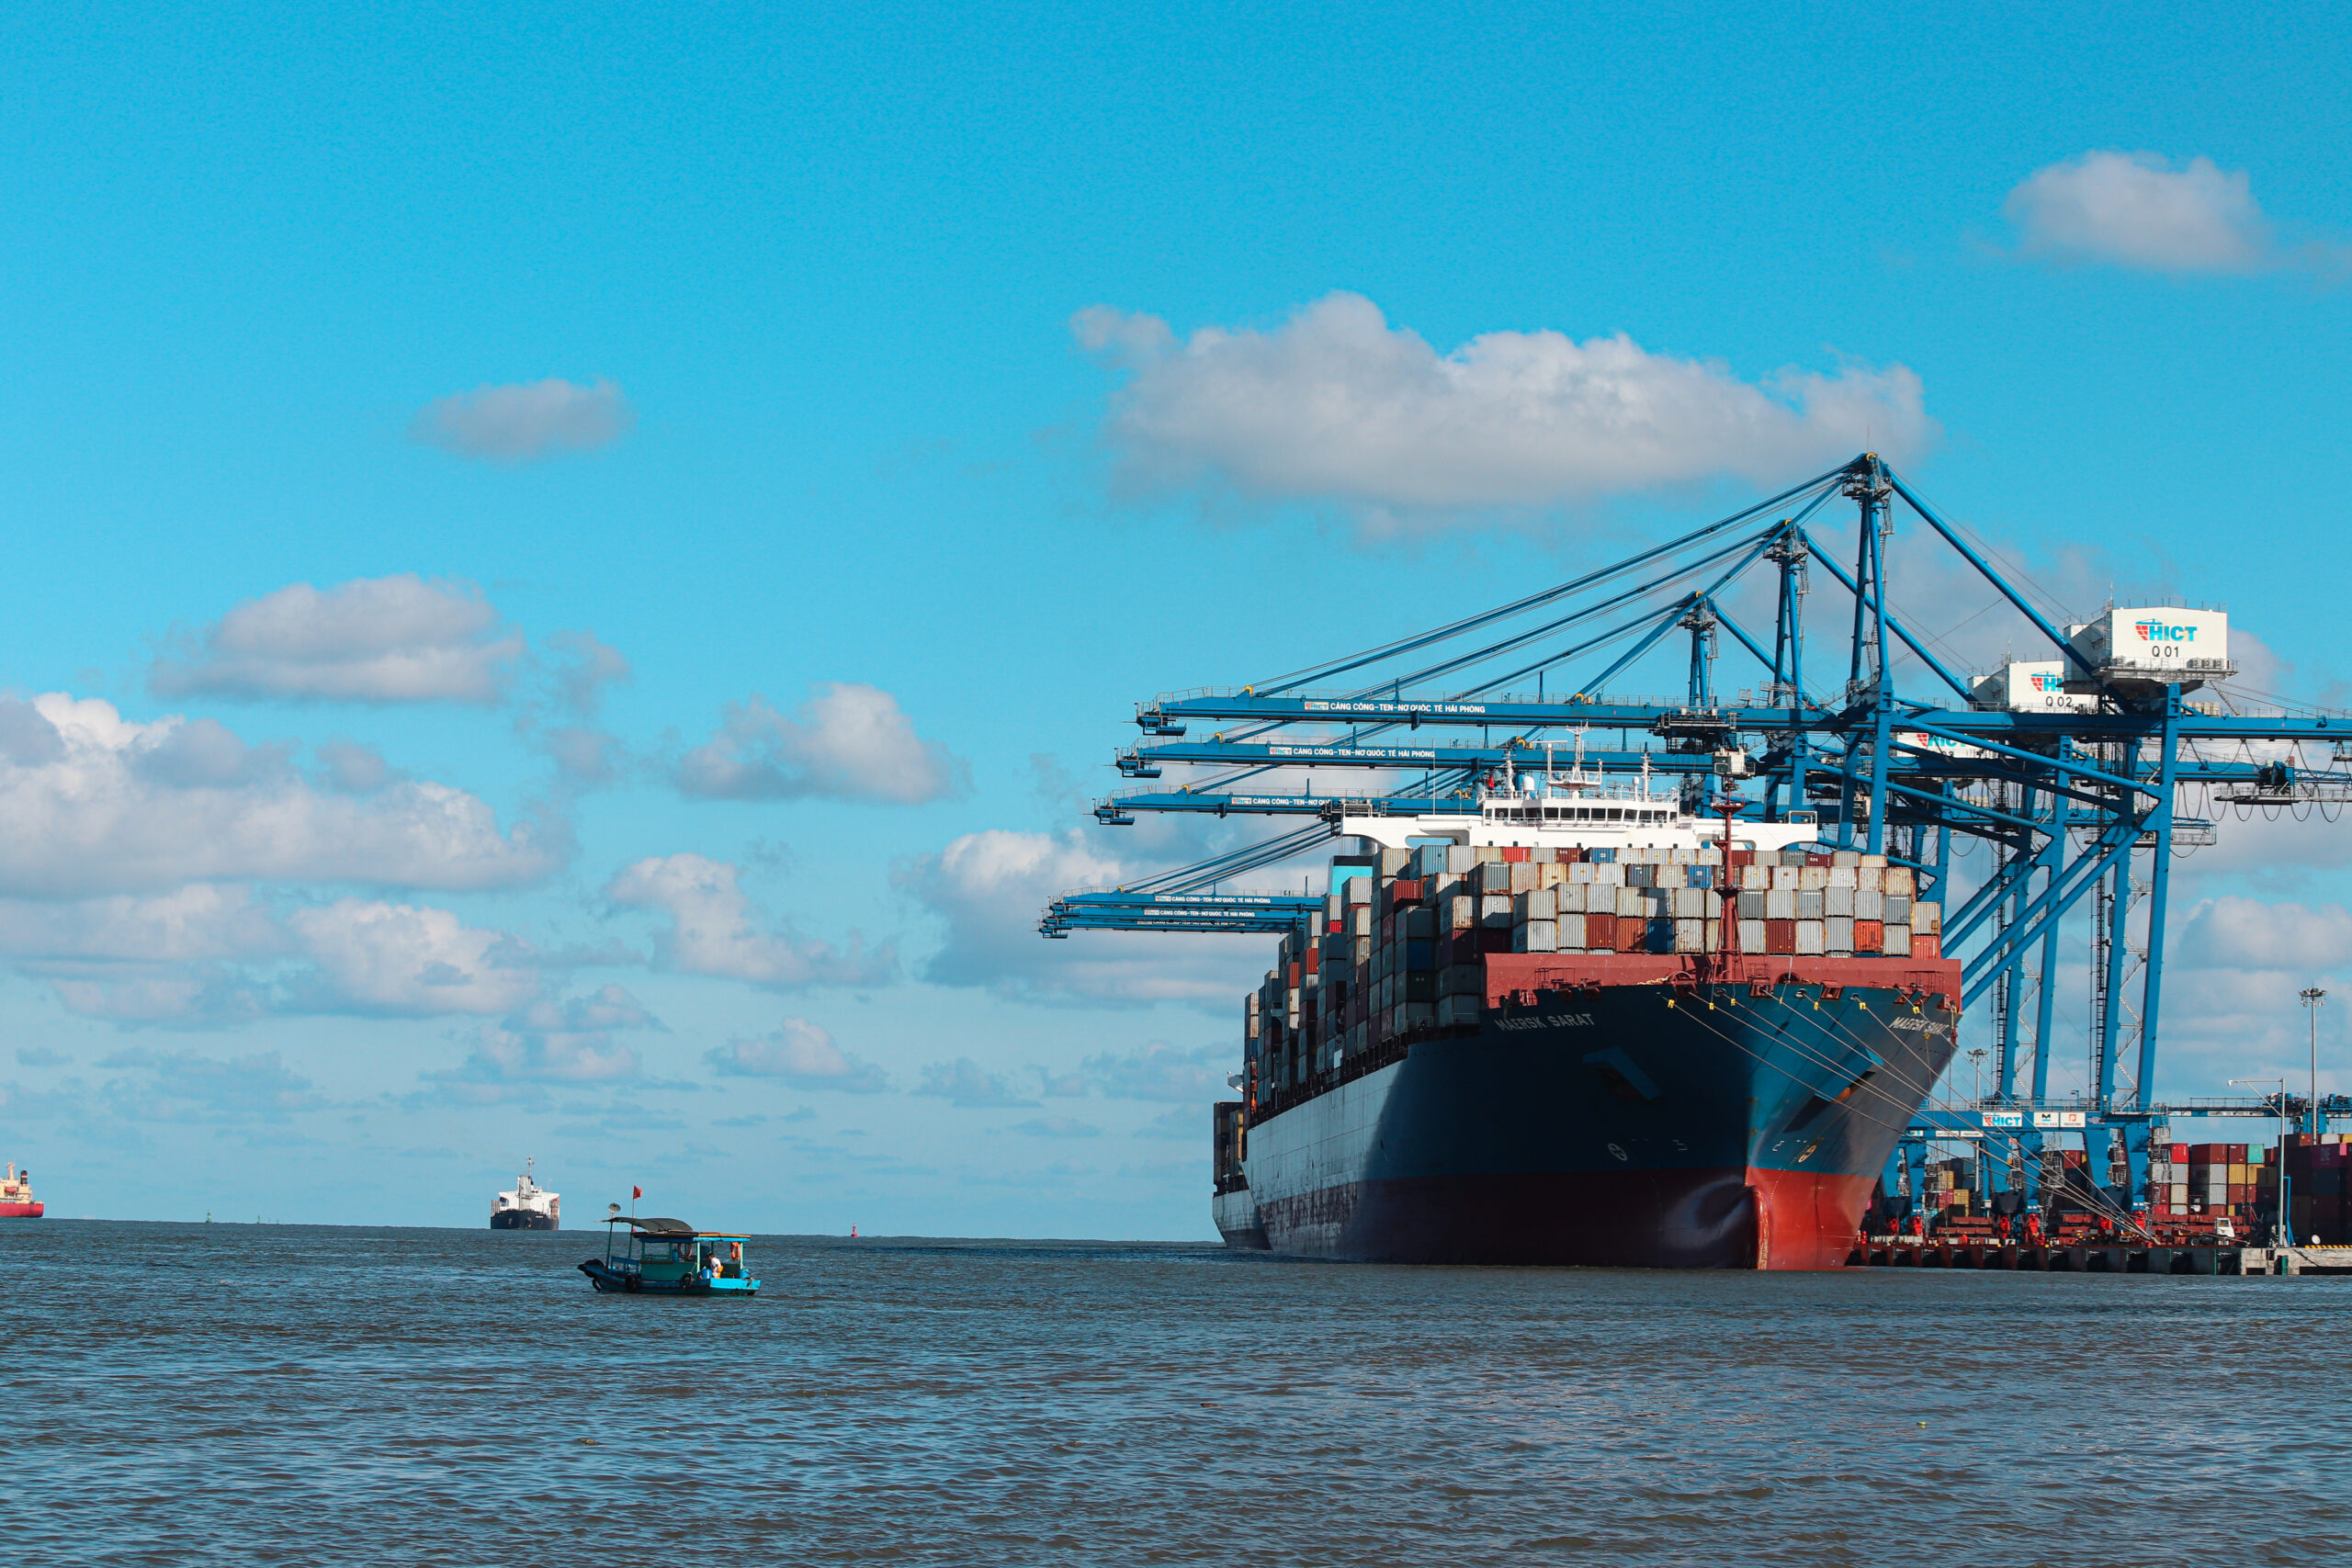
As readers of this blog know, I worry when volumes of imports rise (scroll down the webpage to “categories”, then scroll down to the “wood packaging” category), especially when the rise is rapid and supply chains are in chaos – as they are now. As I reported a month ago, U.S. imports from China landing at U.S. west coast ports grew by significant amounts during January through April 2025 as importers sought to get their goods before a threatened strike by longshoremen and high tariffs mandated by President Trump. The blog provides specific proportional increases for the ports of Los Angeles, Long Beach, Oakland, Seattle, and Tacoma. After a dip in May and June [as reported in both the Washington Post article and that by M. Angell] – in response to President Trump announcing a 145% tariff on goods from China – imports surged again in July when this tax was postponed (see below).
These spurts in imports worried me because wood packaging from China has a nearly 30-year history of higher-than-average failure to comply with phytosanitary regulations (see Haack et al. 2022; full citation at the end of this blog; and earlier blogs). I fret that when importers are in a rush neither exporters nor importers pays much attention to whether the crates and pallets have been treated in accordance with ISPM#15 to prevent insect infestation.
The surge in imports was across the board. Indeed, other countries saw even higher growth in exports to the United States than did China. According to the Journal of Commerce (JOC), www.joc.com containerized imports from all exporters reached an all-time high in July 2025 — 2.6 million TEUs Over the six-month period January through June, 12.53 million TEUs [Robb] (otherwise measured as approximately 6.3 million 40-ft containers). JOC also recorded single-digit declines in import volumes from all regions in May and June.
In a blog in March 2025 I noted that the Department of Homeland Security’s Bureau of Customs and Border Protection (CBP) had processed 36.6 million shipping containers holding imports in Fiscal Year 2023 – which ended in September 2023. Together, Mexico and Canada provided 30% of U.S. imports in 2022. So probably ~25 million shipping containers arrived via ship from Asia, Europe, and other overseas trading partners.
Note that the CBP reports containers, while the JOC reports TEUs [TEU = twenty-foot equivalent unit; standardized measure of container]. Most sea-borne containers are actually 40 feet long; CBP numbers probably refer predominantly to 40-feet containers. The numbers reported by the two sources are not equivalent. The trends do match, however.
Origins
Despite the spurts in volumes of incoming containers, total imports from China have declined from previous years. According to Angell, the 1.228 million TEU imported from China in July was 8% lower than the number of TEUs from China in July 2024. Importers have shifted to suppliers in Southeast Asia. Containerized imports from that region rose 24% over the previous July, reaching records of 542,414 TEUs in June and 581,803 in July. In fact, the U.S. imported more goods from Southeast Asia in the months March – June than from China (Wallis 2025).
The second greatest increase was in imports from countries on the Indian subcontinent. They also reached a record in July of 152,630 TEUs – 21% above July 2024.
Vietnam and India have much better records of compliance with ISPM#15 than does China: only one of 257 consignments from Vietnam and three of 1,549 consignments from India inspected over the period 2010 – 2020 harbored pests. Thus, from the perspective of introduction of non-native tree-killing insects, the shift to Southeast Asia and India is a plus. However, this improvement might not last. I expect that the 50% tariff on most goods from India that came into effect in late August 2025 will result in a steep fall-off in imports from that country.
Imports from Southern Europe also rose 7% from a year earlier to 155,587 TEUs. Imports from Northern Europe were essentially flat over the July 2024 – July 2025 period.

Ports
Shifts in trade patterns also appear in port data. The Port of Los Angeles received 542,940 TEUs in July, a 10% increase from a year earlier and the highest monthly total for the port since August 2024. However, it was Houston that saw the strongest year-over-year import growth; the 184,418 TEUs entering in July 2025 volume were 18.5% higher than the number imported in July 2024. Imports from Southeast Asia saw a 63% increase; those from China rose by 9.8% [Angell].
As you might remember, pest detections by CBP have risen at ports in America’s southeast: at the National Plant Board meeting in July, representatives of APHIS and state phytosanitary agencies expressed surprise about this finding. I reminded the group that ports in that region had been receiving higher import volumes in recent years, including from Asia through the widened Panama Canal. I added that there had been problems with dunnage in the port of Houston.
De Minimis packages
As of 29 August 2025, the United States is imposing tariffs on small-value imports that previously could enter the country tax-free. In 2016, the U.S. raised the threshold from $200 to $800. Importers of these packages not only avoided paying taxes on this newly expanded list of items. They also were subjected to minimal processing, including inspections (Chapell). This change coincided with on-line shopping becoming the norm. De minimis shipments started to dominate cargo entering the U.S. According to a press release from the Bureau of Customs and Border Protection, cited by NPR, the number of de minimis shipments grew from 140 million in 2014 to 1.36 billion in 2024.
Not coincidentally, phytosanitary officials have expressed growing concern about on-line sales of plant species considered invasive in one or more states, and exacerbated appearance of items infested by plant pests. These concerns have been voiced at National Plant Board meetings since at least 2021. At that meeting, then APHIS Deputy Administrator Osama el-Lissy said that managing
e-commerce was a priority of the new Biden Administration. The topic has been on the NPB agenda since then. Two kinds of shipments raise concern: those by North American suppliers that send plants or other items that violate regulations of the destination state, and those from abroad. All recognize that persuading foreign suppliers to comply with U.S. regulations is nearly impossible. At this year’s meeting, Acting Deputy Administrator Matt Rhoads conceded that APHIS has not yet figured out how to curtail this risk. The volume of illegal imports can be huge: an illegal shipment of tens of thousands of black pine (Pinus thunbergii) seedlings was sent to Georgia. State officials found out about the importation and stopped sale of the plants. Although the Trump Administration’s decision to end the de minimis exemption was not prompted by the plant health risks, it will probably help reduce it.
Imports during the Pandemic: will we soon see a jump in new detections?
We already know that import volumes first fell dramatically during the COVID-19 pandemic, then rebounded to record levels. According to David Lynch (citation below), in 2021 the Port of Los Angeles handled more than 535,000 incoming shipping containers in May 2021. During that month and three others in 2021, the number of arriving containers exceeded the single busiest month in 2019 (476,000) [p. 257]. Other ports also saw increased volume. Lynch discusses how this import surge stressed capacity of ports, warehouses, and transportation systems (truckers and railroads). He does not examine how this surge might have affected traders’ compliance with wood packaging treatment requirements or phytosanitary agencies’ ability to enforce those rules. Those agencies’ funding had decreased during the pandemic drought.
Five years have passed since this disruptive swing from low numbers to record-breaking quantities. Will we begin to see evidence — trees stressed by newly introduced insects or pathogens?
SOURCES
Angell, M. Journal of Commerce. Whipsaw from Trump’s tariffs drove US container import record in July. August 13, 2025. https://www.joc.com/article/whipsaw-from-trumps-tariffs-drove-us-container-import-record-in-july-6062634
Chappell, B. 2025. This rule made many online purchases dirt cheap for U.S. consumers. Now it’s ending. National Public Radio All Things Considered August 28, 2025. https://www.npr.org/2025/08/28/nx-s1-5519361/de-minimis-rule-tariffs-consumers-imports-trump
Lynch, D.J. 2025. The World’s Worst Bet: How the Globalization Gamble Went Wrong (and what would make it right) Public Affairs, New York
Robb, L. Journal of Commerce. US retailers project big year-over-year import declines to close out 2025. August 8, 2025. https://www.joc.com/article/us-retailers-project-big-year-over-year-import-declines-to-close-out-2025-6060323
Wallis, K. Surging Southeast Asia volumes strain Intra-Asia Capacity. https://www.joc.com/article/surging-southeast-volues-strain-intra-asia-capacity-6078465
Posted by Faith Campbell
We welcome comments that supplement or correct factual information, suggest new approaches, or promote thoughtful consideration. We post comments that disagree with us — but not those we judge to be not civil or inflammatory.
For a detailed discussion of the policies and practices that have allowed these pests to enter and spread – and that do not promote effective restoration strategies – review the Fading Forests report at http://treeimprovement.utk.edu/FadingForests.htm
Or