EAB in Eastern Europe – Worse (+ war!)

A special issue of the journal Forests (Vol. 13 2022) seeks to improve understanding of the root causes of exacerbated threats from insect pests. The issue contains 15 papers; most focus on geographic areas other than North America. The journal is open access!

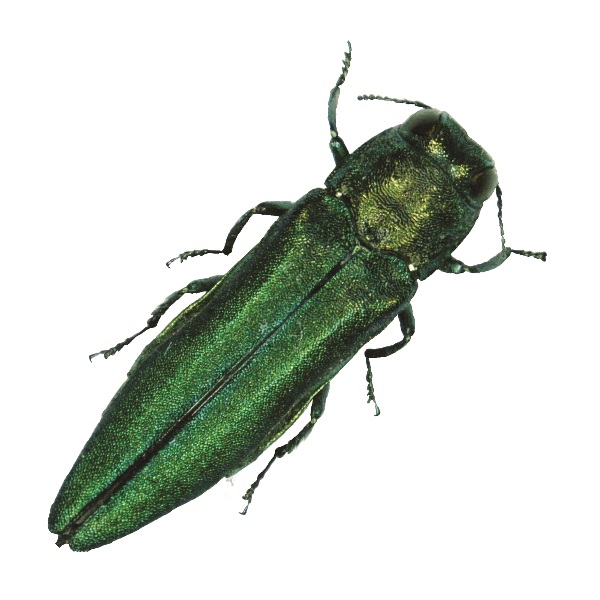
Choi and Park (full citations below) link increased pest risk to climate change and increased international trade. They provide brief summaries of all 15 papers. My focus here is on two articles that provide updates on the status of the emerald ash borer (EAB Agrilus planipennis) in Russia and Ukraine. The article by Davydenko et al. also examines interactions between EAB and the invasive pathogen Hymenoscyphus fraxineus, which causes ash dieback disease. In other blogs I will look at insects linked to North America (both species from North America that threaten forests on other continents, and species in Russia that pose a threat to North America) and at the overall Russian experience.

I blogged about EAB invasion of Russia in April 2021 so this is an update.

Musolin et al. (2022) (full citations below) remind us that the EAB invasions of North America and Russia were detected almost simultaneously: in Michigan and Ontario in 2002 and in European Russia (Moscow) in 2003. They conclude that both invasions probably originated from a common source (most probably China). They date the introduction to the late 1980s or early 1990s; pathways might have been wooden crafts, wood packaging, or ash seedlings. Nate Siegert used dendrological studies to estimate a similar introduction date for the North American invasion.

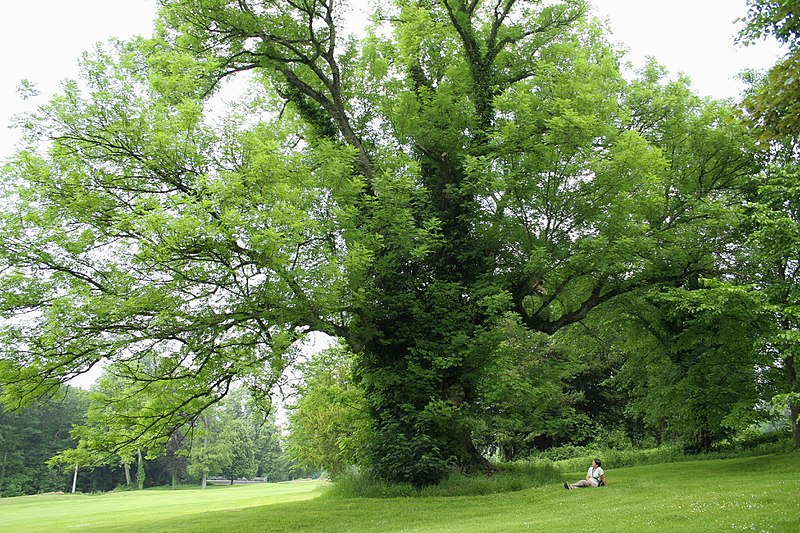
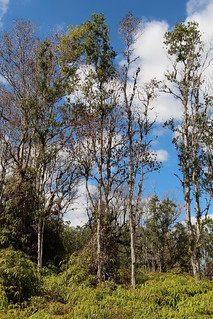
European ash (Fraxinus excelsior) specimen in Belgium; photo by Jean-Pol Granmont

EAB has spread far in the intervening 30 + years. By early 2022, outbreaks were recorded in five Canadian provinces, 35 US states, 18 provinces and several cities in European Russia, and two provinces in Ukraine (Musolin et al. 2022) Davydenko et al. report that EAB had also established in eastern Belarus, but provide no details.

As demonstrated in the earlier blog and confirmed by Musolin et al. (2022) and Davydenko et al., the EAB has spread much faster to the southwest than directly West and to the Northwest. Davydenko et al. attribute the slower spread in the St. Petersburg area to the colder and wetter climate of this region – which is ~1200 km north of Ukraine. While the EAB reproduces in two cohorts in Eastern Ukraine, to the north the beetle requires more than one year to complete its life cycle, at least two years in the St. Petersburg area. In 2021, Musolin et al. 2021 speculated that pressure by the native parasitoid Spathius polonicus Niezabitowski might also be slowing EAB’s spread in the North. In 2022, Musolin does not address this possibility. (I note that APHIS has approved two Spathius species as biocontrol agents in the U.S.).

Musolin et al. (2022) and Davydenko et al. agree that the EAB poses real threat to ash in central and western Europe. In both the south (Davydenko et al.) and in the northwestern area around St. Petersburg ash grows in continuous stretches, linking Russia or Ukraine to Romania, Hungary, Slovakia, and Poland. These ash consist of both natural woodlands, and extensive plantings of both one of the European ash species, F. excelsior and the highly-susceptible North America green ash (F. pennsyvanica).  Furthermore, the EAB is an excellent hitchhiker on vehicles & railway cars. Davydenko et al. also consider the beetle to be a strong flyer. Musolin et al. (2022) cite a separate analysis in stating that EAB can probably invade most European countries. Only some regions of Norway, Sweden, Finland, Ireland, and Great Britain are probably protected by their low temperatures.

Both articles were written too early to consider how the current war in the relevant area of Ukraine might affect spread of the EAB, although we know Ukrainians are cutting firewood. The war has certainly interrupted monitoring and other efforts.

The sources agree on EAB’s severe impacts. Musolin et al. (2022) notes that the beetle has killed millions of trees in the forests and urban plantings in North America, European Russia, and Eastern Ukraine. Davydenko et al. note that the Fraxinus genus is one of the most widely distributed tree genera in North America. They then assert that the EAB could virtually eliminate it. I know that North American scientists agree that the beetle threatens many species in the genus; but do they agree that the genus would be “virtually eliminated”?  Davydenko et al. think the EAB could pose similar threat to Euro ash F. excelsior.

Musolin et al.  2022 estimate that potential economic losses in Europe could reach US$1.81 billion. By this indicator, the species ranks fourth among the most “costly” invasive pests. Russia spent an estimated US$258.9 million between 2011 and 2016.

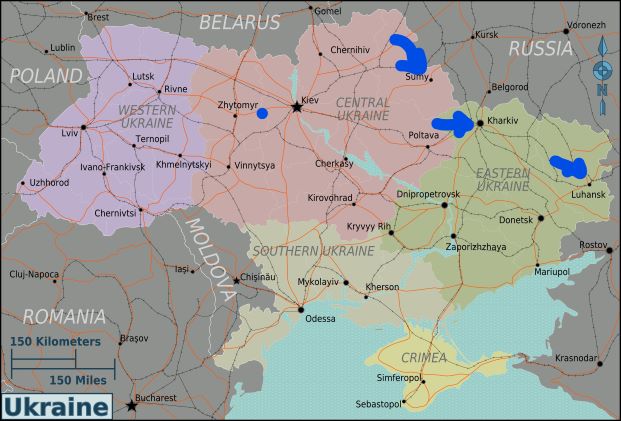
areas of Ukraine where studies conducted

Species’ varying vulnerability

Musolin et al. (2022) cite experience in the Moscow Botanical Garden as showing that only two Asian species — Chinese ash, F. chinensis, and Manchurian ash, F. mandshurica — are were resistant to the EAB. The beetle killed both North American ash (i.e., F. pennsylvanica and F. americana) and European ash (i.e., F. excelsior, F. angustifolia, and F. ornus).

Experience in the field in Ukraine (Davydenko et al.) suggests that F. excelsior is less vulnerable to EAB than F. pennsyvanica. The overwhelming majority of EAB infestations were found on the American species. Furthermore, although similar densities of EAB larvae were found in colonized branches of both species, the proportion of larvae that were viable was significantly higher on F. pennsyvnica (91.4%) than on F. excelsior (76.1%). However, the reverse was found in the Moscow and St. Petersburg regions. Davydenko et al. don’t address directly whether they think this discrepancy is attributable to climatic factors or to differences in vulnerability between trees growing in native forests vs. human plantings. They did note that all observed cases of infestation of the native F. excelsior in Ukraine occurred in artificial plantings rather than in natural woodlands.  

Interactions with Ash Decline

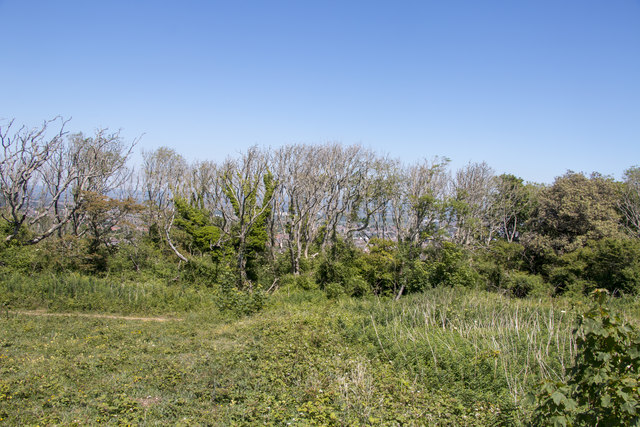
ash dieback disease – unfortunately pictured in the UK.
cc-by-sa/2.0 – © Adrian Diack – geograph.org.uk/p/6497286

Davydenko et al. studied parts of Eastern Ukraine where EAB was entering areas already infected by the invasive ascomycete fungus Hymenoscyphus fraxineus (cause of ash dieback, ADB). [Two of these regions — Luhansk and Kharkiv – have been the very center of the current war.] Other studies have shown that ~1 to 5% of F. excelsior trees exhibit some resistance to ADB. These trees are thus a potential foundation for future propagation and restoration of ash in Europe – if enough of them survive attack by EAB.

They found that F. excelsior is more resistant to EAB than F. pennsylvanica, but more susceptible to ADB.

The Luhansk and Kharkiv regions have both EAB and ADB; the Sumy region has only the pathogen. EAB probably invaded the Luhansk region by 2016 (although it was detected only in 2019). The proportion of ash trees (both native and introduced species) infested rose from ~ 10–30% in 2019 to 60 – 90% by 2020–2021. The EAB arrived later in the Kharkiv region, to the Northwest, but the proportion of infested trees was similar by 2021. Combining the two regions, 75% of F. pennsylvanica trees were EAB-infested, whereas only 31% of F. excelsior trees were.

Frequencies of infections by ADB were the reverse. Pooled data from all three study regions showed 21% of F. pennsylvanica trees were infected vs. 42% of F. excelsior. In the plots invaded by both EAB and ADB (in Luhansk and Kherson regions), 4%of F. pennsylvanica were affected by both invasive species vs. 14% of F. excelsior trees. Davydenko et al. conclude that ADB facilitates EAB attack on F. excelsior trees

The impact of EAB is seen in the fact that overall mortality rates were higher in F. pennsylvanica despite the fact that in the Sumy region mortality rates were higher in F. excelsior because of the disease (EAB was absent from this region).  On the other hand, EAB infests and kills F. pennsylvanica trees regardless of their prior health condition (i.e., regardless of presence/absence of ADB).

Still, fewer than half the F. excelsior trees in sites affected by both EAB & ADB (in Luhansk and Kherson regions) have died. Davydenko et al. think the survivors constitute a source of material for eventual propagation. These trees need to be carefully mapped – a task certainly not facilitated by the war!

Davydenko et al. conclude that

1. Invasion of EAB in Ukraine occurred 2–3 years before detection in 2019 [I think this is actually quite prompt for detection of EAB invasions]; the invasion is currently expanding both in terms of newly infested trees and invaded geographic area.

2. Fraxinus excelsior (at least when growing in the interior of forest stands) is more resistant to EAB than F. pennsylvanica (when growing in field shelterbelts).

3. Fraxinus excelsior is more susceptible to ADB than F. pennsylvanica.

4. Infection by ADB is likely to predispose F. excelsior to infestation by EAB.

5. Ash trees infected by ADB are predisposed for the colonization by ash bark beetles Hylesinus spp.  [I did not discuss these data.]

6. Inventory and mapping of surviving F. excelsior, affected by both ADB and EAB, is necessary to acquire genetic resources for the work on strategic, long-term restoration of devastated areas, thereby tackling a possible invasion of EAB to the EU.

I was surprised that Musolin et al. (2022) think EAB’s host shift from local Asian ash species to introduced North America ash planted in the Russian Far East and China triggered EAB outbreaks in Eastern China that contributed to the beetle’s introduction to North America and European Russia. American scientists apparently agree — Haack et al. (2022) refer to both this episode and a similar to one posited for Asian longhorned beetle (Anoplophora glabripennis) — that widespread planting of Populus plantations led to rapid expansion of ALB in northern China, and the pest-weakened wood was then used in wood packaging.

SOURCES

Choi, W.I.; Park, Y.-S. Management of Forest Pests and Diseases. Forests 2022, 13, 1765. https://doi.org/10.3390/f13111765

Davydenko, K.; Skrylnyk, Y.; Borysenko, O.; Menkis, A.; Vysotska, N.; Meshkova, V.; Olson, Å.; Elfstrand, M.; Vasaitis, R. Invasion of emerald ash borer Agrilus planipennis and ash dieback pathogen Hymenoscyphus fraxineus in Ukraine-A concerted action. Forests 2022, 13, 789.

Haack RA, Hardin JA, Caton BP and Petrice TR (2022) Wood borer detection rates on wood packaging materials entering the United States during different phases of ISPM#15 implementation and regulatory changes. Front. For. Glob. Change 5:1069117. doi: 10.3389/ffgc.2022.1069117

Musolin, D.L.; Selikhovkin, A.V.; Peregudova, E.Y.; Popovichev, B.G.; Mandelshtam, M.Y.; Baranchikov, Y.N.; Vasaitis, R. North-Westward Expansion of the Invasive Range of EAB, Agrilus planipennis Fairmaire (Coleoptera: Buprestidae) towards the EU: From Moscow to Saint Petersburg. Forests 2021, 12, 502. https://doi.org/10.3390/f12040502

Musolin, D.L.; Kirichenko, N.I.; Karpun, N.N.; Aksenenko, E.V.; Golub, V.B.; Kerchev, I.A.; Mandelshtam, M.Y.; Vasaitis, R.; Volkovitsh, M.G.; Zhuravleva, E.N.; et al. Invasive insect pests of forests and urban trees in Russia: Origin, pathways, damage, and management. Forests 2022, 13, 521.

Siegert, N.W.  2006.  17th USDA Interagency Research Forum on Gypsy Moth and Other Invasive Species. Annapolis, MD. January 10-13, 2006.

Posted by Faith Campbell

We welcome comments that supplement or correct factual information, suggest new approaches, or promote thoughtful consideration. We post comments that disagree with us — but not those we judge to be not civil or inflammatory.

For a detailed discussion of the policies and practices that have allowed these pests to enter and spread – and that do not promote effective restoration strategies – review the Fading Forests report at http://treeimprovement.utk.edu/FadingForests.htm

or
www.fadingforests.org

US invasive species — updated USGS database now on-line

ōhiʻa rust on Hawai`i; photo by J.B. Friday

The U.S. Geological Survey (USGS) has published an updated register of introduced species in the United States. The master list contains 14,700 records, of which 12,571 are unique scientific names. The database is divided into three sub-lists: Alaska, with 545 records; Hawai`i, with 5,628 records; and conterminous (lower 48) United States, with 8,527 records.

The project tracks all introduced (non-native) species that become established, because they might eventually become invasive. The list includes all taxa that are non-native everywhere in the locality (Alaska, Hawai`i, or 48 conterminous states) and established (reproducing) anywhere in that locality.

Each record has information on taxonomy, a vernacular name, establishment means (e.g.,  unintentionally, or assisted colonization), degree of establishment (established, invasive, or widespread invasive), hybrid status, pathway of introduction (if known), habitat (if known), whether a biocontrol species, dates of introduction (if known; currently 47% of the records), associated taxa (where applicable), native and introduced distributions (when known), and citations for the authoritative source(s) from which this information is drawn. 

The 2022 version is more complete re: plant pathogens than earlier iterations; I thank the hard-working compilers for their efforts!

Hawai`i

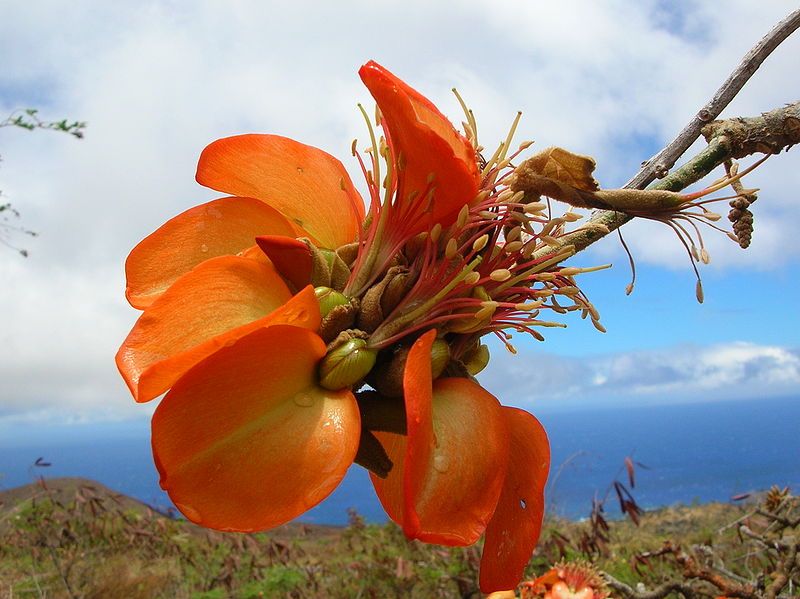
wiliwili tree (Erythrina sandwicensis); photo by Forest and Kim Starr

Among the non-native species listed as being in Hawai`i are 3,603 Arthropods, including the following about which I have blogged:

The list also includes 25 fungi, among them the two species of Ceratocystis that cause rapid ʻōhiʻa death; DMF & blog 270 and the ʻōhiʻa or myrtle rust, Austropuccinia psidii.

Also listed are 95 mollusk species and 20 earthworm species. I wonder who is studying the worms’ impacts? I doubt any is native to the Islands.

The Hawaiian list contains 1,557 non-native plant species. Families with largest representation are Poaceae (grass) – 223 species; Fabaceae (beans) – 156 species; and Asteraceae – 116 species. About a third of the plant species – 529 species – are designated as “widespread invaders”. This number is fifteen times higher than the numbers in lists maintained by either the Hawaiian Ecosystems At Risk project (106 species) [HEAR unfortunately had to shut down a decade ago due to lack of funds]; or Hawaiian Invasive Species Council (80 species). Furthermore, some of the species listed by HEAR and HISC are not yet widespread; the lists are intended to facilitate rapid responses to new detections.  We always knew Hawai`i was being overrun by invasive species!

Among the 529 most “widespread invaders” are the following from the most introduced families:

  • Poaceae – Agrostis stolonifera, 6 Cenchrus spp, 2 Cortaderia spp, 3 Eragrostis,8 Paspalum, 4 Setaria spp, 2 Urochloa (Poacae)
  • Fabaceae – 3 Acacia, 2 Prosopis

Other families have fewer introduced species overall, but notable numbers of the most widespread invaders:

  • Euphorbiaceae – 8 spp. of Euphorbia
  • Cyperaceae – 6 spp. of Cyperus
  • Myrtaceae – Melaleuca quinquenervia, 2 Psidium, Rhodomyrtus tomentosa rose myrtle, 3 Syzygium [rose myrtle has been hard-hit by the introduced myrtle rust fungus]
  • Zingiberaceae – 3spp. Hedychium (ginger)
  • Anacardiaceae — Schinus molle (Peruvian peppertree); USGS considers congeneric S. terebinthifolia to be somewhat less widespread.

Plus many plant taxa familiar to those of us on the continent: English ivy, privet, castor bean, butterfly bush, Ipomoea vines  … and in more limited regions, Japanese climbing fern Lygodium japonicum.

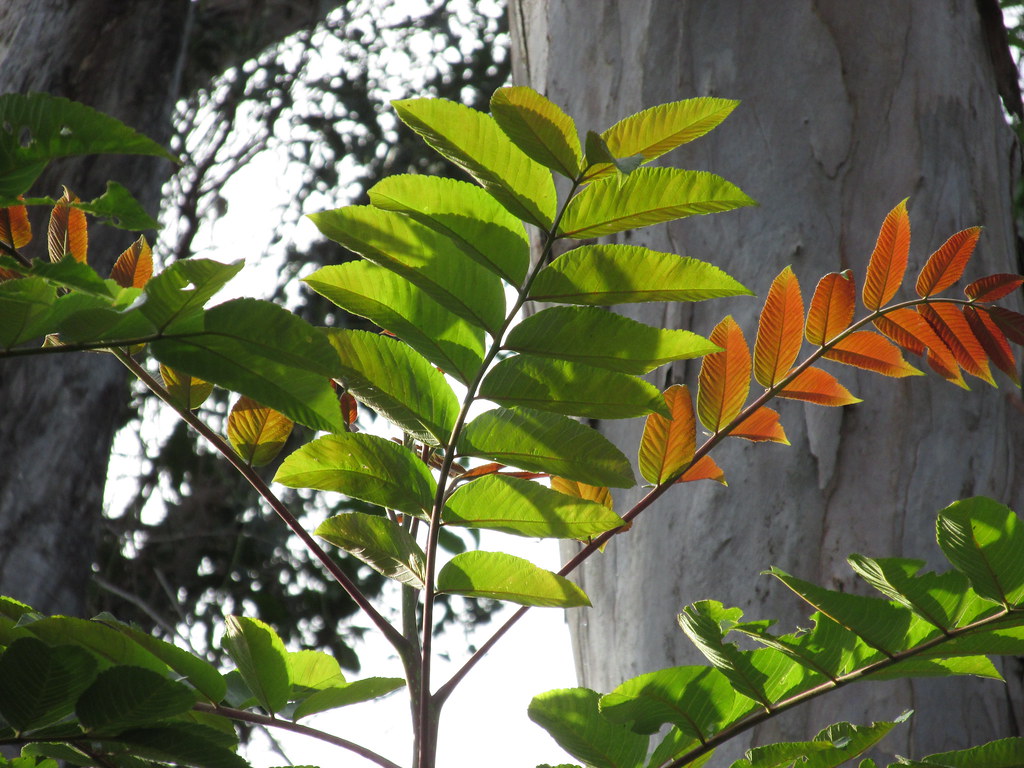
Rhus sandwicensis; photo by Forest and Kim Starr

I learned something alarming from the species profiles posted on the HISC website: the Hawaiʻi Division of Forestry and Wildlife and Hawaiʻi Department of Agriculture are considering introduction of a species of thrips, Pseudophilothrips ichini, as a biocontrol agent targetting S. terebinthifolia. I learned in early 2019, when preparing comments on Florida’s proposed release of this thrips, that Pseudophilothrips ichini can reproduce in low numbers on several non-target plant species, including two native Hawaiian plants that play important roles in revegetating disturbed areas. These are Hawaiian sumac Rhus sandwicensis and Dodonea viscosa. The latter in particular is being propagated and outplanted in large numbers to restore upland and dryland native ecosystems. While the environmental assessment prepared by the USDA Animal and Plant Service says the thrips causes minimal damage to D. viscosa, I am concerned because of the plant species’ ecological importance.  Of course, the two Schinus species are very damaging invasive species in Hawai`i … but I think introducing this thrips is too risky. [To obtain a copy of CISP’s comments, put a request in comments section. Be sure to include your email address in your comment; the section algorithm does not include email addresses (how inconvenient!).]

Continental (lower 48) states

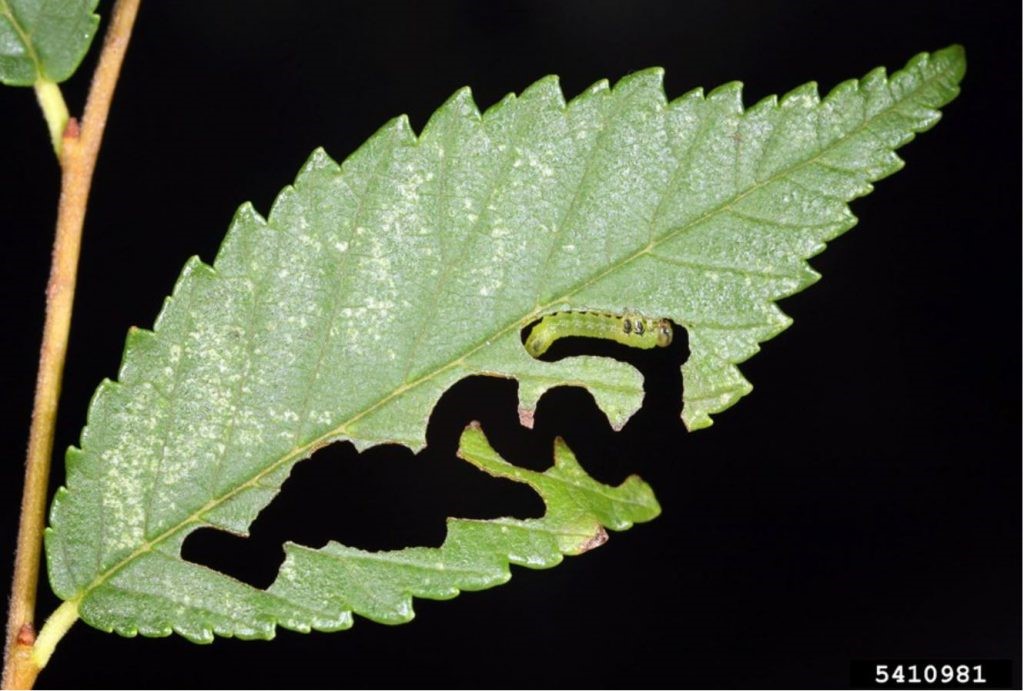
Among the 8,500 species listed in the USGS Register for the 48 continental states are 4,369 animals, among them 3,800 arthropods; 3,999 plants; and just 89 fungi. Among the arthropods, there are 1,045 beetles and 308 lepidopterans. The beetles listed include 12 Agrilus (the genus which includes emerald ash borer and goldspotted oak borer.) It does not include the elm zig-zag sawfly USGS staff have not found any publications documenting its U.S. occurrences. Among the microbes are six Phytophthora (P. cinnamomi, P. lateralis, P. pseudocryptogea, P. quercina, P. ramorum, P. tentaculata). Profiles of several of these species are posted at www.dontmovefirewood.org; click on “invasive species”, then scroll using either Latin or common name.

elm zig-zag sawfly; photo by Gyorgy Czoka via Bugwood

Citation:

Simpson, Annie, Pam Fuller, Kevin Faccenda, Neal Evenhuis, Janis Matsunaga, and Matt Bowser, 2022, United States Register of Introduced and Invasive Species (US-RIIS) (ver. 2.0, November 2022): U.S. Geological Survey data release, https://doi.org/10.5066/P9KFFTOD

United States Register of Introduced and Invasive Species; US-RIIS ver. 2.0, 2022

 If you would like to contribute to future versions of the US-RIIS, please email the project leaders at us-riis@usgs.gov

Posted by Faith Campbell

We welcome comments that supplement or correct factual information, suggest new approaches, or promote thoughtful consideration. We post comments that disagree with us — but not those we judge to be not civil or inflammatory.

For a detailed discussion of the policies and practices that have allowed these pests to enter and spread – and that do not promote effective restoration strategies – review the Fading Forests report at http://treeimprovement.utk.edu/FadingForests.htm

or
www.fadingforests.org

Plants Sold – Increasing % of Exotics

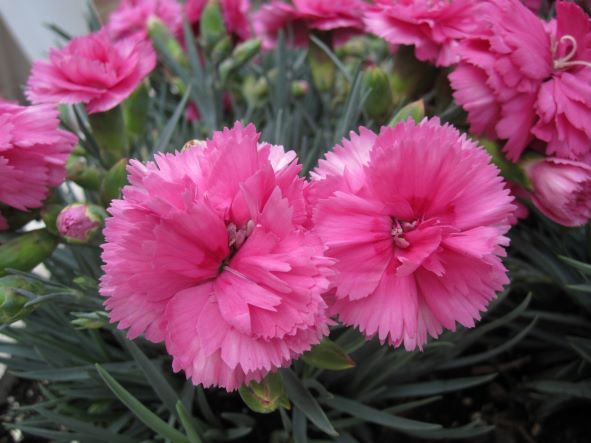
carnation (Dianthus caryophyllus) photo by Noordzee23 via Wikimedia; carnations have been big sellers for 250 years

Plants sold in nurseries directly influence urban landscapes by providing gardens and other habitats that support humans and birds, insects, and other organisms. Doug Tallamy, though, has described ways that non-native plants fall short in providing habitat for native wildlife. Of course, non-native plants also indirectly influence natural landscapes by acting as a major source of invasive species. [see blog – includes links to regional invasive plant lists; and here] Imported plants also can carry non-native insects and pathogens – about which I blog frequently! To review these blogs, scroll down below the archives to the “categories” section and click on “plants as pest vectors”.

Now Kinlock, Adams, and van Kleunen (full citation at the end of this blog) have published a new paper that sheds more light on these issues. They analyzed the ornamental plants sold in US nurseries over 225 years (from 1719 to 1946). Their database, drawn from an earlier publication by Adams (see Sources at end of blog), included records of 5,098 ornamental vascular plant species offered for sale by 319 US nursery catalogs published over this period.

They note that present-day urban yards in the continental United States are planted in a diverse array of plants and the plants are predominately non-native species. Also, there is relatively little variation in species planted from one region to another, especially when compared to regional variation in natural areas). These patterns reflect the history of US horticulture.

Seventy percent (3,587) of the 5,098 ornamental vascular plant species offered by the 319 nurseries over those 200 years were non-native to the continental United States. They believe that the number of non-native species offered for sale has probably continued to increase in the 70 years since their study ended. They cite a study showing that 91% of tree species sold by nurseries in southern California during the 20th and early 21st centuries were not native to that state. A similar figure comes from a study of cultivated plants grown in Minneapolis–Saint Paul. There 66% of plants were non-native. (Kinlock, Adams, and van Kleunen note that 70% of species cultivated in yards of five British cities are non-native. In contrast, only 23% of cultivated plants in 18 Chinese cities were non-native.)

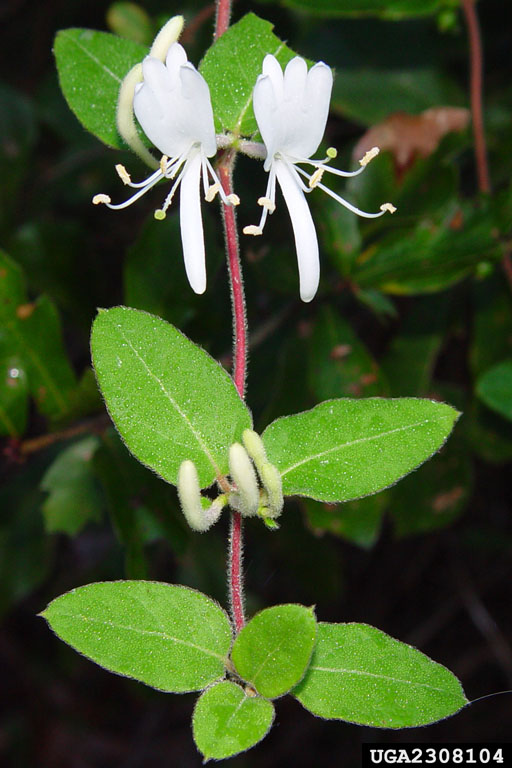
Kinlock, Adams, and van Kleunen note that two examples of non-native plants that have become invasive were among most common species available from nurseries beginning in the mid-19th Century: Japanese honeysuckle (Lonicera japonica) was available in 78 nurseries, and Japanese barberry (Berberis thunbergia) in 46 nurseries.

Japanese honeysuckle; photo by Chuck Bargeron, Bugwood

 Historical Trends

The earliest commercial horticulture in colonies that became the United States was in the mid-17th Century. It involved imports of Eurasian fruit trees to establish orchards to provide familiar foods. Ornamental horticulture became popular earlier than I expected. Prince Nurseries was established in 1732 in Flushing, NY. It was followed by additional nurseries in New York, Philadelphia, and Massachusetts. Originally these businesses imported Old World nursery stock and seeds – again to provide familiar foods and take advantage of relationships with European contacts.

Nurseries proliferated in the 1820s in the population centers of the Atlantic coast. As people of European ancestry moved west, so did nurseries. Kinlock, Adams, and van Kleunen point out an interesting aspect of these changes: proliferation of both was aided by technology: steamboats, canals, highways, and improved mail service. Before 1800, nearly all nurseries were in the Mid-Atlantic, New England, and South. Nurseries appeared in the Great Lakes region by the 1830s. Expansion of rail lines connected nurseries from coast to coast by the 1870s. By 1890, there were more than 4,500 nurseries across the continent.

California, Florida, and Oregon are now the states with the most horticultural operations and sales (as of 2019).

The types of plants offered for sale proliferated throughout the 19th Century.  The species richness of US nursery flora peaked in the early 20th Century. It decreased in the 1925 – 1946 period, possibly attributable to some combination of war-related interruptions to trade and a shift in gardeners’ focus away from ornamentals to vegetables. Another factor was adoption of international and interstate phytosanitary regulations in the early 20th Century. The post-World War II economic boom led to a new diversification of US nursery flora. In one study, a Los Angeles nursery experienced the largest increase in species richness during 1990–2011. They believe this increase was probably matched across the country. Global plant collection and importation mediated by US botanical gardens and nurseries remain active.

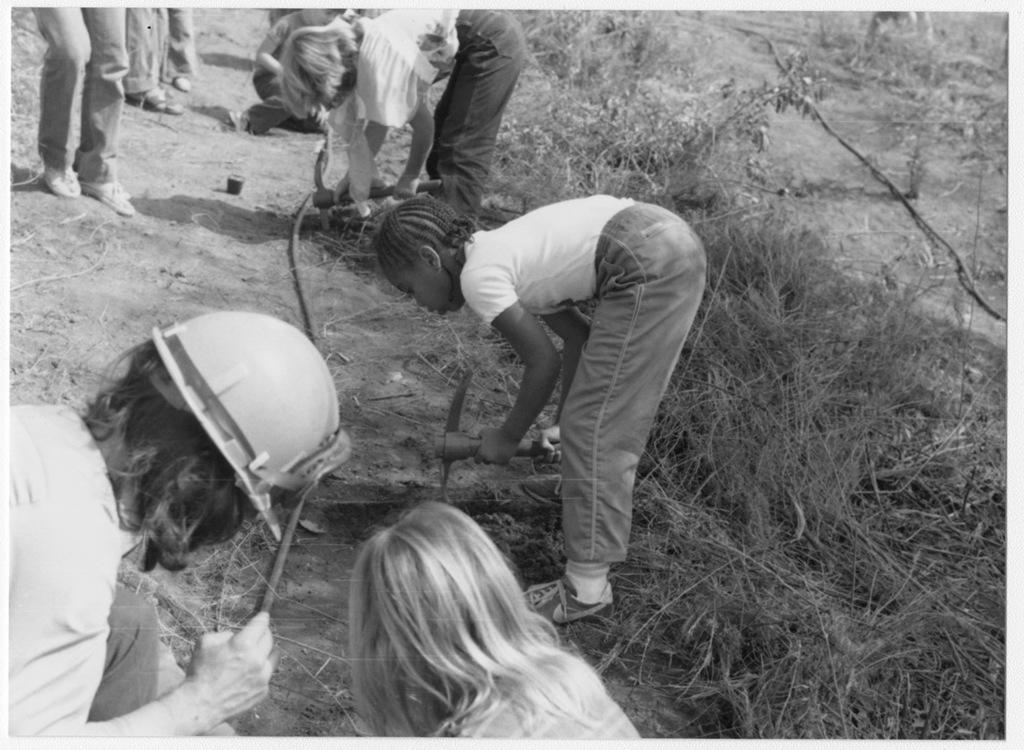
planting of Eucalyptus seedlings in California during 1980s; National Archives photo

Over time, nursery floras in the various regions became more similar to each other. The floras of Mid-Atlantic and New England nurseries differed before 1775, then became similar. Nurseries in the Great Lakes region also shifted toward offerings in neighboring regions. Later, nurseries in the South and West also began offering a higher proportion of species commonly sold across the continent. The nursery floras of Great Lakes and Great Plains regions were consistently similar. Still, the flora in Western nurseries still retain some unique aspects. California is the only state with a Mediterranean climate. Nurseries there sought adapted plant species, especially from an entirely new source — Australasia. (The authors note that Acacia and Eucalyptus genera, while important in California horticulture, are invaders in Mediterranean zones worldwide.) One might expect the need for plants in the Southwest to be drought-tolerant would prompt a unique nursery flora. However, the ubiquity of irrigation since the late 19th Century has blunted this necessity. Still, nursery flora in the desert biome had the most phylogenetic uniformity. The article does not discuss pressure to choose xeriscapes or otherwise adjust to current water shortages.

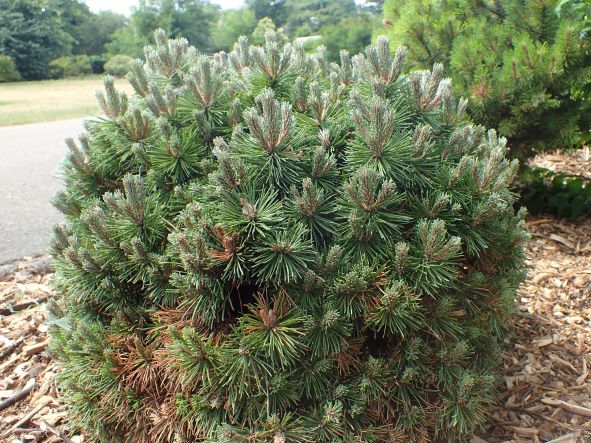
Pinus mogu – sought for xerescapes; photo by Krysztof Ziamk Kenraiz via Wikimedia

Growing Importance of Non-Native Species – Especially from Asia

Kinlock, Adams, and van Kleunen define “native” species as those native to the state in which it is sold; “adventive” species as native to the continental United States but not the specific state; and non-native or alien species as not native to the continental United States.

Applying these definitions, the proportion of native species in nursery flora has been consistently around 30-40% — except during the American Revolution. It rose to 70% in catalogs or advertisements published from 1775 to 1799. The authors do not speculate whether this reflected jingoism or interruptions in trade. The proportion of plant species that were adventive was 4% in the earliest period, then rose to 13% with improved transportation.  

A large proportion of the native species offered in the late 18th and early 19th centuries were grown for export to Europe (think John Bartram).

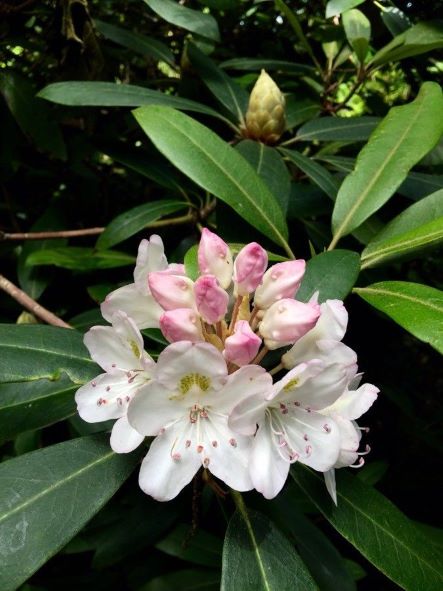
Rhodendron maximum; sent to Europe by John Bartram (& invasive in Great Britain and Ireland!); photo from Pl@ntNet.identify

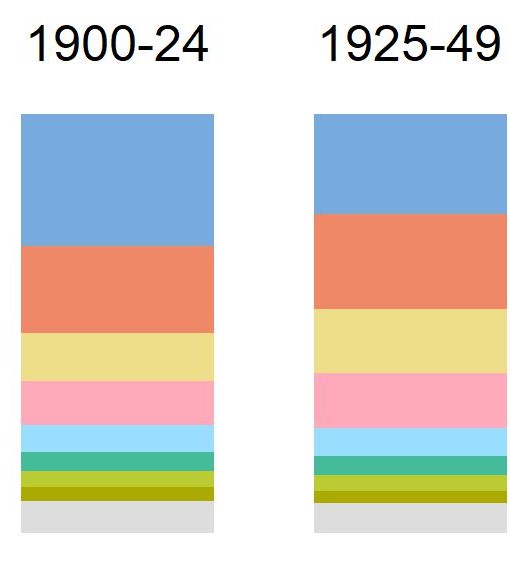
Throughout the 19th and 20th centuries, plants from new regions of the world with unique genetic lineages became increasingly available. Until the mid-19th Century, most non-native plants came from Europe and Eurasia. Beginning in 1850, plants native to temperate Asia composed an increasing percentage of non-native nursery flora. In the period 1900 – 1924, 19% of the ornamental nursery flora originated from temperate Asia. By the next period, 1925 – 1946, this percentage rose to 20.8%.At the same time, North American species (including some from Mexico, Canada, or Alaska) composed 21.9% of the nursery flora. (see graph).

% of species from various origins; North America – medium blue; temperate Asia – dark pink; Europe – tan; Eurasia – fuscia; Southern America – blue-green; Africa – yellow-green; Americas – olive

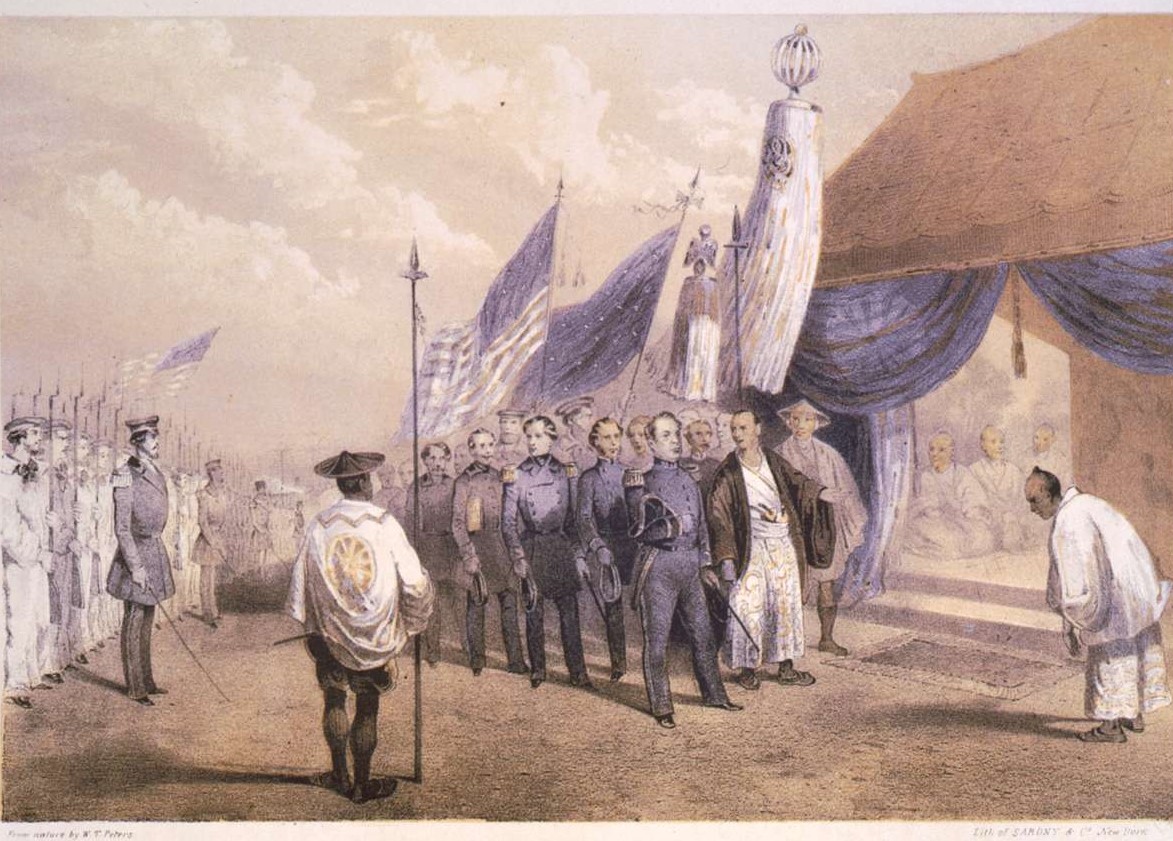
Plants from East Asia were particularly desirable for both biological and social reasons. First, because of climatic similarities between the two regions, East Asian plants thrived in the eastern United States. Second, popular ornamental genera had higher species richness in East Asia. Important social or cultural factors were a growing fascination with Japanese and Chinese-style gardens: forced “opening” of access to those countries in the 1840s and 1850s; and plant collecting expeditions sponsored by British and American institutions and private collectors. In 1898, the US Department of Agriculture established the Section of Seed & Plant Introduction; its purpose was to collect and cultivate economically useful non-native plants from throughout South America and Asia.

As I noted above, diversity of species in nursery offerings reached a peak in the first years of the 20th Century, concurrent with the first wave of US-sponsored plant collections; indeed, 70 species that were first listed after 1911 in their dataset were introduced by the USDA introduction program between 1912 -1942.

Commodore Perry in Japan; Library of Congress

Counter-pressures and Counter-measures

There were counter pressures during this period that – as mentioned above—probably contributed to a decline in plant introductions in later years. In the 1890s, several US states began requiring inspection of imported plant materials (spurred by plant disease outbreaks caused by spread of San Jose scale from California).

Congress adopted the Plant Quarantine Act in 1912; USDA implemented it through stringent regulations issued in 1919 (Quarantine-37). I have already noted interruption of trade associated with WWI and WWII. Kinlock et al. don’t mention the Great Depression that intervened, but I think it played a role, too. On the other hand, Q-37 was relaxed to target particular species or regions based on pest risk analysis. The article says the relaxation began in the 1930s, but I believe it actually was during the 1970s; see Liebhold et al. 2012. I have blogged several times about how well the current regulations – including the “NAPPRA” program – prevent introductions of invasive plants or damaging plant pests. To review these blogs, scroll down below the archives to the “categories” section and click on “plants as pest vectors”.

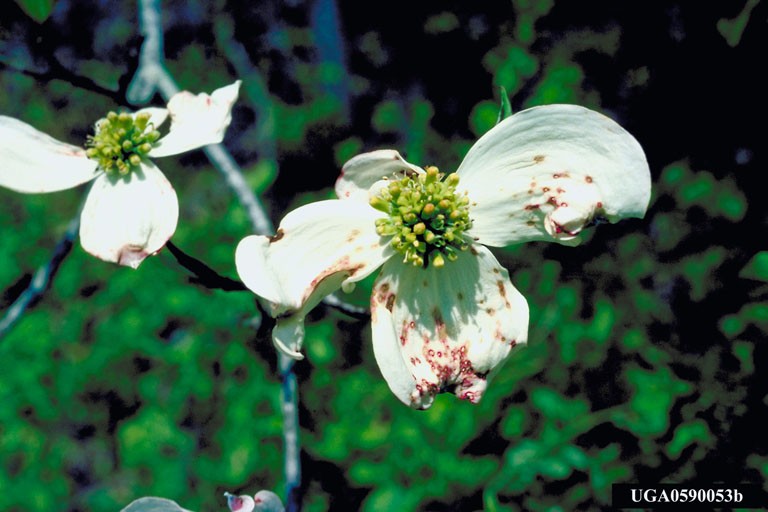
dogwood anthracnose; photo by Robert Anderson, USFS; via Bugwood

SOURCES

Adams, D.W. 2004. Restoring American Gardens: An encyclopedia of heirloom ornamental plants. Timber Press

Kinlock, N.L., D.W. Adams, M. van Kleunen. 2022. An ecological and evolutionary perspective of the historical US nursery flora. Plants People Planet. 2022;1–14. wileyonlinelibrary.com/journal/ppp3

Liebhold, A.M., E.G. Brockerhoff, L.J. Garrett, J.L. Parke, and K.O. Britton. 2012. Live Plant Imports: the Major Pathway for Forest Insect and Pathogen Invasions of the US. www.frontiersinecology.org

Posted by Faith Campbell

We welcome comments that supplement or correct factual information, suggest new approaches, or promote thoughtful consideration. We post comments that disagree with us — but not those we judge to be not civil or inflammatory.

For a detailed discussion of the policies and practices that have allowed these pests to enter and spread – and that do not promote effective restoration strategies – review the Fading Forests report at http://treeimprovement.utk.edu/FadingForests.htm

or
www.fadingforests.org

Plant Invasions’ Impacts on Wildlife

spotted knapweed (Centaurea maculosa); photo by Alan Vernon via Wikipedia

Litt and Pearson (full citation at the end of the blog) are trying to improve scientists’ ability to predict the impact of biological invasions. Their goal is to predict which organisms will be winners, which losers, in the face of anthropogenic ecosystem change.

They focus on exotic plant invasions, because they are ubiquitous. Furthermore, plant invasions affect ecosystems by reassembling the plant community in ways that affect the niches used by native animals and hence the animals’ success under the new conditions. After determining the differences between the traits exhibited by invasive plants vs. the native plants they are displacing, scientists can then identify which native animals are most likely to be affected, as well as how and why they might respond to exotic plant invasion. [Note that Doug Tallamy is looking at similar issues.]

Litt and Pearson have developed a framework to assess how plants’ traits might affect associated wildlife. Applying the framework requires certain baseline information about the ecosystem in question.

This knowledge is applied in stepwise fashion:

1) Identify the fauna of interest and their linkage to the native plant community. This association might be food or habitat values such as shelter. Then the researcher determines the relevant plant traits of importance to that animal and approximates the strength of the animal’s dependence on these traits. Note that the focus is on plant traits relevant to the animal users, rather than specific plant species.

2) Determine overall importance of the plant traits for the area under study by (a) averaging dependence of a representative subsample of individuals to obtain a community-level value for each plant species or functional group and (b) quantifying the relative abundance of the plant functional group in the community (e.g., cover or biomass).

3) Plot the way the animal species’ abundance changes with resource abundance.

4) Understand how the invasive plants will alter the distributions of the native plants’ traits and potentially introducing novel traits that might alter the faunal community.

Litt and Pearson reviewed earlier studies to test how well this framework explained the responses of three groups of fauna to plant invasions in different ecosystems.

searching for spotted knapweed; photo by Oregon Department of Agriculture

Spiders in invaded grasslands

Intermountain grasslands of western Montana are heavily invaded; non-native plants already comprise 25–60% of average total plant cover.

One group of native spiders construct their irregular webs entirely within a single plant. A second group – orb weavers – suspend their larger webs from multiple plants. The former depend on the architectural complexity of individual plants; they can build larger webs in plant species possessing greater branching and/or longer branches of the flowering stalks. Orb spiders depend more on the complexity of the overall plant community.

Plant architecture is closely tied to the plant’s functional groups, that is, whether they are grasses or forbs.

These grasslands are generally dominated by perennial grasses. The irregular-web spiders can use grasses, but strongly favor forbs, particularly those with the most complex flowering structures. Orb weavers are generalists, incorporating multiple plant species; but they also tend to favor forbs, presumably because they are more robust.

Invasive plants in the Western Montana grasslands are of two types: an annual grass, cheatgrass (Bromus tectorum), and numerous perennial and annual forbs. Cheatgrass largely replaces the dominant native grasses with a similar architecture – although cheat is shorter. The exotic forbs, which can collectively invade at levels comparable to cheatgrass, tend to be taller and more complex structurally than the native forbs. Thus, invasion by exotic forbs strongly shifts the community-level distribution of the key trait toward greater structural complexity by replacing the dominant, but structurally simplistic, native grasses, and the more diminutive native forbs. These changes increased the abundance of both spider groups, but especially the specialist irregular web weavers. They find the new conditions meet their needs. Both spider groups appeared to expand their realized niches in response to invasion, i.e., they are able to use a broader range of plant architectures than was available in the native system.

Chaetodipus sp. photo by J.N. Stuart

Rodents in semi-desert grasslands invaded by Lehmann lovegrass

In the semi-desert grasslands of the American southwest, native grasses and forbs provide food and habitat for a variety of rodents. This vegetation influences which species of rodents are present in two ways: the size of the plants’ seeds and the density of vegetative cover. Litt and Steidl examined both. They divided the rodents into separate guilds based on diet and preferred vegetative cover. The two sets of guilds did not overlap for all species.

In southern Arizona, the native plant community is dominated by several grass species and herbaceous forbs; most species produce relatively large seeds. Vegetative cover is generally low, but varies in a patchy fashion. The rodent communities in uninvaded native grasslands are dominated by seed-eaters that prefer sparse cover.

Invasion of these grasslands by Lehmann lovegrass (Eragrostis lehmanniana) results in increased vegetative cover but the grass produces very small seeds that probably provide little to no food for  rodents. Another result is a decrease in overall abundance of arthropods. The new conditions favor different rodent species from those most common in uninvaded habitat.

Two more specialized seed-eating rodent species, which seek both lower cover and larger seeds, decreased in abundance. A rodent species which favors lower vegetative cover and feeds on larger invertebrates also declined. In contrast, abundance increased for two other rodent species that prefer more dense cover and are more opportunistic in their feeding. One species surprised the scientists: Dipodomys merriami increased in abundance, despite the fact that this species favors more open environments. Perhaps other functional traits or biotic interactions are important to this species? There was no apparent change in abundance for three other species, suggesting either a lack of statistical power (2 were less abundant) or that these rodents were able to persist through a balance of positive and negative changes in food and habitat characteristics.

Lucy’s warbler [nest in saguaro, not cottonwood); photo by Dominic Sherony

Warblers in Riparian Habitats in the Southwest

Riparian habitats in the same desert region have been aggressively invaded by the exotic shrub saltcedar (Tamarix spp.). Litt and Pearson consider the findings of Mahoney et al. of this invasion’s impact on two ecologically similar warbler species. One, the yellow warbler (Setophaga petechia), is very widely distributed across North America; it is considered a generalist. The other, Lucy’s warbler (Oreothlypis luciae), is endemic to a small region of the southwest United States and northern Mexico.

The two species have similar feeding behaviors but differ in their nesting requirements. The yellow warbler constructs open cup nests in the branches of shrubs and trees. Lucy’s warbler nests in cavities in larger trees excavated by others. Hence, these species were expected to respond similarly to changes in food resources and foraging habitat, but differ in their responses to changes in nesting substrate.

Native vegetation in the region consists primarily of willows and cottonwoods in the riparian corridors, with oak and mesquite woodlands in the adjacent uplands. Saltcedar invasion rapidly displaces the willows; it takes much longer to displace cottonwoods since are large and long-lived. Upland vegetation is uninvaded and unaffected. While saltcedar is structurally similar to native willows, its leaf architecture allows more light to penetrate in saltcedar stands. This can exacerbate heat stress on nestlings in these hot, arid environments, as well as expose the nestlings to nest predation. These effects are exacerbated by the presence of a biocontrol leaf beetle (Diorhabda spp.), which cause widespread defoliation of saltcedar during nesting season. Meantime, the cavity nests used by Lucy’s warbler are barely affected.

The study by Mahoney et al. showed that in low-invasion riparian sites, the two warblers occur at comparable abundances. When saltcedar invasion replaces willows, yellow warblers decline by ~50% while there is no apparent change in abundance of Lucy’s warblers.

Litt and Pearson point out that their framework is based on two key assumptions that establish the context for its efficacy.

The first is that bottom-up forces fuel ecological processes. Plants are key to making the sun’s energy available to consumer animals and – thence to predators. Consumers’ and predators’ top-down effects are secondary. The authors’ framework thus provides better predictions of community outcomes when systems are predominantly structured by bottom-up forces. As top-down forces increase or when invasive plants differentially affect multiple dimensions of the consumer niche space, it will be more challenging to track and predict outcomes, as our rodent example demonstrates.

The second assumption is that exotic plant invasions will most strongly influence bottom-up processes. Invasive plants displace native plants and their plant traits, thus directly affecting consumers by altering the quality and quantity of food and habitat resources. However, plant community changes caused by plant invasions can also affect predators directly and indirectly via several interactions. These changes in predators’ abundance and/or their per capita effects on prey might create feedbacks that can complicate interpreting and predicting invasion outcomes.

Litt and Pearson concluded that their approach is promising but has inherent limitations linked to the dynamic nature of ecological systems.

[Ecologists continue to evaluate the impacts of saltcedar eradication efforts on another bird species, the federally endangered southwestern willow flycatcher (Empidonax extimus trailii). See, for example, Goetz, A., I. Moffit and A.A. Sher. 2022. Recovery of a native tree following removal of an invasive competitor with implications for endangered bird habitat. Biological Invasions Vol. 24, pp. 2769-2793.]

SOURCE

Litt, A.R. and D.E. Pearson. 2022. A functional ecology framework for understanding and predicting animal responses to plant invasion. Biol Invasions   https://doi.org/10.1007/s10530-022-02813-7 

& Supporting Information [warblers in riparian ecosystems invaded by tamarisk]

Posted by Faith Campbell

We welcome comments that supplement or correct factual information, suggest new approaches, or promote thoughtful consideration. We post comments that disagree with us — but not those we judge to be not civil or inflammatory.

For a detailed discussion of the policies and practices that have allowed these pests to enter and spread – and that do not promote effective restoration strategies – review the Fading Forests report at http://treeimprovement.utk.edu/FadingForests.htm

or
www.fadingforests.org

Invasive Species Costs Point to Inadequate Effort – especially Prevention

EAB-killed ash tree falls before it can be taken down; photo courtesy of former Ann Arbor mayor John Hieftje

Concerned by growing impacts of bioinvasion and inadequate responses by national governments worldwide and by international bodies, a group of experts have attempted to determine how much invasive species are costing. They’ve built the global database – InvaCost. See Daigne et al. 2020 here.

Several studies have been based on these data. In two earlier blogs, I summarized two of these articles, e.g., Cuthbert et al. on bioinvasion costs, generally, and Moodley et al. on invasive species costs in protected areas, specifically. Here, I look at two additional studies. Ahmed et al. focusses on the “worst” 100 invasives affecting conservation — as determined by the International Union of Conservation and Nature (IUCN). The second, by Turbelin et al., examines pathways of introduction. Full citations of all sources appear at the end of this blog.

It is clear from all of these papers that the authors (and I!) are frustrated by the laxity with which virtually all governments respond to bioinvasions. Thus more robust actions are needed. The authors and I also agree that data on economic costs influence political decision-makers more than ecological concerns. However, InvaCost – while the best source in existence — is not yet comprehensive enough to generate the thoroughly-documented economic data about specific aspects of bioinvasion that would be most useful in supporting proposed strategies.

Scientists working with InvaCost recognize that the data are patchy. At the top level, these data demonstrate high losses and management costs imposed by bioinvasion. The global total – including both realized damage and management costs – is estimated at about $1.5 trillion since 1960. In fact, these overall costs are probably substantially underestimates (Cathbert et al.). [For a summary of data gaps, go to the end of the blog.] Furthermore, they recognize that species imposing the highest economic costs might not cause the greatest ecological harm (Moodley et al).

citrus longhorned beetle exit hole in bonsai tree; USDA APHIS photo

Comparing estimated management costs to estimated damage, the authors conclude that countries invest too little in bioinvasion management efforts and — furthermore — that expenditures are squandered on the wrong “end” of bioinvasion – after introduction and even establishment, rather than in preventive efforts or rapid response upon initial detection of an invader. While I think this is true, these findings might be skewed by the fact that fewer than a third of countries reporting invasive species costs included data on specifically preventive actions. Cuthbert et al. notes that failing to try to prevent introductions imposes an avoidable burden on resource management agencies. Ahmed et al. developed a model they hope will overcome the perverse   incentives that lead decision-makers to either do nothing or delay.

  1. Why Decision-Makers Delay

Citing the InvaCost data, the participating experts reiterate the long-standing call for prioritizing investments at the earliest possible invasion stage. Ahmed et al. found that this was the most effective practice even when costs accrue slowly. They ask, then, why decision-makers often delay initiating management. I welcome this attention because we need to find ways to rectify this situation.

They conclude, first, that invasive species threats compete for resources with other threats to agriculture and natural systems. Second, Cuthbert et al. and Ahmed et al. both note that decision-makers find it difficult to justify expenditures before impacts are obvious and/or stakeholders demand action. By that time, of course, management of invasions are extremely difficult and expensive – if possible at all. I appreciate the wording in Ahmed et al.: bioinvasion costs can be deceitfully slow to accrue, so policy makers don’t appreciate the urgency of taking action.

Cuthbert et al. also note that impacts are often imposed on other sectors, or in different regions, than those focused on by the decision-makers. Stakeholders’ perceptions of whether an introduced species is causing a “detrimental” impact also vary. Finally, when efficient proactive management succeeds – prevents any impact – it paradoxically undermines evidence of the value of this action!

Ahmed et al. point out that in many cases, biosecurity measures and other proactive approaches are even more cost effective when several species are managed simultaneously. They cite as examples airport quarantine and interception programs; Check Clean Dry campaigns encouraging boaters to avoid moving mussels and weeds; ballast water treatment systems; and transport legislation e.g., the international standard for wood packaging (ISPM#15) [I have often discussed the weaknesses in ISPM#15 implementation; go to “wood packaging” under “Categories” (below the archive list)].

pallet “graveyard”; photo by Anand Prasad
  • Pathways of Species’ Introduction

Tuberlin et al. focus on pathways of introduction, which they say influence the numbers of invaders, the frequency of their arrival, and the geography of their eventual distribution. This study found sufficient data to analyze arrival pathways of 478 species – just 0.03% of the ~14,000 species in the full database. They found that intentional pathways – especially what they categorized as “Escape” – were responsible for the largest number of invasive species (>40% of total). On the other hand, the two unintentional pathways called “Stowaway” and “Contaminant” introduced the species causing the highest economic costs.

Tuberlin et al. therefore emphasize the importance of managing these unintentional pathways. Also, climate change and emerging shipping technologies will increase potential invaders’ survivability during transit. Management strategies thus must be adapted to countering these additive trends. They suggest specifically:

  • eDNA detection techniques;
  • Stricter enforcement of ISPM#15 and exploring use of recyclable plastic pallets (e.g., IKEA’s OptiLedge); [see my blog re: plastic pallets, here]
  • Application of fouling-resistant paints to ship hulls;
  • Prompt adoption of international agreements addressing pathways (they cite the Ballast Water Management Treaty as entered into force only in 2017 — 13 years after adoption);
  • Ensuring ‘pest free status’ (per ISPM#10) before allowing export of goods—especially goods in the “Agriculture”, “Horticulture”, and “Ornamental” trades; and
  • Increasing training of interception staff at ports.

What InvaCost Data say re: Taxa of greatest concern to me

Two-thirds of reported expenditures are spent on terrestrial species (Cuthbert et al.). Insects as a Class constitute the highest number of species introduced as ‘Contaminants’ (n = 74) and ‘Stowaways’ (n = 43). They also impose the highest costs among species using these pathways. Forest insects and pathogens account for less than 1% of the records in the InvaCost database, but constitute 25% of total annual costs ($43.4 billion) (Williams et al., in prep.). Indeed, one of 10 species for which reported spending on post-invasion management is highest is the infamous Asian longhorned beetle (Tuberlin et al.)

ALB pupa in wood packaging; Pennsylvania Dept. of Natural Resources via Bugwood

Mammals and plants are often introduced deliberately – either as intentional releases or as escapes. Plant invasions are reported as numerous but impose lower costs.

Tuberlin et al. state that intentional releases and escapes should in theory be more straightforward to monitor and control, so less costly. They propose two theories: 1) Eradication campaigns are more likely to succeed for plants introduced for cultivation and subsequently escaped, than for plants introduced through unintentional pathways in semi-natural environments. 2) Species introduced unintentionally may be able to spread undetected for longer; they expect that better measures already exist to control invasions by deliberate introductions. I question both. Their theories ignore that constituencies probably like the introduced plants … and the near absence of attention to the possible need to control their spread. This is odd because elsewhere they recognize conflicts over whether to control or eradicate “charismatic” species.

Geographies of greatest concern to me

  • North America reported spending 54% of the total expenditure in InvaCost. Oceania spent 30%. The remaining regions each spent less than $5 billion. (Cuthbert et al.)
  • North America funded preventative actions most generously than other regions. Cuthbert suggests this was because David Pimentel published an early estimate of invasive species costs. I doubt it. The Lacey Act was adopted in 1905. USDA APHIS was formed in 1972 – based on predecessor agencies — because officials recognized the damage by non-native pests to agriculture. APHIS began addressing natural area pests with discovery of the Asian longhorned beetle in 1996. Of course, most of APHIS’ budget is still allocated to agricultural pests. I conclude that North America’s lead in this area has not resulted in adequate prevention programs.
Oregon ash swamp before attack by EAB (photo by Wyatt Williams, Oregon Dept. of Forestry)

Equity Issues

Tuberlin et al and Moodley et al. address equity issues of who causes introductions vs. who is impacted. This is long overdue.

  • More than 80% of bioinvasion management costs in protected areas fell on governmental services and/or official organizations (e.g. conservation agencies, forest services, or associations). With the partial exception of the agricultural sector, the economic sectors that contribute the most to movement of invasive species are spared from carrying the resulting costs (Moodley et al.)
  • A lack of willingness to invest might represent a moral problem when the invader’s impacts are incurred by regions, sectors, or generations other than those that on whom management action falls (Ahmed et al.)
  • People are perhaps more inclined to spend money to mitigate impacts that cause economic losses than those that damage ecosystems (Tuberlin et al.)

Data deficiencies

  • Only 41% of countries (83 out of 204) reported management costs; of those, only 24 reported costs specifically associated with pre-invasion (prevention) efforts (Cuthbert et al.).
  • Reliable economic cost estimates were available for only 60% of the “worst” invasive species (Cuthbert et al.)
  • Only 55 out of 266,561 protected areas reported losses or management costs (Moodley et al.).
  • Information on pathways of introduction was available for only three species out of 10,000 (Turbelin et al).
  • Taxonomic and geographic biases in reporting skew examples and possibly conclusions (Cuthbert et al.).

SOURCES

Ahmed, D.A., E.J. Hudgins, R.N. Cuthbert, .M. Kourantidou, C. Diagne, P.J. Haubrock, B. Leung, C. Liu, B. Leroy, S. Petrovskii, A. Beidas, F. Courchamp. 2022. Managing biological invasions: the cost of inaction. Biol Invasions (2022) 24:1927–1946 https://doi.org/10.1007/s10530-022-02755-0

Cuthbert, R.N., C. Diagne, E.J. Hudgins, A. Turbelin, D.A. Ahmed, C. Albert, T.W. Bodey, E. Briski, F. Essl, P. J. Haubrock, R.E. Gozlan, N. Kirichenko, M. Kourantidou, A.M. Kramer, F. Courchamp. 2022. Bioinvasion costs reveal insufficient proactive management worldwide. Science of The Total Environment Volume 819, 1 May 2022, 153404

Moodley, D., E. Angulo, R.N. Cuthbert, B. Leung, A. Turbelin, A. Novoa, M. Kourantidou, G. Heringer, P.J. Haubrock, D. Renault, M. Robuchon, J. Fantle-Lepczyk, F. Courchamp, C. Diagne. 2022. Surprisingly high economic costs of bioinvasions in protected areas. Biol Invasions. https://doi.org/10.1007/s10530-022-02732-7

Turbelin, A.J., C. Diagne, E.J. Hudgins, D. Moodley, M. Kourantidou, A. Novoa, P.J. Haubrock, C. Bernery, R.E. Gozlan, R.A. Francis, F. Courchamp. 2022. Introduction pathways of economically costly invasive alien species. Biol Invasions (2022) 24:2061–2079 https://doi.org/10.1007/s10530-022-02796-5

Williams, G.M., M.D. Ginzel, Z. Ma, D.C. Adams, F.T. Campbell, G.M. Lovett, M. Belén Pildain, K.F. Raffa, K.J.K. Gandhi, A. Santini, R.A. Sniezko, M.J. Wingfield, and P. Bonello 2022. The Global Forest Health Crisis: A Public Good Social Dilemma in Need of International Collective Action. Submitted

Posted by Faith Campbell

We welcome comments that supplement or correct factual information, suggest new approaches, or promote thoughtful consideration. We post comments that disagree with us — but not those we judge to be not civil or inflammatory.

For a detailed discussion of the policies and practices that have allowed these pests to enter and spread – and that do not promote effective restoration strategies – review the Fading Forests report at http://treeimprovement.utk.edu/FadingForests.htm

or
www.fadingforests.org

Search for Asian giant hornet

Asian giant hornet (Vespa mandarinia); photo by University of Florida Dept. of Entomology

Washington State’s “Giant Hornet – Hornet Herald” for June asks people to help with detecting this pest by monitoring paper wasp nests (hornets attack them). Hornet visits last 5 – 10 minutes while the hornet removes paper wasp larvae.  How to help:

  • Locate paper wasp nests that you have access to and can monitor through October. Then log the nest locations using the form here
  • Visit the nests each week, observe them, and then log your nest activity on a different form – here. Please monitor the nests for at least 5 minutes during the day once per week, but you can check the nests for as long and as often as you would like.

If you would like guidance on how to become a citizen-science monitor or trapper of Asian giant hornets – or presumably other bioinvaders – go here

Meanwhile, Washington State Department of Agriculture entomologists are in South Korea testing several hornet attractants and studying hornet foraging behavior. The goal  is to improve Washington’s trapping and tracking techniques.

Of course, 2022 is only half over, but so far neither Washington nor British Columbia has confirmed any detections.

Posted by Faith Campbell

We welcome comments that supplement or correct factual information, suggest new approaches, or promote thoughtful consideration. We post comments that disagree with us — but not those we judge to be not civil or inflammatory.

For a detailed discussion of the policies and practices that have allowed these pests to enter and spread – and that do not promote effective restoration strategies – review the Fading Forests report at http://treeimprovement.utk.edu/FadingForests.htm

or
www.fadingforests.org

Trees’ Value – High Although Major Benefits Not Addressed

loblolly pine – tree species showing highest value in this study; via Flickr

More scientists are examining the importance of American forests in providing ecosystem services – and the threat to those values raised by non-native pests and other factors. This is a broader perspective than used in the past – and it includes climate change.   also here  

Jeannine Cavender-Bareu and colleagues (full citation at the end of this blog) found that changes in the abundance and composition of US trees have the potential to undermine the benefits and societal values derived from those forests now. They examined threats associated with increasing invasive pests and pathogens, greater frequency of major fires, and climate change. Together, these constitute a complex set of global change drivers – and the impact of each is accelerating.

The authors tried to measure the impact of these forces on forests’ ability to provide five key ecosystem services. Two are “regulating” services—regulation of climate and air quality. The other three are “provisioning” services—production of wood products, food crops, and Christmas trees.

Unfortunately, they could not find sufficient data to analyze five other ecosystem services, which are equally or more important. They include both regulatory and provisioning services: water management, such as erosion control, flood and storm surge regulation; urban heat island regulation and energy savings; providing habitats for species (biodiversity); recreation; or ornamental, spiritual, and aesthetic values.

Cavender-Bareu and colleagues concluded that the value of the five analyzed services provided by 400 tree species across the contiguous United States over the years 2010-2012 is $114 billion per year. The non-market “regulatory” values far exceeds their current commercial value. 

  • Climate regulation via carbon storage in tree biomass provides 51% of this net annual value;
  • Human health improvements linked to trees’ filtering of air pollution provide an additional 37% of the annual net value.
  • Provisioning services, such as wood products, fruit and nut crops, and Christmas trees, provide only 12% of the net annual value. (By my calculation, wood products constituate almost three-quarters of this sum.)

The authors then tried to identify which tree lineages, e.g., taxonomic families, genera, or species, provide the greatest proportion of each of these ecosystem services. They also identified threats to these lineages. Together, this knowledge allows managers to target forestry management practices to the specific lineages within a landscape where ecosystem service are most at risk.

Table 1 in the article ranks 10 tree genera by the aggregate net value they provide: pine, oak, maple, Douglas-fir, hemlock, cherry/almond, spruce, hickories, yellow or tulip poplar, and ash. The table also provides separate dollar values for each of the five benefits.

Two lineages—pines and oaks — provide 42% of the value of these services (annually, pines = $25.4 billion; oaks = $22.3 billion). They note that these high values result from the large number of pine and oak species occupying diverse ecological niches. Oaks have the highest annual values for climate moderation or carbon storage ($10.7 billion) and air quality regulation ($11 billion). Oaks’ air quality regulation value reflects three factors: the genus’ abundance, the trees’ size, and the large numbers planted in cities and suburbs, that is, near human populations affected by pollution. Other than this issue of location, closely related tree species tend to have similar air quality regulation values.

Many lineages provide wood products, but the amounts vary widely among related species. Pines dominate annual net revenues from wood products at $7.4 billion, due in part to their high volume and higher than average price. The most valuable species in the context of this study’s set of ecosystem services are loblolly pine (Pinus taeda) and Douglas-fir (Pseudotsuga menziesii).

Edible fruits are concentrated in two lineages — family Rosaceae, especially genera Prunus and Malus; and family Rutaceae, genus Citrus. This category demonstrates the impact of disease: annual net returns from citrus products were actually negative during the 2010 – 2012 period due to abnormally low market prices and the prevalence of citrus greening disease in Florida, Arizona and California.

northern red oak – high value for timber & carbon sequestration; photo by dcrjsr via Wikimedia

Trees at Risk

As climate change progresses, the mix of tree species that provide critical ecosystem services will be altered—with unknown consequences. There could be increases in some services but also widely-expected losses in ecosystem benefits and human well-being.

An estimated 81% of tree species are projected to have at least 10% of their biomass exposed to climates outside their current climate envelope, impacting nearly 40% of total tree biomass in the contiguous U.S. An estimated 40% of species are projected to face increasing fire frequency. In both cases, individual species’ vulnerability depends more on where that species grows than on its genetic lineage. This analysis demonstrates a threatening interaction between these two disturbance agents: the species most valuable for carbon storage are also the most at risk from the increasing fire threat.

Known (established) pests threaten 16% of tree species and potentially affect up to 40% of total tree biomass. At greatest risk are the oak and pine genera (due to mountain pine beetle and oak wilt) plus most of the crop species. The authors cite chestnut blight and Dutch elm disease as examples of pests decimating once-dominant tree species — ones provided many services. In contrast to climate and fire risks, genetic relationships explain much of the risk of pest damage because most pests attack individual species, genera, or families.  (There are exceptions – sudden oak death and the Fusarium fungi vectored by invasive shot hole borers attack species across a wide range of families.)

Cavender-Bareu and colleagues conclude that major losses to pest attack of dominant species and lineages that currently provide high-value ecosystem services would undermine forest capacity to provide important benefits—at least for decades. They note that pest threats appear to be increasing partially as a consequence of climate change, demonstrating that multiple threats can interact and exacerbate outcomes. They say policy interventions aimed at slowing pests’ spread will probably be necessary to preserve the ecosystem service of climate and air quality regulation.

The high diversity of tree taxa in U.S. forests might buffer losses of ecosystem service if the most valuable lineages (oaks and pines) are compromised. However, other species will be needed to fill the voids their loss creates. Ensuring this possibility will require intentional management of forests and trees in the face of myriad and simultaneous threats.

The authors also show how tree-provided ecosystem services are distributed across the U.S. depending largely on the locations of forests, tree plantations, and orchards. Climate and air quality regulation occurs everywhere forests grow. Timber production is concentrated in a subset of the regions that also produce high climate regulation and air pollution removal, including the Southeast, Pacific Northwest, Northeast, and Upper Midwest.

The most valuable tree crops are grown on the coasts, often where forests do not grow—e.g., California; and in several Southwestern, Southern, and Eastern states.

Cavender-Bareu and colleagues found that climate change threatens species in all parts of the continent. Wildfires are expected to increase especially in California and the Intermountain West, which they say coincides with high annual storage of carbon. (This finding is opposite from those of Quirion et al. (2021) which pointed to the slow growth of pines in this region as reducing carbon storage potential.)

Cavender-Bareu and colleagues found that pest threats are highest in the Southwest and Southeast. These pests (native and non-native) are predicted to disproportionally affect species that generate high annual net values for climate regulation, air quality regulation, and wood products – e.g., pines and oaks. As noted above, these values are driven by their abundance. They note that mountain pine beetle and oak wilt have not yet reached areas with high wood product production in Northeast and Southeast.

Other studies (see Aukema et al. 2010) and here & here show that the greatest threats from non-native pests are to the Northeast/Midwest, and the Pacific coast – and Hawai`i & here.

Rock Creek Park, Washington, D.C. – an urban forest! photo by Bonnachaven

Cavender-Bareu and colleagues’ analysis advances our understanding of the threat several change drivers pose to benefits Americans receive from our forests. However, we must remember that some of the most important ecosystem services were not included because of insufficient data. Missing services:

1) most urban ecosystems. Inclusion of urban trees in the analysis would significantly increase the value of avoided health damage due to tree-based removal of air pollution. Urban trees also help regulate climate change (Nowak et al. estimate 643 M Mg of carbon are stored in urban areas, at a value of $2.31 billion annually).

2) many other regulating ecosystem services, such as erosion control, flood regulation, storm surge regulation, urban heat island regulation, energy savings due to shade, and species habitat / biodiversity.

3) recreation, ornamental, spiritual, and aesthetic values.

A complete accounting would also require estimates of the damage trees cause and the cost of their maintenance. For example, the full cost of irrigating almond trees; allergies and irritations due to tree pollen and sap; injuries to people and property caused by falling trees and limbs; trees’ role in spreading fires; trees’ contribution to volatile organic compounds (a pollutant).

The estimated annual values of the climate and air quality regulation have large uncertainty. These arise from uncertainty re: the social cost of carbon, the value of a statistical life, and uncertainty in the air pollution dose–mortality response function. The estimated annual values of the provisioning services are more precise because they are calculated from the market price for the per unit value of tree crops, wood products, and Christmas trees, as well as reliable data on production volume.

SOURCES

Aukema, J.E., D.G. McCullough, B. Von Holle, A.M. Liebhold, K. Britton, & S.J. Frankel. 2010. Historical Accumulation of Nonindigenous Forest Pests in the Continental United States. Bioscience. December 2010 / Vol. 60 No. 11

Cavender-Bareu, J.M., E. Nelson, J.E. Meireles, J.R. Lasky, D.A. Miteva, D.J.Nowak, W.D. Pearse, M.R. Helmus, A.E. Zanne, W.F. Fagan, C. Mihiar, N.Z. Muller, N.J.B. Kraft, S. Polasky. 2022. The hidden value of trees — Quantifying the ecosystem services of tree lineages and their major threats across the contiguous. PLOS Sustainability and Transformation April 5, 2022.  

Quirion BR, Domke GM, Walters BF, Lovett GM, Fargione JE, Greenwood L, Serbesoff-King K, Randall JM & Fei S (2021) Insect and Disease Disturbances Correlate With Reduced Carbon Sequestration in Forests of the Contiguous United States. Front. For. Glob. Change 4:716582.  Volume 4 Article 716582  doi: 10.3389/ffgc.2021.716582

Help Ensure Best Pest-Countering Programs Possible!

This blog asks YOU!!! to support funding for key USDA programs. Each is essential for protecting the resilience of the Nation’s forests in the face of invasive pests. Please help by contacting your members of the House and Senate Appropriations Committees. I provide a list of members – by state – at the end of this blog.

While the two key federal programs overlap, they are separately managed: USDA’s Animal and Plant Health Inspection Service (APHIS) and USDA’s Forest Service (USFS). These two agencies are funded by different subcommittees of the House and Senate’s Appropriations committees. APHIS is funded by the Subcommittees on Agriculture and Related Agencies. USFS is funded by the Subcommittees on Interior.

Your letter or email need be no more than a couple paragraphs. To make the case for greater funding, feel free to pick-and-choose from the information that follows. Your greatest impact comes from speaking specifically about what you know and where you live.

These are the specific dollar things we’d like you to ask for. The rationale for each is below.

Appropriations for APHIS programs (in $millions)

ProgramFY 2021FY 2022  CRFY 2023 Pres’ requestPlease ask
Tree & Wood Pest$60.456$61.217$63 $70
Specialty Crops$196.553$209.553$219 $219
Pest Detection$27.733$28.218$29 $30
Methods Development$20.844$21.217$22 $23

Appropriations for USFS programs (in $millions)

ProgramFY 2021FY 2022  CRFY 2023 Pres’ requestPlease ask
Forest Health Protection Coop Lands$30.747 $30.747 $36,747$51
FHP Federal Lands $15.485 $15.485 $22.485 $32
Research & Development$258.760 $258.760 $317.773 $317.733
    % for forest invaders~1%??0$16 M

Background on the Threat

I’m sure you are familiar with the many ecosystem services provided by America’s forests and woodlands – wildland, rural, and urban. (Besides – maybe you just love trees!) I assume you also know that these forests are under threat from a growing number of non-native insects and pathogens.

For a quick review, see earlier blogs re: 1) an estimate that 41% of forest biomass in the “lower 48” states is at risk to mortality caused by the most damaging 15 species; black ash swamps of the upper Midwest; unique forest ecosystems of Hawai`i; riparian forests in the far West; stream canyons of the Appalachian range and; high-elevation forests of the West; and unique forests of Southwest Oregon.  Also, see the thorough discussion of these pests’ impacts in Invasive Species in Forests and Grasslands of the United States: A Comprehensive Science Synthesis for the United States Forest Sector – blog; link available here]

Meanwhile, newly-discovered pests continue to appear and require research and management. The most troubling current example is beech leaf disease. It’s killing beech trees from Ohio to Maine and south to Virginia.

These introduced pests usually first appear in cities or suburbs because they arrive on imported goods shipped to population centers. The immediate result is enormous damage to urban forests. A recently published article (“Hotspots of pest-induced US urban tree death, 2020–2050”), projects that, by 2050, 1.4 million street trees in urban areas and communities will be killed by introduced insect pests. Removing and replacing these trees is projected to cost cities $30 million per year. Additional urban trees – in parks, other plantings, on homeowners’ properties, and in urban woodlands – are also expected to die.

As we know, newly-arrived pests don’t stay in those cities. Some spread on their own. Others are carried far and wide on firewood, plants, patio furniture, even storage pods. And so they proliferate in rural and wildland forests, including US National Forests.

As we know too well, many pests—especially the highly damaging wood-borers—arrive in inadequately treated crates, pallets, and other forms of packaging made of wood. Other pests—e.g., spotted lanternfly —take shelter, or lay their eggs, in or on virtually any exposed hard surface, such as steel or decorative stone.

Imports from Asia have historically transported the most damaging pests. Unfortunately, imports from Asia have reached unprecedented volume – currently they’re running at a rate of 20 million shipping containers per year. Research findings lead to an estimate that at least 7,500 of these containers are carrying a tree-killing pest. The “Hotspots” authors found that if a new woodborer that attacks maples or oaks is introduced, it could kill 6.1 million trees and cost American cities $4.9 billion over 30 years. The risk would be highest if this pest were introduced to the South – and southern ports are receiving more direct shipments from Asia!  

Some types of pests—especially plant diseases and sap sucking insects —come on imported plants. A principle example is sudden oak death (SOD; and which attacks more than 100 species of trees and shrubs). Other examples are the rapid ʻōhiʻa death pathogen that threatens Hawai`i’s most widespread tree, ʻōhiʻa lehua; and beech leaf disease, a newly discovered threat that is killing beech trees in a band stretching from Ohio to Maine.

Background on Specific USDA Funding Requests

APHIS

To reduce the risk of new pest introductions and strengthen response to many important pests, please ask your member of Congress and Senators to support appropriations that support key APHIS programs in the table above. (I assume you know that APHIS is responsible for preventing introduction and spread of invasive pests. While most port inspections are carried out by the Department of Homeland Security’s Bureau of Customs and Border Protection, APHIS sets the policy guidance. APHIS also inspects imports of living plants.)

Thank your member for the incremental increases in funding for these programs in FY22 but suggest that a more substantial investment is warranted.  

The Tree and Wood Pests account supports eradication and control efforts targeting principally the Asian longhorned beetle (ALB) and spongy (formerly gypsy) moth. Eradicating the ALB normally receives about two-thirds of the funds. The programs in Massachusetts, New York, Ohio, and South Carolina must continue until eradication succeeds.

The Tree and Wood Pests account formerly also funded APHIS’ emerald ash borer (EAB) regulatory program. APHIS terminated this program in January 2021. The probable result is that EAB will spread more rapidly to the mountain and Pacific Coast states. Indeed, the “Hotspots” article identified Seattle and Takoma as likely to lose thousands of ash trees in coming decades. This result shows what happens when APHIS programs are inadequately funded.

Re: the plant diseases and sap sucking insects that enter the country on imported plants, APHIS’ management is through its Specialty Crops program. Repeatedly, SOD-infected plants and have been shipped from nurseries in the Pacific Coast states to vulnerable states across the East and South. Clearly this program needs re-assessment and – perhaps – additional funding.

The Specialty Crops program also is home to APHIS’ efforts to counter the spotted lanternfly, which has spread from Pennsylvania to Maryland, Delaware, New Jersey, Virginia, West Virginia, Ohio, even Indiana. This pest threatens both native trees and agricultural crops – including hops, grapes, apples, and more. California has adopted a state quarantine in hopes of preventing its introduction to that state. Still, APHIS has not established a quarantine.

Please ask the Congress to support the Administration’s request for $219 million for the Specialty Crops program. However, urge them to adopt report language to ensure that APHIS allots adequate funding under this budget line to management of both sudden oak death and spotted lanternfly.

Two additional APHIS programs are the foundation for effective pest prevention. First, the Pest Detection program is key to the prompt detection of newly introduced pests that is critical to successful pest eradication or containment. Please ask the Congress to fund Pest Detection at $30 million. Second, the “Methods Development” program enables APHIS to improve development of essential detection and eradication tools. Please ask the Congress to fund Methods Development at $23 million.

Please ask your member of Congress to support the Administration’s request for a $50.794 million fund for management of emergencies threatening America’s agricultural and natural resources. This program includes a $6 million increase for work with the Climate Conservation Corps specifically targetting invasive species. Although the details are not yet clear, the program’s focus will be to improve surveillance and mitigation methods.

US Forest Service

The USFS has two programs critical to managing non-native tree-killing pests – Forest Health Management (or Protection; FHP) and Research and Development (R&D). FHP provides technical and financial assistance to USFS units (e.g., National forests and regions), other federal agencies, states, municipalities, and other partners to detect and manage introduced pests – including several that APHIS regulates and dozens that it does not. R&D funds efforts to understand non-native insects, diseases, and plants – which are usually scientific mysteries when they first are detected. Of course, this knowledge is crucial to effective programs to prevent, suppress, and eradicate the bioinvader. See the table at the beginning of the blog for specific funding requests for each program.

The Forest Health Management Program (FHP) has two funding streams: Federal Lands and Cooperative Lands (all forests under non-federal management, e.g., state and private forests, urban forests). Both subprograms must be funded in order to ensure continuity of protection efforts – which is the only way they can be effective. Some members of Congress prefer to focus federal funding on National forests. However, allowing pests to proliferate until they reach a federal forest border will only expose those forests to exacerbated threats. Examples of tree-killing pests that have spread from urban areas to National forests include the hemlock woolly adelgid, emerald ash borer, polyphagous and Kuroshio shot hole borers, sudden oak death, and laurel wilt disease. [All profiled here]

Adequate funding for FHP is vital to realizing the Administration’s goals of ensuring healthy forests and functional landscapes; supporting rural economies and underserved communities; enhancing climate change adaptation and resilience; and protecting biological diversity.

Please ask your Member of Congress and Senators to provide $51 million for work on non-federal cooperative lands. This level would partially restore capacity lost over the last decade. Since Fiscal Year (FY) 2010, spending to combat 11 specified non-native insects and pathogens fell by about 50%. Meanwhile, the pests have spread. Also, please ask your Member and Senators to support a $32 million appropriation for the Federal Lands subprogram for FY23 which is allocated to pests threatening our National forests directly.

A vital component of the FHP program is its leadership on breeding pest-resistant trees to restore forests decimated by pests. FHP’s Dorena Genetic Resource Center, in Oregon, has developed Port-Orford cedar seedlings resistant to the fatal root-rot disease. and blog. These seedlings are now being planted by National forests, the Bureau of Land Management, and others. In addition, pines with some resistance to white pine blister rust are also under development. The Dorena Center offers expert advice to various partners  engaged in resistance-breeding for Oregon’s ash trees and two tree species in Hawai`i, koa and ʻōhiʻa. and blog.

The USFS research program is well funded at $317 million. Unfortunately, only a tiny percentage of this research budget has been allocated to improving managers’ understanding of specific invasive species and, more generally, of the factors contributing to bioinvasions. Funding for research conducted by USFS Research stations on ten non-native pests decreased from $10 million in Fiscal Year 2010 to just $2.5 million in Fiscal Year 2020 – less than 1% of the total research budget. This cut of more than 70% has crippled the USFS’ ability to develop effective tools to manage the growing number of pests.

To ensure the future health of America’s forests, please ask your Member of Congress and Senators to request the Subcommittee to include in its report instructions that USFS increase the funding for this vital research area to 5% of the total research budget. The $16 million would fund research necessary to improving managers’ understanding of invasive forest insects’ and pathogens’ invasion pathways and impacts, as well as to developing effective management strategies. Addressing these threats is vital to supporting the Administration’s priorities of increasing adaptation and resilience to climate change and implementing nature-based solutions.

The USFS Research and Development program should expand its contribution to efforts to breed trees resistant to non-native pests; programs deserving additional funding include hemlocks resistant to hemlock woolly adelgid; ashes resistant to emerald ash borer; beech resistant to both beech bark disease and beech leaf disease; link to DMF and elms resistant to Dutch elm disease. The Research program also continues studies to understand the epidemiology of laurel wilt disease, which has spread to sassafras trees in Kentucky and Virginia.

Members of House Appropriations Committee

STATEMEMBERAPHIS APPROPUSFS APPROP
ALRobert AderholtX 
CalifBarbara Lee
David Valadao
Josh Harder
X
X  
   

X
FLDebbie Wasserman       ScultzX   
GASanford BishopX 
IDMike Simpson X
ILLauren UnderwoodX 
MDAndy HarrisX 
MEChellie PingreeXX
MIJohn MoolenaarX 
MNBetty McCollumXX
NVSusie Lee
Mark Amodei
 X
X
NYGrace MengX 
OHMarcy Kaptur
David Joyce
 X
X
PAMatt Cartwright X
TXHenry CuellarX 
UTChris Stewart X
WADan Newhouse
Derek Kilmer
X
X
WIMark PocanX 

Members of Senate Appropriations Committee

STATEMEMBERAPHIS APPROPUSFS APPROP
AKLisa Murkowski X
CalifDiane FeinsteinXX
FLMarco Rubio X
HIBrian SchatzX 
INMike BraunX 
KSJerry MoranX 
KYMitch McConnellXX
MDChris Van Hollen X
MESusan CollinsX 
MSCindy Hyde-SmithXX
MORoy BluntXX
MTJon TesterXX
NDJohn HoevenX 
NMMartin HeinrichXX
ORJeff MerkleyXX
RIJack Reed X
TNBill Hagerty X
VTPatrick LeahyXX
WVShelly Moore Capito X
WITammy BaldwinX 

Posted by Faith Campbell

We welcome comments that supplement or correct factual information, suggest new approaches, or promote thoughtful consideration. We post comments that disagree with us — but not those we judge to be not civil or inflammatory.

For a detailed discussion of the policies and practices that have allowed these pests to enter and spread – and that do not promote effective restoration strategies – review the Fading Forests report at http://treeimprovement.utk.edu/FadingForests.htm

Two Teams with a New Take: Insect Losses Due to Invasive Plants

monarch butterfly on swamp milkweed; photo by Jim Hudgins, USFWS

I have been impressed recently by two groups of scientists who are trying to broaden understanding of the impacts of invasive plants by examining the interactions of those plants with insects. As they note, herbivorous insects are key players in terrestrial food webs; they transfer energy captured by plants through photosynthesis to other trophic levels. This importance has been recognized since Elton first established the basic premises of food webs (1927) [Burghardt et al.; full citation at end of blog] Arthropods comprise significant members of nearly every trophic level and are especially important as pollinators. If introduced plants cause changes to herbivore communities, there will probably be effects on predators, parasites, and other wildlife through multitrophic interactions [Lalk et al.; Tallamy, Narango and Mitchell].

[I briefly summarize the findings of a third group of scientists at the end of this blog. The third group looks at the interaction between agriculture – that is, planting of non-native plants! – and climate change.]

One approach to studying this issue, taken by Douglas Tallamy of the University of Delaware and colleagues, is to look at the response of herbivorous insects to NIS woody plants fairly generally. They integrate their studies with growing concern about the global decline in insect populations and diversity. They note that scientists have focused on light pollution, development, industrial agriculture, and pesticides as causes of these declines. They decry the lack of attention to disruption of specialized evolutionary relationships between insect herbivores and their native host plants due to widespread domination by non-indigenous plants [Richard, Tallamy and Mitchell].

In their studies, Tallamy and colleagues consider not just invasive plants, but also non-native plants deliberately planted as crops or ornamentals, or in forestry. They point out that such introduced plants have completely transformed the composition of plant communities in both natural and human-dominated ecosystems around the globe. At least 25% of the world’s planted forests are composed of tree species not native to their locale. At least one-sixth of the globe is highly vulnerable to plant invasions, including biodiversity hotspots [Richard, Tallamy and Mitchell].

A different approach, taken by Lalk and colleagues, is more closely linked to concern about impacts of the plants themselves. They have chosen to pursue knowledge about relationships between individual species of invasive woody plants and the full range of arthropod feeding guilds – pollinators, herbivores, twig and stem borers, leaf litter and soil organisms. In so doing, they decry the general absence of data.

Both teams agree that:

  • Invasive plants are altering ecosystems across broad swaths of North America and the impacts are insufficiently understood.
  • The invasive plant problem will get worse because non-native species continue to be imported and planted. (Reminder: the Tallamy team considers impacts of deliberate planting as well as bioinvasion.)
  • Plant-insect interactions are the foundation of food webs, so changes to them will have repercussions throughout ecosystems.

Tallamy team

Non-native plants have replaced native plant communities to a greater or lesser extent in every North American biome – including anthropogenic landscapes [Burghardt]. The first trophic level in suburban and urban ecosystems throughout the U.S. is dominated by plant species that evolved in Southeast Asia, Europe, and South America [Tallamy and Shropshire]. Abundant non-native plants not only dominate plant biomass; they also reduce native plant taxonomic, functional and phylogenetic diversity and heterogeneity. Thus, they indirectly alter the abundance of native insects  [Burghardt; Richard, Tallamy and Mitchell].

I think these articles might actually underestimate the extent of these impacts. While Richard, Tallamy and Mitchell report that more than 3,300 species of non-native plants are established in continental U.S., years ago Rod Randall said that more than 9,700 non-native plant species were naturalized in the U.S. (probably includes Hawai` i.   The Tallamy team cites USDA Forest Service data showing 9% of forests in the southeast are invaded by just 33 common invasive plant species [Richard, Tallamy and Mitchell], I have cited that and other sources showing even greater extents of plant invasion in the east and here; other regions and here

The Tallamy team has conducted several field experiments that demonstrate that the presence of non-native plants suppress numbers and diversity of native lepidopteran caterpillars. These non-native woody plants have not replaced the ecological functions of the native plants that used to support insect populations. This is true whether or not the non-native plants are deliberately planted or are invading various ecosystems on their own. [Richard, Tallamy and Mitchell]. (Of course, they expect plant invasions to grow; they note that some of the many ornamental species that are not yet invasive will become so.)

The result is disruption of the ecological services delivered by native plant communities, including the focus of their studies: plants’ most fundamental contribution to ecosystem function: generation of food for other organisms [Burghardt].

They note that plants’ relationship to insects differs depending on the insects’ feeding guilds — folivores, wood eaters, detritivores, pollinators, frugivores, and seed-eaters; and among herbivores with different mouthparts — chewing or sucking; and as host plant specialists or generalists. They decry studies that fail to recognize these differences [Tallamy, Narango, and Mitchell].

The Tallamy team explores why insect populations decline among non-native plants. That is,  

1) Do insects directly requiring plant resources have lower fitness when using non-native plants; do they not recognize them as viable host plants; or do they avoid them altogether? 

2) Are reductions in numbers of specialist herbivores mitigated by generalists? A decade of research shows that both specialists and generalists decline.

The team’s studies focus on lepidopteran larvae (caterpillars). Insect herbivores are both the largest taxon of primary consumers and extremely important in transferring energy captured by plants through photosynthesis to other trophic levels [Burghardt]. In addition, insects with chewing mouthparts are typically more susceptible to defensive secondary metabolites contained in leaves than are insects with sucking mouthparts that tap into poorly defended xylem or phloem fluids [Tallamy, Narango and Mitchell].
A study by Burghardt et al. found that 75% of all lepidopteran species and 93% of specialist species were found exclusively on native plant species. Non-native plants that were in the same genus as a native plant often supports a lepidopteran community that is a similar but depauperate subset of the community found on its native congener. In fact, the insect abundance and species richness supported by non-native congeners of native species was reduced by 68%.

A meta-analysis of 76 studies by other scientists found that, with few exceptions, caterpillars had higher survival and were larger when reared on native host plants. Plant communities invaded by non-native species had significantly fewer Lepidoptera and less species richness. In three of eight cases examined, non-native plants functioned as ecological traps, inducing females to lay eggs on plants that did not support successful larval development. Richard, Tallamy and Mitchell cite as an example the target of many conservation efforts, monarch butterflies (Danaus plexxipus), which fail to reproduce when they use nonnative swallowworts (Vincetoxicum species.) instead of related milkweeds (Asclepias species.).

Tallamy and Shropshire ranked 1,385 plant genera that occur in the mid-Atlantic region by their ability to support lepidopteran species richness. They found that introduced ornamentals are not the ecological equivalents of native ornamentals. This means that solar energy harnessed by introduced plants is largely unavailable to native specialist insect herbivores.

Tallamy, Narango, and Mitchell describe the following patterns:

1) Insects with chewing mouthparts are typically more susceptible to defensive secondary metabolites contained in leaves than are insects with sucking mouthparts that tap into poorly defended xylem or phloem fluids. As a result, sucking insects find novel non-indigenous plants to be acceptable hosts more often. However, there are more than 4.5 times as many chewing (mandibulate) insect herbivores than sucking (haustellate) species. It follows that the largest guild of insect herbivores is also the most vulnerable to non-native plants as well as being the most valuable to insectivores.
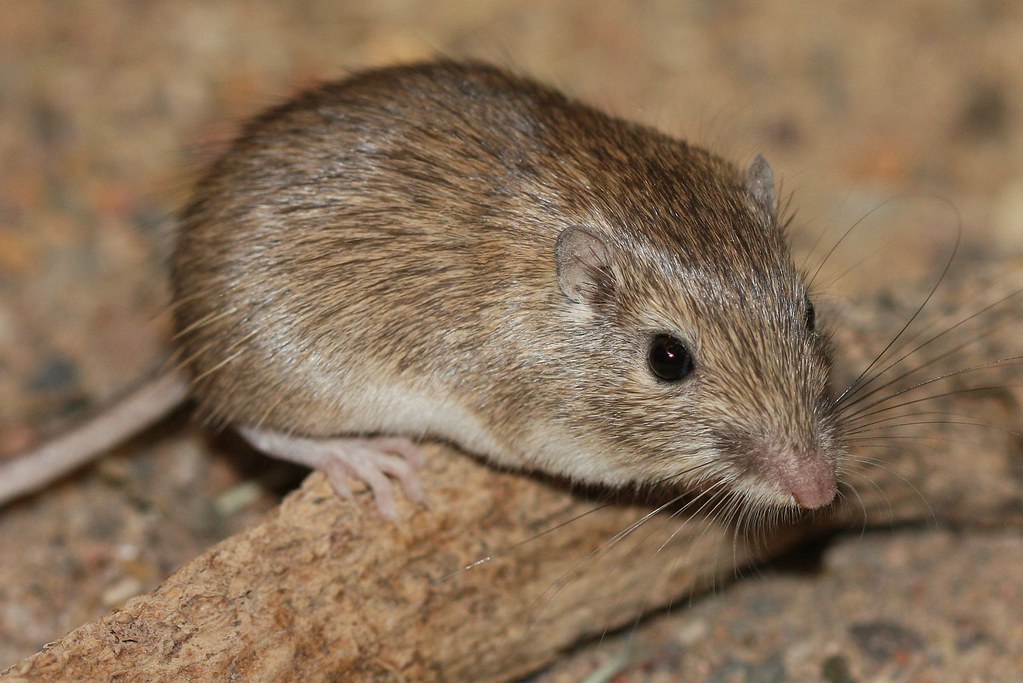
native azalea Rhododendron periclymenoides; photo by F.T. Campbell

2) Woody native species, on average, support more species of phytophagous insects than herbaceous species.

3) Although insects are more likely to accept non-native congeners or con-familial species as novel hosts, non-native congeners still reduced insect abundance and species richness by 68%.
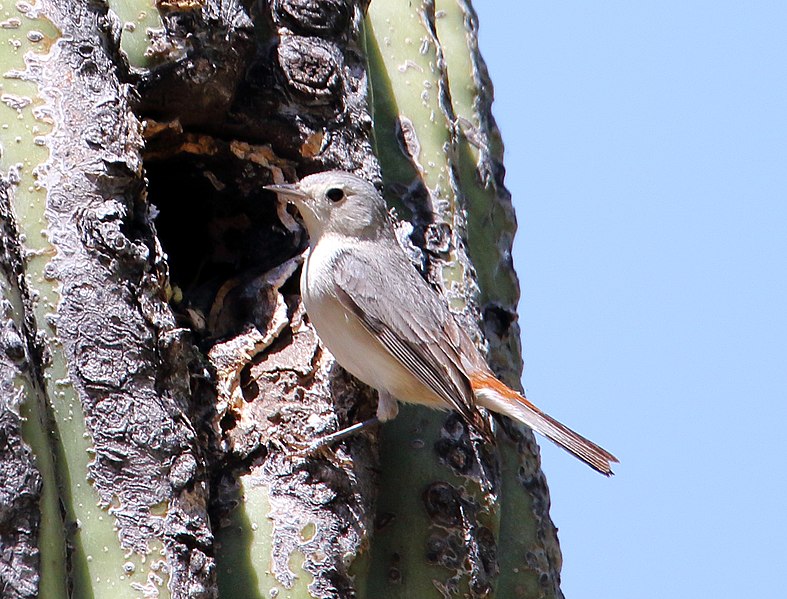
4) Host plant specialists are less likely to develop on evolutionarily novel non-indigenous plants than are insects with a broader diet. There are far more specialist species than generalists, so generalists will not prevent serious declines in species richness and abundance when native plants are replaced by non-indigenous plants. In addition, non-native plants cause significant reductions in species richness and abundance even of generalists. In fact, generalists are often locally specialized on particular plant lineages and thus may function more like specialists than expected.

5) Any reduction in the abundance and diversity of insect herbivores will probably cause a concomitant reduction in the insect predators and parasitoids of those herbivores – although few studies have attempted to measure this impact beyond spiders, which are abundant generalists. The vast majority of parasitoids are highly specialized on particular host lineages.

6) Studies comparing native to non-native plants must avoid using native species that support very few phytophagous insects as their baseline, e.g., in the mid-Atlantic region tulip poplar trees (Liriodendron tulipifera) and Yellowwood (Cladrastus kentuckea).

7) Insects that feed on well-defended living tissues such as leaves, buds, and seeds are less likely to be able to include non-native plants in their diets than are insects that develop on undefended tissues like wood, fruits, and nectar. Although this hypothesis has never been formally tested, they note the ease with which introduced wood borers – emerald ash borer, Asian longhorned beetle, polyphagous and Kuroshio shot-hole borers, redbay ambrosia beetle, Sirex woodwasp (all described in profiles posted here — have become established in the US.

palamedes swallowtail Papilio palamedes; photo by Vincent P. Lucas; this butterfly depends on redbay, a tree decimated by laurel wilt disease vectored by the redbay ambrosia beetle

Lalk and Colleagues

As noted, Lalk and colleagues have a different frame; they focus on individual introduced plant species rather than starting from insects. They also limit their study to invasive plants. The authors say there is considerable knowledge about interactions between invasive herbaceous plants and arthropod communities, but less re: complex interactions between invasive woody plants and arthropod communities, including mutualists (e.g., pollinators), herbivores, twig- and stem-borers, leaf-litter and soil-dwelling arthropods, and other arthropod groups.

They ask why this knowledge gap persists when invasive shrubs and trees are so widespread and causing considerable ecological damage. They suggest the answer is that woody invaders rarely encroach on high-value agricultural systems and some are perceived as contributing ecosystem services, including supporting some pollinators and wildlife.

Lalk and colleagues seek to jump-start additional research by summarizing what is currently known about invasive woody plants’ interactions with insects. They found sufficient data about 11 species – although even these data are minimal. They note that all have been cultivated and sold in the U.S. for more than 100 years. All but one (mimosa) are listed as a noxious weed by at least one state; two states (Rhode Island and Georgia) don’t have a noxious weed list. None of the 11 is listed under the federal noxious weed statute.

Ailanthus altissima

Illustrations of how minimal the existing information is:

  • Tree-of-heaven (Ailanthus altissima) is noted to be supporting expanded populations of the Ailanthus webworm moth (Atteva aurea), which is native to Central America; and to be the principal reproductive host for SLF (Lycorma delicatua)  https://www.dontmovefirewood.org/pest_pathogen/spotted-lanternfly-html/
  • Chinese tallow (Triadica sebifera) is thought to benefit both native generalist bee species and non-indigenous European honeybees (Apis mellifera).
  • Chinese privet (Ligustrum sinense) appears to suppress populations of butterflies, bees, and beetles.

Lalk and colleagues then review what is known about interactions between individual invasive plant species in various feeding guilds. They point out that existing data on these relationships are scarce and sometimes contradictory.

They believe this is because interactions vary depending on phylogenetic relationships, trophic guild, and behavior (e.g., specialized v. generalist pollinator). Arthropods can be “passengers” of a plant invasion. That is, they can be affected by that invasion, with follow-on effects to other arthropods in the community. Also, arthropods can be “drivers” of invasion, increasing the success of the invasive plants.

They then summarize the available information on various interactions. For example, they note that introduced plants can compete with native plants in attracting pollinators, causing cascading effects. Or they can increase pollination services to native plants by attracting additional pollinators.

They note that herbivore pressure on invasive plants can have important impacts on growth, spread, and placement within food webs. They note that these cases support the “enemy release hypothesis”, although they think there are probably additional driving mechanisms.

Lalk and colleagues note that most native twig- and stem-borers (Coleoptera: Buprestidae, Curculionidae, Cerambycidae; Hymenoptera: Siricidae) are not considered primary pests but that some of our most damaging insect species are wood borers (see above).

Some of these borers are decomposers; in that role, they are critical in nutrient cycling.

Arthropods in leaf litter and soil also serve important roles in the decomposition and cycling of nutrients, which affects soil biota, pH, soil nutrients, and soil moisture. They act as a trophic base in many ecosystems. Lalk and colleagues suggest these arthropod communities probably change with plant species due to differences in leaf phytochemistry. They cite one study that found litter community composition differed significantly between litter beneath tree-of-heaven, honeysuckle (Lonicera maackii), and buckthorn (Rhamnus cathartica) compared to litter underneath surrounding native trees.

Recommendations

Both the Tallamy and Lalk teams call for ending widespread planting of non-native plants. Lalk and colleagues discuss briefly the roles of

  • The nursery industry (including retailers); they produce what sells.
  • Scientists and educators have not sufficiently informed home and land owners about which species are invasive or about native alternatives.
  • Private citizens buy and plant what their neighbors have, what they consider aesthetically pleasing, or what is being promoted.
  • States have not prohibited sale of most invasive woody plants. Regulatory actions are not a straightforward matter; they require considerable time, supporting information, and compromise.

Tallamy team calls for restoration ecologists in the eastern U.S. to consider the number of Lepidopterans hosted by a plant species when deciding what to plant. For example, oaks (Quercus), willows (Salix), native cherries (Prunus)and birches (Betula) host orders of magnitude more lepidopteran species in the mid-Atlantic region than tulip poplar.(Those lepidopteran in turn support breeding birds and other insectivorous organisms.) [Tallamy & Shropshire]

Lalk and colleagues focused on identifying several key knowledge gaps:

  • How invasive woody plants affect biodiversity and ecosystem functioning
  • How they themselves function in different habitats.
  • Do non-native plants drive shifts in insect community composition, and if so, what is that shift, and how does it affect other trophic levels?
  • How do IAS woody plants affect pollinators?

The authors do not minimize the difficulty of separating such possible plant impacts from other factors, including climate change and urbanization.

Global Perspective

oil palm plantation in Malaysia; © CEphoto, Uwe Aranas

Outhwaite et al. (full citation at end of this blog) note that past studies have shown that insect biodiversity changes are driven primarily by land-use change (which is another way of saying planting of non-native species – as Dr. Tallamy and colleagues describe it) and increasingly by climate change. They south to examine whether these drivers interact. They found that the combination of climate warming and intensive agriculture is associated with reductions of almost 50% in the abundance and 27% in the number of species within insect assemblages relative to levels in less-disturbed habitats with lower rates of historical climate warming. These patterns were particularly clear in the tropics (perhaps partially because of the longer history of intensive agriculture in temperate zones). They found that high availability of nearby natural habitat (that is, native plants) can mitigate these reductions — but only in low-intensity agricultural systems.

Outhwaite et al. reiterate the importance of insect species in ecosystem functioning, citing pollination, pest control, soil quality regulation & decomposition. To prevent loss of these important ecosystem services, they call for strong efforts to mitigate climate change and implementation of land-management strategies that increase the availability of natural habitats.

SOURCES

Burghardt, K. T., D. W. Tallamy, C. Philips, and K. J. Shropshire. 2010. Non-native plants reduce abundance, richness, and host specialization in lepidopteran communities. Ecosphere 1(5):art11. doi:10.1890/ES10-00032.

Lalk, S. J. Hartshorn, and D.R. Coyle. 2021. IAS Woody Plants and Their Effects on Arthropods in the US: Challenges and Opportunities. Annals of the Entomological Society of America, 114(2), 2021, 192–205 doi: 10.1093/aesa/saaa054

Outhwaite, C.L., P. McCann, and T. Newbold. 2022.  Agriculture and climate change are shaping insect biodiversity worldwide. Nature 605 97-192 (2022)  https://www.nature.com/articles/s41586-022-04644-x

Richard, M. D.W. Tallamy and A.B. Mitchell. 2019. Introduced plants reduce species interactions. Biol Invasions

Tallamy, D.W., D.L. Narango and A.B. Mitchell. 2020. Ecological Entomology (2020), DOI: 10.1111/een.12973 Do Non-native plants contribute to insect declines?

Tallamy, D.W. and K.J. Shropshire. 2009. Ranking Lepidopteran Use of Native Versus Introduced Plants Conservation Biology, Volume 23, No. 4, 941–947 2009 Society for Conservation Biology DOI: 10.1111/j.1523-1739.2009.01202.x

Posted by Faith Campbell

We welcome comments that supplement or correct factual information, suggest new approaches, or promote thoughtful consideration. We post comments that disagree with us — but not those we judge to be not civil or inflammatory.

For a detailed discussion of the policies and practices that have allowed these pests to enter and spread – and that do not promote effective restoration strategies – review the Fading Forests report at http://treeimprovement.utk.edu/FadingForests.htm

SOD – Frightening Genetics

tanoak killed by SOD; photo by Joseph O’Brien, via Bugwood

I am belatedly catching up with developments regarding sudden oak death (SOD; Phytophthora ramorum). The situation is worsening, with three of the four existing strains now established in U.S. forests. Nursery outbreaks remain disturbingly frequent.

This information comes primarily from the California Oak Mortality Task Force’s (COMTF) newsletters posted since October; dates of specific newsletters are shown in brackets.

Alarming presence of variants & hybridization

The long-feared risk of hybridization among strains has occurred. Canadian authorities carrying out inspections of a British Columbia nursery found a hybrid of European (EU1) and North American (NA2) clonal lineages. These hybrids are viable, can infect plants and produce spores for not only long-term survival but also propagation. So far the hybrid has been found in a single nursery; it has not spread to natural forests. The pathogen is considered eradicated in that nursery, so it is hoped it cannot reproduce further. [December 2021 newsletter, summarizing research by R. Hamelin et al.]

Noted British forest pathologist Clive Brasier warned in 2008 about the risk of hybrids evolving in nurseries which harbor multiple strains of related pathogens. (See full citation at end of the blog.)

The threat is clear: three of the four known variants are already established in forests of the Pacific Northwest – NA1, NA2, and EU1. (For an explanation of P. ramorum strains and mating types, go here.)

In Oregon, the EU1 strain was detected in a dying tanoak (Notholithocarpus densiflorus) tree in the forests of Curry County in 2015. Genetic analysis revealed that the forest EU1 isolates were nearly identical to EU1 isolates collected in 2012 from a nearby nursery during routine monitoring. This detection was considered to be evidence that multiple distinct P. ramorum introductions had occurred. The scientists expressed concern that the presence of this strain – which is of the A1 mating type while the widely established NA1 population of the pathogen in the forest is of the A2 mating type — makes the potential for sexual recombination more likely. Therefore, the state prioritized eradication of the EU1 forest infestation [Grünwald et al. 2016]. (For an explanation of P. ramorum strains and mating types, go here.)

The NA2 strain was detected in 2021, 33 km north of the closest known P. ramorum infestation. Because Oregonians genotype all detections on the leading front of the infection, they completed Koch’s postulates and found this surprising result [February 2022]. NA2 is thought to be more aggressive than the NA1 lineage [February 2022]. Surveys and sampling quickly determined that the outbreak is well established — 154 positive detections [February 2022] across more than 500 acres [October 2021]. Oregon Department of Forestry immediately began treatments; the goal is to prevent overlap with existing NA1 and EU1 populations. [April 2022; summarizing research by Peterson et al.] Given the number of infected trees and the new variant, Oregon pathologists believe this to be a separate introduction to Oregon forests that has been spreading in the area for at least four years [February 2022].

Scientists [April 2022; summarizing research by Peterson et al.] again note evidence of repeated introductions of novel lineages into the western US native plant communities; this region is highly vulnerable to Phytophthora establishment, justifying continued monitoring for P. ramorum not only in nurseries but also in forests.

SOD in Oregon; photo by Oregon Department of Forestry

The EU1 strain is also present in northern California, specifically in Del Norte County. It was detected there in 2020. Despite removal of infected and nearby host trees (tanoaks) and treatment with herbicide to prevent resprouting, the EU1 strain was again detected on tanoaks in 2021. The detected strain is genetically consistent with the EU1 outbreak in Oregon forests. Oddly, the usual strain found in North American forests, the NA1 strain, was not detected in Del Norte Co. in 2021 [February 2022].

One encouraging research finding [April 2022; summarizing research by Daniels, Navarro, and LeBoldus] is that established treatment measures have had significant impact on both the NA1 & EU1 lineages. They found on average 33% fewer positive samples at treated sites where NA1 is established; 43% reduction in P. ramorum prevalence at EU1 sites. Prevalence of P. ramorum in soil was not affected by treatment.

SOD Spread in Forests

In California, the incidence of new Phytophthora ramorum infections fell in 2021 to a historic low – estimated 97,000 dead trees across 16,000 acres, compared to ~885,000 dead trees across 92,000 acres in 2019 [April 2022]. It is agreed that the reason is the wave of mortality sparked by the very wet 2016-2017 winter has subsided and has been followed by several years of drought [February 2022].

data showing decline in new SOD detections in California in 2021 (no data collected in 2020)

In Oregon, however, SOD continues to spread. In 2010, the OR SOD Program had conceded that eradication was no longer feasible. Instead, authorities created a Generally Infested Area (GIA) where removal of infested tanoaks was now optional (not mandated) on private and state-owned lands. Since then, SOD has continued to spread and intensify within the designated zone. The GIA has been expanded eight times since its establishment in 2012; it now it covers 123 sq. mi. There has also been an immediate increase in tanoak mortality [December 2021].

In 2021, two new infestations were detected outside the GIA. One outbreak is on the Rogue River-Siskiyou National Forest along the Rogue River, 6 miles north of any previously known infestation. The second is just outside Port Orford [February 2022], 33 km north of the closest known infestation. This second infestation is composed of the NA2 variant [see above]. The Oregon Department of Agriculture (ODA) established emergency quarantines at these sites and began eradication efforts at both sites. The Oregon legislature appropriated $1.7 million to Oregon Department of Forestry to carry out an integrated pest management program to slow spread of the disease [February 2022].

Scientific research indicates that this situation might get worse. While it has long been recognized that California bay laurel (= Oregon myrtle) (Umbellularia californica) and tanoak are the principal hosts supporting sporulation and spread, it has now been determined that many other native species in the forest can support sporulation. Chlamydospore production was highest on bigleaf maple (Acer macrophyllum)and hairyCeanothus (Ceanothus oliganthus). All the other hosts produced significantly fewer spores than tanoak and myrtle [October 2021; summarizing research by Rosenthal, Fajardo, and Rizzo]

Furthermore, studies that aggregate observations of disease on all hosts, not paying attention to their varying levels of susceptibility, might lead scientists to misinterpret whether the botanic diversity slows spread of the pathogen [October 2021 summarizing research by Rosenthal, Simler-Williamson, and Rizzo].

Monitoring to detect any possible spread to the East

SOD risk map based on climate & presence of host species; USFS

The USDA Forest Service continues its Cooperative Sudden Oak Death Early Detection Stream Survey in the East. In 2021, 12 states participated – Alabama, Florida, Georgia, Illinois, Maryland, Mississippi, North Carolina, Pennsylvania, South Carolina, Texas, West Virginia, and Wisconsin. Samples were collected from 79 streams in the spring. Two streams were positive, both in Alabama. Both are associated with nurseries that were positive for P. ramorum more than a decade ago [October 2021].

Continued infestations in the nurseries

USDA Animal and Plant Health Inspection Service (APHIS) reported that in 2021, the agency supported compliance activities, diagnostics, and surveys in nurseries in 22 states. P. ramorum was detected at 17 establishments. Eight were new; nine had been positive previously. These included seven nurseries that ship intrastate – all had been positive previously. Six were already under compliance agreements. Also positive were three big box stores – none previously infected; and six nurseries that sell only within one state – five new. Infections at the big box outlets and half the intrastate nurseries were detected as a result of trace-forwards from other nurseries.

P. ramorum was detected in 300 samples in 2021 – 144 from plants in the genus Viburnum; 106 from Rhodendron (including azalea); and much lower numbers from other genera.

APHIS funds states for annual nursery surveys, compliance activities, and diagnostics through the: Plant Protection Act Section 7721 and the Cooperative Agricultural Pest Survey (CAPS) program. Table 4 lists states receiving survey funds. APHIS also supported compliance and diagnostic activities in California, Louisiana, Oklahoma, Oregon, Pennsylvania, Washington, and several states through Florida.

APHIS’ report – which provides few additional  details about the nursery  detections – can be found here.

California:

The California Department of Food and Agriculture (CDFA) reported that three of the eight nurseries regulated under either the federal or state sudden oak death program tested positive in 2021. This was down from five positive nurseries in 2020 [February 2022]. (In the past, numbers of nurseries testing positive have declined during droughts, risen during wet years.) At one interstate-shipping nursery 145 positive Viburnum tinus plants were detected by regulators in December 2021. Apparently the detection efforts were prompted by a trace-back from a nursery in an (unnamed) other state [April 2022].

Oregon:

Oregon continues to struggle with the presence of Phytopththora ramorum in the state’s nurseries. Early in 2021 the situation looked good. Three of eight interstate shippers and two intrastate shippers “passed” their sixth consecutive inspection with no P. ramorum detected so they were released from state and federal program inspection requirements. A fourth interstate-shipping nursery had ceased operating. By the end of the year, however, circumstances had deteriorated. One of the four interstate shippers still under regulatory scrutiny appeared to be badly infested. After routine autumn monitoring detected an infected plant, subsequent delimitation samplings detected 30 additional positive foliar samples and a large number (24) of samples were inconclusive. By spring 2022 six nurseries had to be inspected following trace-forwards from out-of-state nurseries. No P. ramorum was detected in five of these nurseries; the sixth had one positive foliar sample, so it is now under more stringent regulatory supervision [April 2022].

Washington:

Washington has only one interstate shipping nursery that is regulated under APHIS’ program; it tested negative in autumn 2021 [December 2021]. Meanwhile, USDA & Washington Department of Agriculture (WSDA) decided to deregulate the Kitsap County Botanical Garden where P. ramorum had been detected in 2015. Since then, more than 5,000 samples have been collected; 99.1% have tested negative. The last positive plant sample was collected in February 2016. Under a compliance agreement, the botanical garden will continue the best management practices deemed successful in eradicating the pathogen [December 2021]. However, water at the site continues to test positive [February 2022]. These water detections – in Washington and Alabama (above) – raise troubling questions.

Meanwhile, in late winter [April 2022], WSDA had to conduct two trace-forward investigations on plants that shipped from (unnamed) out-of-state nurseries. As of the April newsletter, 13 samples from four locations were all negative.

A stubborn problem has been the persistence of SOD infections in nurseries after the Confirmed Nursery Protocol has been carried out. Research indicates the reason might be that the pathogen is still there in the form of soilborne inoculum in buried, infested leaf debris [December 2021 newsletter; summarizing research by Peterson, Grünwald, and Parke].

Another native tree identified as host

photo by Miguel Vieira; via Wikimedia

Dieback on golden chinquapin, Chrysolepis chrysophylla, a slow growing, evergreen tree native to the U.S. west coast has been confirmed as caused by Phytophthora ramorum. The detection was in a part of Marin County, California heavily infested by P. ramorum since early in the epidemic. Affected trees were large overstory trees. Unlike other hosts in the Fagaceae, there were no external bole cankers [April 2022 newsletter; summarizing research by Rooney-Latham, Blomquist, Soriano, and Pastalka].

SOURCES

Brasier, C.M. 2008. The biosecurity threat to the UK and global environment from international trade in plants. Plant Pathology (2008) 57, 792-808

Grunwald, N.J., M.M. Larsen, Z.N. Kamvar, P.W. Reeser, A. Kanaskie, J. Laine and R. Wiese. 2016. First Report of the EU1 Clonal Lineage of Phytophthora ramorum on Tanoak in an Oregon Forest. Disease Notes. May 2016, Vol. 100, No. 5, p. 1024

Posted by Faith Campbell

We welcome comments that supplement or correct factual information, suggest new approaches, or promote thoughtful consideration. We post comments that disagree with us — but not those we judge to be not civil or inflammatory.

For a detailed discussion of the policies and practices that have allowed these pests to enter and spread – and that do not promote effective restoration strategies – review the Fading Forests report at http://treeimprovement.utk.edu/FadingForests.htm