In 2017 I blogged about a study by Hanno Seebens and 44 coauthors that showed that the rate of new introductions of alien species has risen rapidly since about 1800 – and showed no sign of slowing down (a reference to the full article is at the end of this blog). Here’s a brief recap, followed by a 2020 update by Seebens and colleagues.
In 2017, Seebens et al. analyzed a database covering 45,813 first records of 16,926 alien species established in 282 distinct geographic regions. The year with the highest number of reported new detections was 1996 – 585, or an average of more than 1.5 sightings per day.
The authors found that the adoption of national and international biosecurity measures during the 20th Century had slowed introductions – but not sufficiently. Numbers of reported new introductions of fish and mammals had decreased since the early 1950s. However, first recorded introductions of vascular plant species remained high, and introductions of birds and reptiles also continued to rise, largely as pets in countries with strengthening economies.
For taxa introduced primarily accidentally on transport vectors or as contaminants of commodities (e.g., algae, insects, crustaceans, molluscs and other invertebrates), they found a strong correlation between their spread and the market value of goods imported into the region of interest – existing biosecurity regimes had not slowed down the accumulation of these alien taxa.
As a consequence, the authors expected that the numbers of new alien species would continue to increase.
As you are aware, since 2015 I have posted 15 blogs about the continued detections of tree pests in wood packaging, which remains one of the major pathways despite the international regulation ISPM#15. I have found it harder to track insect and pathogen introductions on imported plants, but it surely continues apace.
2020 Study Projects Continuing Rise in Introductions, Especially Arthropods
Hanno Seebens and a smaller set of coauthors (see full reference at the end of this blog) have now produced an estimate of probable introduction rates in the future. They looked at taxon–continent combinations for seven major taxonomic groups and eight continents (excluding Antarctica).
They found an overall increase in established alien species between 2005 and 2050 of 36%.
The study predicted that by the mid-21st Century, there will be distinct increases in alien species numbers, particularly for Europe, but also for Temperate Asia and North America, and for invertebrates in all regions. Europe ranked highest in absolute numbers of new alien species (~2,543; a 64% increase). Temperate Asia was projected to receive about 1,597 species (a 50% increase); North America about 1,484 (a 23% increase); South America about 1,391 (a 49% increase); and the Pacific Islands about 132. Only Australasia could expect a slower rise in introductions. The predicted trajectories of alien species numbers were surprisingly similar for mainland and island regions across taxonomic groups.
Invertebrates showed the highest relative increases. Rates of new detections of alien species were projected to accelerate for arthropods other than crustaceans worldwide, especially for North America (!). The study also projected higher relative increases for aquatic vascular plants and terrestrial insects
All drivers of introduction and invasion are predicted to intensify in the future. This is despite adoption of increasing numbers of countermeasures in recent decades. Most countries’ capacity to proactively counter the rising tide of invasive species is still poor. Furthermore, the principal drivers – intensification of trade and transport, land-use change, and access to new source pools – is expected to continue operating as now – “business as usual”.
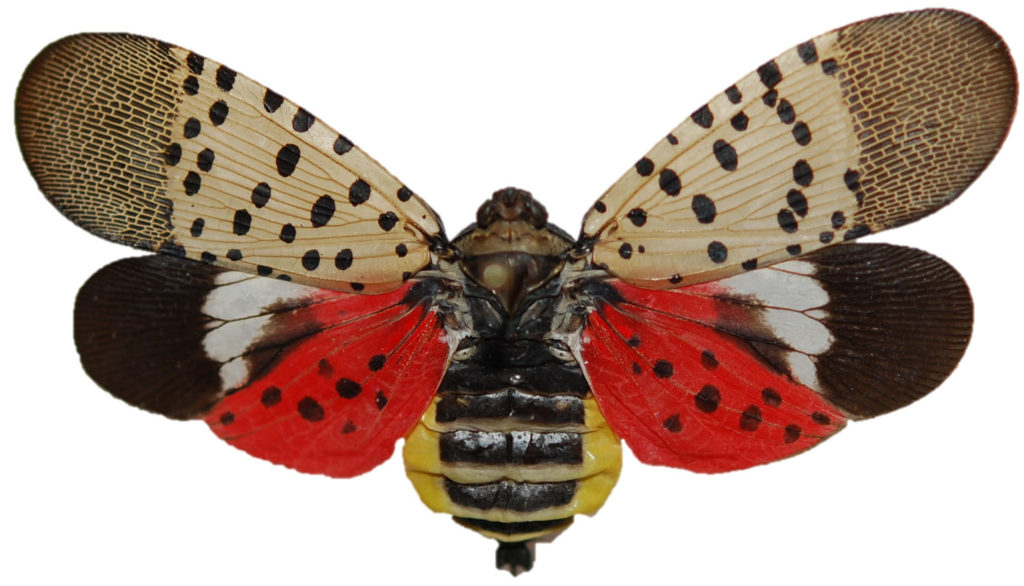
spotted lanternfly Holly Ragusa, Pennsylvania Department of Agriculture
Current Status of “New” Detections
Seebens et al. (2020) relied on the Alien Species First Records Database for first detection records up to 2005. More than half (54%) of the first-detection records in the database are vascular plants. Arthropods other than crustaceans made up 28% of the total, birds 6%, fishes 4%, mammals 3%, molluscs 2%, and crustaceans 2%. The 2020 study confirmed the earlier finding that the observed first-record rates of mammals changed at around 1950 from an increasing to a decreasing trend. Finally, the total numbers of non-native species in the Database is much lower in aquatic habitats. (The authors do not discuss whether this reflects actual introductions or gaps in reporting.)
In the database, Europe recorded 38% of all first records, North America 16%, Australasia 15%, South America 9%, Temperate Asia 9%, Africa 6%, Pacific Islands 5% and Tropical Asia 2%.
A comparison to the immediate past (1960-2005) showed that the rates of emerging non-native species were projected to accelerate during 2005-2050, especially for arthropods. As I noted above, North America is predicted to have high increases in absolute numbers. Increases are also predicted for birds. Declines are predicted for mammals and fishes.
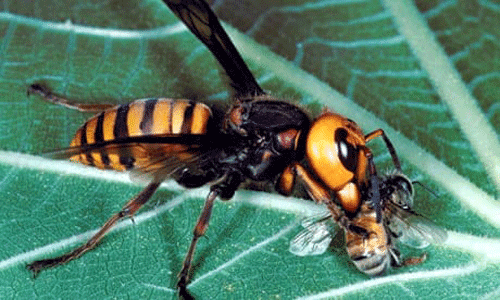
Asian giant hornet; photo from University of Florida Department of Entomology
Projected increases for Australasia were consistently lower than in the past.
Caveats:
1) The authors assumed that past patterns of alien species accumulation will continue in the future. They did not attempt to predict efforts to strengthen biosecurity regulations and mitigation strategies.
2) Projections were calculated in the absence of data on many underlying drivers for the historic periods and some taxonomic groups. However, observed trends of newly-detected alien species numbers during the 20th century were surprisingly stable despite distinct political and socio-economic changes.
Seebens and colleagues conclude that implementation of targeted biosecurity efforts can reduce the numbers of new alien species becoming established. However, a significant decrease in rates of alien species numbers on a large scale can only be achieved by a coordinated effort that crosses political borders.
Seebens, H., S. Bacher, T.M. Blackburn, C. Capinha, W. Dawson, S. Dullinger, P. Genovesi, P.E. Hulme, M. van Kleunen, I. Kühn, J.M. Jeschke, B. Lenzner, A.M. Liebhold, Z. Pattison, J. Perg, P. Pyšek, M. Winter, F. Essl. 2020. Projecting the continental accumulation of alien species through to 2050. Global Change Biology. 2020;00:1 -13 https://onlinelibrary.wiley.com/doi/10.1111/gcb.15333
Posted by Faith Campbell
We welcome comments that supplement or correct factual information, suggest new approaches, or promote thoughtful consideration. We post comments that disagree with us — but not those we judge to be not civil or inflammatory.
For a detailed discussion of the policies and practices that have allowed these pests to enter and spread – and that do not promote effective restoration strategies – review the Fading Forests report at http://treeimprovement.utk.edu/FadingForests.htm
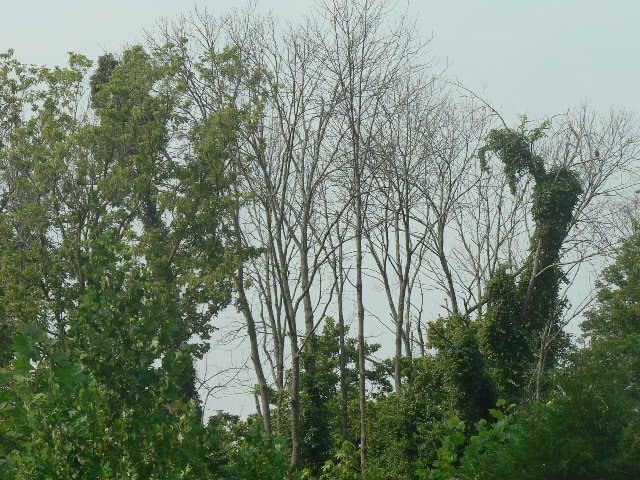
dead ash along Accotink Creek, Fairfax County, Virginia photo by F.T. Campbell
As we all know, the emerald ash borer (EAB) has killed millions of ash trees in its invaded range across eastern North America. However, field studies have detected robust regeneration of ash seedlings and saplings in various invaded areas. Ward et al. 2021 (full citation at end of blog) set out to determine whether this regeneration will result in recovery of mature ashes that can perform their ecological role. They conclude that it will not. Instead, they say, the EAB invasion will probably alter successional patterns and composition of large areas of naturally regenerating forests, causing a cascade of ecological impacts in ash-containing ecosystems
Ward and colleagues used USDA Forest Service Forest Inventory and Analysis (FIA data) to quantify ash recruitment and regeneration across the entire eastern United States. Theirs is the first study to evaluate trends across the region, rather than specific locations or stands. They related the FIA recruitment data to EAB spread, as measured by USDA Animal and Plant Health Inspection Service’ (APHIS) record of the first EAB detection in each county.
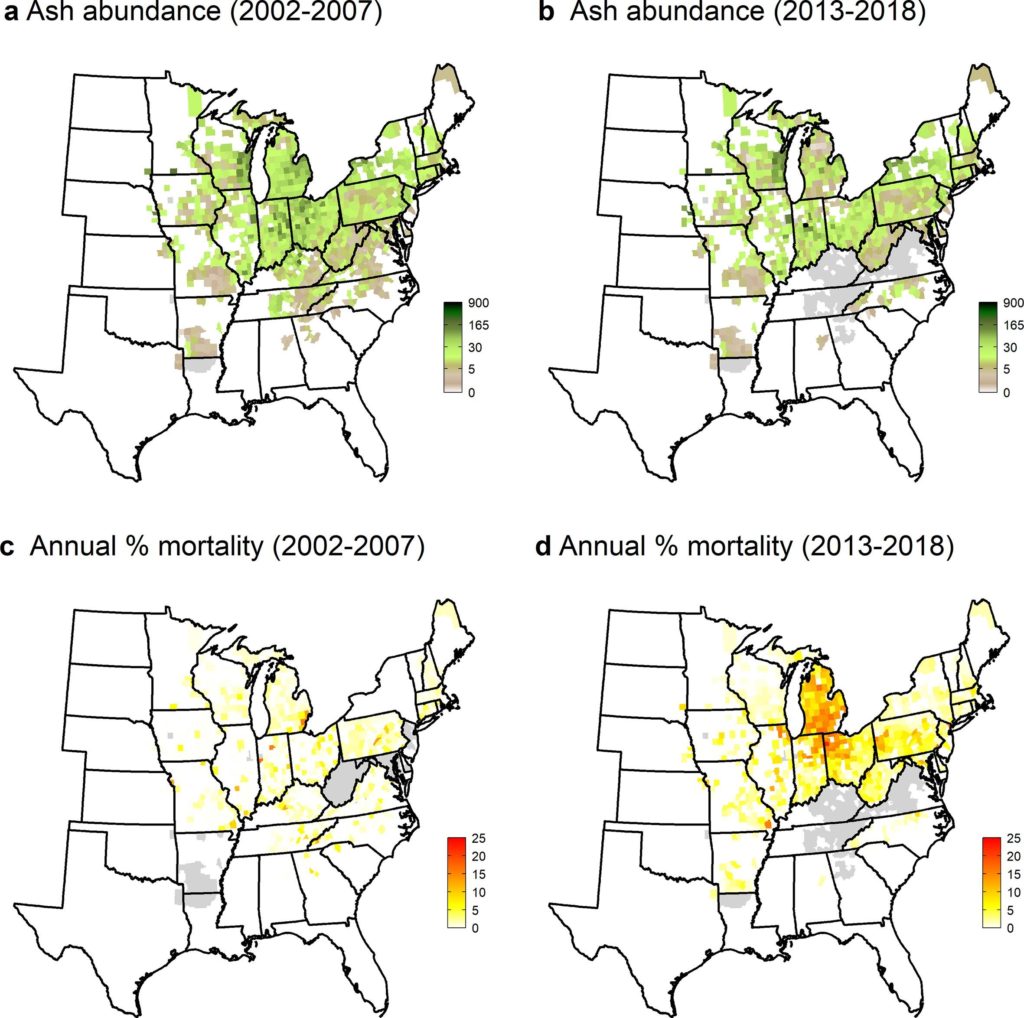
FIA inventories in 2002-2007 and 2013-2018 show large numbers of ash seedlings and saplings in counties invaded in the first wave of invasion, 2002–2006. These areas had higher densities of both seedlings and saplings than plots in other counties. The earliest-invaded counties were in areas that had extraordinarily high densities of ash before the EAB invasion, so the numbers of seedlings and saplings probably reflected that abundant seed source.
However, by the 2013-2018 inventory ash trees in the smallest overstory class (12.7 cm dbh) were dying at faster rates than they were recruited from seedlings or saplings in all 362 counties recorded by APHIS as EAB-infested before 2013. Ward and colleagues found these negative population trajectories on plots that have been invaded for more than about 10 years. This trend suggests that ash will continue to decline in abundance and may become functionally extinct across the invaded range.
Some U.S. Forest Service biologists are more optimistic about ash recovery in response to biocontrol of the EAB. See their podcast here.
In the risk of functional extinction, ash trees are unfortunately not unique. The authors note similar impacts from the invasion of the hemlock woolly adelgid and beech bark disease.
Data Reveal History of Invasion (spread)
Ward and colleagues focused on the risk of mortality for young ashes as they developed from seedlings to saplings, and, eventually, to overstory trees. The youngest “overstory” trees are 12.7 to 17 cm dbh. FIA data show that even the largest trees in this class are 3 cm smaller than trees that produce seeds.
Mortality was initially uniformly low – less than 2.1% — as measured by the first FIA inventory (2002–2007). This is not surprising because EAB was detected only in 2002, and then in only few counties. (EAB had probably been present for a decade before it was detected.)
By the 2013-2018 FIA inventory, mortality had quadrupled to 8–11% in counties invaded during the 2002–2006 period. In the counties invaded during the 2007–2012 period, morality also rose to 3-5%. Both measurements included all diameter classes. Annual mortality rates in the FIA 2013-2018 inventory were still highest for the counties invaded during 2002–2006 except for the largest trees (those greater than 40 cm dbh). By the time of the 2013-2018 FIA survey, overstory ash densities near the epicenter had since declined substantially. They had been nearly eliminated in some counties in southeastern Michigan. There were still sufficient numbers of smaller trees in the region to exhibit an elevated mortality rate – more than 10% per year in several counties in Michigan, Indian, and Ohio. By contrast, in the most recently invaded areas – those counties recorded by APHIS as infested after 2013 – there was very little change in ash densities compared to the 2002-2007 period. This is hardly surprising since it takes years for mortality to reach levels observable by the FIA process.
dead ash on edge of Pohick Bay, Fairfax County, Virginia photo by F.T. Campbell
Considering trees just entering the overstory category (those with diameters of 12.7 cm dbh), annual mortality increased substantially across the region. Between the first FIA inventory (conducted in 2002-2007) and the second inventory (conducted in 2013-2018), their average annual mortality rose more than four-fold, from 0.08 trees per ha to 0.37 trees per ha. By 2013-2018, recruitment in the 2002–2006 invasion cohort was about 50% less than tree mortality levels; recruitment and mortality were about equivalent for the counties invaded in the 2007–2012 period. Recruitment was [still] significantly higher than mortality for the counties recorded as invaded in 2013–2018. However, Ward and colleagues expect mortality rates of this cohort to accelerate over the next five to 10 years – even in areas with lower ash densities.
Ward and colleagues note that many of the young ash trees were dying before they could reach reproductive age – which they estimated to be about 20 years with a dbh of about 20 cm.
As the invasion progresses and hosts are depleted, mortality rates could slow, but, for ash to persist, it is critical that sufficient numbers of trees reach reproductive age before succumbing to residual EAB populations.
Other factors that might influence ash include competition with trees in other genera. The biocontrol agents now becoming established in young ash forests might increase the likelihood of ash persistence. Still, seed production and seedling survival will need to be frequent and widespread if they are to offset expected mortality. Resilience might also vary depending on individual species’ vulnerability to changes in the climate and to EAB (green and black ash are more vulnerable than white ash).
SOURCE
Ward, S.F., A.M. Liebhold, R.S. Morin, S. Fei. 2021. Population dynamics of ash across the eastern USA following invasion by emerald ash borer. Forest Ecology and Management 479 (2021) 118574
Posted by Faith Campbell
We welcome comments that supplement or correct factual information, suggest new approaches, or promote thoughtful consideration. We post comments that disagree with us — but not those we judge to be not civil or inflammatory.
For a detailed discussion of the policies and practices that have allowed these pests to enter and spread – and that do not promote effective restoration strategies – review the Fading Forests report at http://treeimprovement.utk.edu/FadingForests.htm
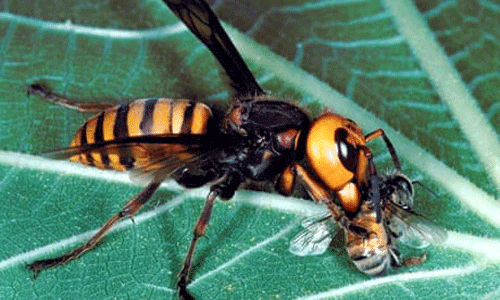
Asian giant hornet; photo from University of Florida Department of Entomology
Asian giant hornet (AGH) (Vespa mandarinia) is the world’s largest hornet, reaching sizes of 1.5 – 2 inches long. Its native range includes much of Asia. While media attention has focused on the hornet’s frightening size, the real threat is to honey bees (Apis spp.) and – especially – to the many important crops that bees pollinate.
Over the past year or so, several detections of the Asian giant hornet have been found in the Pacific Northwest – in British Columbia and Washington State. Four of the sites are within a few miles of each other. Two others are separated by miles of open water from the mainland sites. As of mid-October, 18 hornets had been detected in Washington State.
USDA’s Animal and Plant Health Inspection Service (APHIS) has partnered with the Washington Department of Agriculture to try to eradicate the hornet – which will not be easy! However, the Canadian Food Inspection Service (CFIA) has decided not to designate the hornet as a quarantine pest. This decision seems to threaten divergent approaches to the bioinvader. Fortunately, the Province of British Columbia is trying to eradicate its populations – so perhaps the diverging federal approaches will not result in facilitating the hornet’s establishment and spread.
Where the Hornet Is Known to Be
The first detected outbreak of the Asian giant hornet was in Nanaimo, British Columbia – on Vancouver Island. A single hornet was detected in August 2019. [A Canadian commenter said in March 2021 that this turned out to be a different species, V. soror.] A nest was detected in September and destroyed by local beekeepers and BC government officials. However, another hornet was found on the mainland – in White Rock, B.C. – in November 2019 [CFIA Decision Document]. In 2020, there have been several unconfirmed sightings in the Cowichan Valley on Vancouver Island (van Westendorp, pers. comm.).
Meanwhile, beekeepers discovered two AGH outbreaks in Whatcom County, WA, on the U.S. side of the border. These discoveries were in December 2019 and May 2020. There were other, unconfirmed reports in both Washington and British Columbia. [USDA APHIS Environmental Assessment (EA)] Indeed, later in 2020, Washington reported a few more sightings — in the Birch Bay area, just south of Blaine and at a site about eight miles east of Blaine (van Westendorp, pers. comm.)
Three of the hornets found in spring 2020 were mated queens (Zhu et al. 2020), which means at least one colony successfully reproduced last year. One of the mated queens was the second detection in Whatcom County – in Custer, Washington. One article said that the locations of this spring’s queens meant either that the new queens travelled up to 35 kilometres (about 22 miles) before founding their nests or that they came from more than one colony. Either way, it probably means that giant hornets could spread faster than initially thought.
White Rock, BC and Blaine, Washington are a few miles apart on the Canada-U.S. border. Langley is 12 miles to the northeast of White Rock – in the Fraser Valley. Custer is 7 miles southeast of Blaine. Birch Bay is 5 miles south of Blaine. The most recent detection is 8 miles east of Blaine. So all these detections are in close proximity and might represent spread from a single introduction site – or maybe not!
Nanaimo and the Cowichan Valley are on Vancouver Island, which is separated from the other locations by a significant distance and open water. The two island sites are about 30 miles apart. They surely represent one or more separate introductions.
One study found that a single hornet collected from Blaine, Washington differed genetically from a single hornet collected at Nanaimo on Vancouver Island. This suggests separate introductions. However, too little is known about the hornet’s genetic variability across Asia to allow conclusions about possibly separate origins (van Westendorp, pers. comm.; Wilson et al. 2020).
Areas at Risk
The area at risk is potentially much broader than the Pacific Northwest. APHIS’ initial analyses, based on plant hardiness zones, indicated that the hornet could thrive in virtually all the lower 48 states. APHIS’s Environmental Assessment did not address vulnerable areas in Canada or – apparently – in Hawai`i.
Zhu et al. (2020) carried out an assessment of areas most at risk and the hornet’s potential rate of spread. They found that areas with warm to cool annual mean temperature, high precipitation, and high human activity were most likely to be suitable for the hornet. Areas meeting these criteria are found across western and eastern North America, Europe, northwestern and southeastern South America, central Africa, eastern Australia, and New Zealand. Most of central North America and California are less suitable.
Spread could be rapid in the Pacific Northwest: they predicted that the hornet could reach Oregon in 10 years, eastern Washington and British Columbia within 20 years. This prediction is based in part by experience with the invasive congener V. velutina in Europe; it has expanded by 78 km/year in France, 18 km/year in Italy.
Oregon is relying on beekeepers to detect the hornet, which they expect will arrive even earlier than 10 years from now. The Oregon Department of Agriculture has suffered severe budget cuts because of the Covid-19 crash in state tax collections, so the program is trying to save money. As of the beginning of October, none of the hundreds of citizen reports has been a Vespa of any species (J. Vlach, Oregon Department of Agriculture, pers. comm).
Pathways of Introduction
It is not known how the hornet reached North America. Reports from other countries indicate that they can hitchhike in shipments of empty plant containers, or in the straw in which the containers are packed. In addition, some Asian cultures regard the hornets as delicacies, so deliberate importation is possible. Both APHIS and the Canadian Food Inspection Agency (CFIA) have intercepted such shipments (CFIA Decision document; USDA APHIS PPQ New Pest Response).
The Threat
The AGH typically feeds on a variety of terrestrial invertebrates including beetles, mantids, caterpillars, and spiders (EA). During the spring and summer, hornets attack their prey singly. However, in the Aautumn, hornet workers carry out mass attacks against other social Hymenoptera – including other species of Vespa, yellowjackets (Vespula spp.), various paper wasps (Polistes spp.), and honey bees (Apis spp.). Commercial honeybee colonies are typically lost when attacked en masse. They are especially vulnerable because they are more concentrated than wild bee colonies. [EA]
Commercial honeybee colonies pollinate a wide variety of crops, including tree fruits, cane fruits (berries), tree nuts, tomatoes, and even potatoes. Supplies of beef and milk might also be at risk because alfalfa hay is pollinated by bees. Of course, honey production would also be threatened. As USDA APHIS has stated, if the Asian giant hornet spreads it would become a new stress on top of the multiple existing causes of honeybee decline.
Also, there is a direct threat to people. The AGH has a painful sting that can result in anaphylaxis, cardiac arrest, and other complications in susceptible people. Officials emphasize that most people will not be at risk of stings. However, beekeepers are – their usual Personal Protective Equipment (PPE) is not adequate to ward off the hornet’s sting [APHIS EA & New Pest .
APHIS’ programmatic Environmental Assessment notes that the hornet might also pose a threat to vertebrates that nest in ground burrows and decayed trunks and roots near the ground. Burrows chosen by female hornets for nest construction can be surprisingly large, up to 60 cm (24 inches) in diameter. The EA notes that, in Washington State, badgers, marmots, ground squirrels, and other small mammals use dens or burrows. Among these, four pocket gophers and the American wolverine are federally listed under the Endangered Species Act in Washington State. [For a list, see the environmental assessment.] The EA does not discuss whether cavity-nesting birds might also be affected – although the hornets do prefer hollows near or at ground level. The authors of the EA expect vertebrates to abandon any burrows used by the hornet, so they would be displaced rather than harmed by pesticides applied by the program described below.
APHIS program
APHIS and the Washington State Department of Agriculture (WSDA) have begun an eradication program. I think eradication will be challenging because it will be very difficult both to find nests and to destroy them.
Hornets nest typically in forested areas or urban green spaces. There are lots of suitable places in the Pacific Northwest! These wooded areas are interspersed with farms, orchards, and settlements that will provide vulnerable insects as food sources.
Nest destruction involves excavating a hole two meters by two meters. This digging must be in woodlands, often right next to trees.
The key to successful eradication is finding and destroying the nests before they produce reproductive females and males – in autumn. Nest detection will be carried out as follows [EA]:
Starting in April, the agencies bottle traps in trees near the 2019 detection points. The traps are baited with a solution of rice cooking wine and orange juice to attract the worker bees. (The rice wine is added to discourage honeybees from visiting the trap.) Traps catches help define areas where nests are located.
WSDA successfully tracked radio-tagged workers to a nest in mid-October. That nest was in a tree hollow, not underground.
WSDA scientists think there were approximately 200 queens in that single nest. Two were vacuumed out during the initial extraction. Inside the nest they found 76 emergent queens and 108 capped cells with pupae that they believe were also queens. Three more queens were trapped in a bucket of water. This nest had approximately 776 cells; large nests can have up to 4,000. WSDA believes there are other nests in the area; they continue to search.
APHIS’ original plan to use pesticides to kill hornets in the nest has been dropped. Washington plans now to use vacuum extraction followed by introduction of CO2 and excavation of the nest. Washington has also not decided whether to deploy traps with the pesticide fipronil (S. Spichiger, pers. comm.)
WSDA has also asked members of the public to set out homemade hornet traps, and to report any suspicious sightings.
Canada Takes Opposite Tack
The Canadian Food Inspection Agency (CFIA) announced in February 2020 (CFIA Decision Document) that it will not attempt to regulate the Asian giant hornet as a quarantine pest for Canada. Therefore, CFIA will place no restrictions on the import or movement of any commodities that may harbor the Asian giant hornet. CFIA will, however, require permits for deliberate importation of the hornets.
CFIA’s reasoning appears to focus on two factors:
The hornet is an indirect threat to plant health (since AGH attacks pollinators. CFIA has traditionally regulated quarantine pests based primarily on significant direct threats to plant health.
Under the international phytosanitary system, countries that designate an organism to be a quarantine pest must put in place the necessary measures to prevent its entry into the country, as well as officially control the pest when present. CFIA states that “High uncertainties about the pathways of entry puts into question the ability to manage this risk, and ultimately the ability and feasibility of regulating V. mandarinia as a quarantine pest.”
Neither APHIS nor CFIA has authority to regulate threats to human health.
Detection and Eradication Efforts in British Columbia (information from van Westendorp, British Columbia Ministry of Agriculture)
In 2020, British Columbia has focused on detection surveillance. Target areas include vicinity of Nanaimo on Vancouver Island; Fraser Valley from White Rock in the West to Langley/Aldergrove in the East (along the US border); and after several credible (but non-verified) sightings, the Cowichan Valley on Vancouver Island. Because of resource limits, the surveillance effort has sought to engage local governments, border agencies, First Nations, forestry & mining companies, farmers, and beekeepers. The ministry also placed numerous bottle traps and encouraged 170 beekeepers in the Fraser Valley to install and monitor traps in their apiaries.
So far, only one AGH specimen has been sighted or collected in the three British Columbia survey areas during 2020 – the single specimen at Langley detected in May. However, the several detections along the U.S. side of the border (see above on recent detections) has spurred BC officials to intensify survey efforts in the Fraser Valley (van Westendorp). A specimen was collected adjacent to the US border in mid-October just north of the multiple detections in the US, and South of the Langley detection last spring (S. Spicher, pers. comm.).
British Columbia will continue to monitor well into the fall season and resume our surveillance in 2021 and 2022 (van Westendorp).
Hornets are clearly able to be transported and introduced. Vespa ducalis was detected in Vancouver, BC in 2019 and in Texas in 2020. Vespa velutina has become established in Europe (J. Vlach, Oregon Department of Agriculture, pers. comm).
USDA APHIS Asian Giant Hornet Control Program in Washington State Final Environmental Assessment—July 2020
USDA AHIS PPQ New Pest Response
van Westendorp, Paul. British Columbia Ministry of Agriculture, pers. comm.
Wilson, T.M., J. Takahashi, S-Erik Spichiger, I. Kim, and P. van Westendorp. 2020. First Reports of Vespa mandarinia (Hymenoptera: Vespidae) in North America Represent Two Separate Maternal Lineages in WA State, US, and BC, Canada. Annals of the Entomological Society of America · October 2020
Zhu, G., J. Gutierrez Illan, C. Looney, and D.W. Crowder. 2020. Assessing the ecological niche and invasion potential of the Asian giant hornet. PNAS Latest Articles ECOLOGY
Recent information raises several troubling/worrisome issues:
1. The overall collapse in trade and travel has severely cut into the collection of user fees. These fees pay for Agriculture Quarantine Inspectors, putting jobs at risk. Their inspections provide important incentives for importers to follow U.S. and international rules to limit pests.
2. The list of imports from China in 2020 includes $1 billion worth of nursery stock. This is down about 7% from 2019. However, from the perspective of preventing plant diseases and pests, these imports continue to be high risk and still not adequately addressed by U.S. policy.
3. Other Asian regions are gaining in import share. Thus we can expect to see more pests arriving from countries other than China, like Vietnam.
Loss of User Fees Could Mean Loss of Inspectors
The collapse of trade and travel has a more troubling result: severe reductions in user fees collected from travelers and importers to fund DHS/Customs and Border Protection Agriculture Quarantine Inspectors. In a recent opinion piece, several former administrators of APHIS warn that current user fee collections are insufficient to sustain inspectors’ employment. A reserve fund will also be depleted this month. APHIS estimates that it will require an appropriation of $630 million to fund these agricultural inspections through the next fiscal year (October 2020 – September 2021).
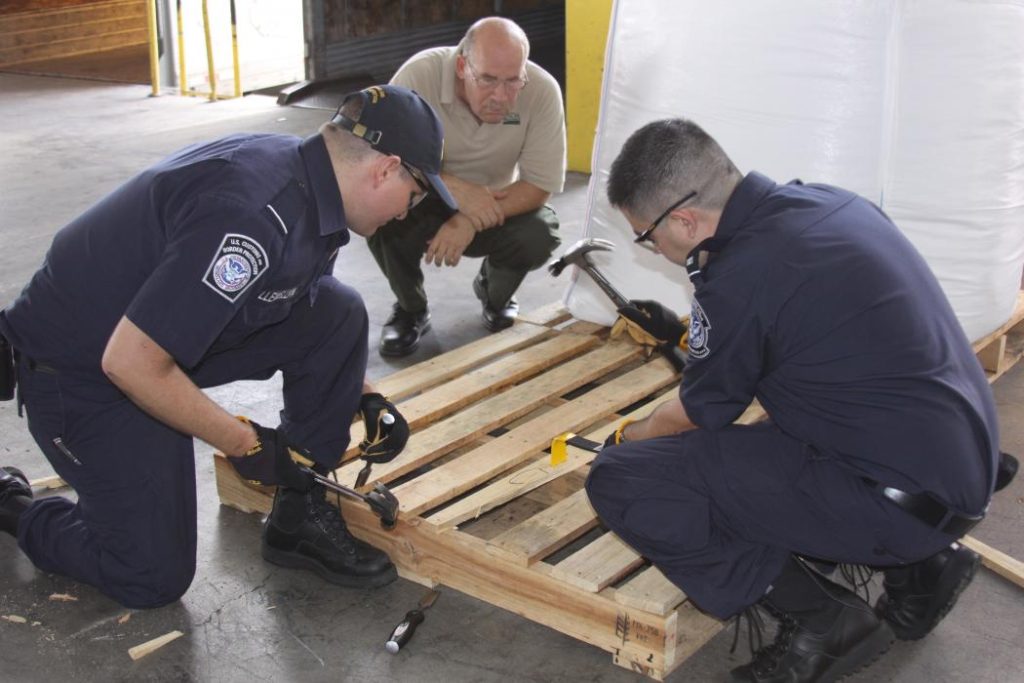
Agricultural inspectors focus on plant and animal imports – including horticultural stock, seeds, fruits, and vegetables – both in commercial shipments and in passengers’ baggage. They are also called in when CBP inspectors suspect pests are present in wood packaging.
I do not consider inspection to be the most effective strategy to prevent introductions. That is, I think inspections are less effective than regulations requiring treatments and pre-shipment pest-mitigation measures. However, losing inspectors – even temporarily – will undermine detection and enforcement as an incentive for importers to comply with U.S. and international rules. This funding crisis is therefore a serious concern. Please ask your senators and member of Congress to support increasing the appropriation for DHS CBP by $650 million to keep these inspectors on the job.
Imports from Asia Skyrocket
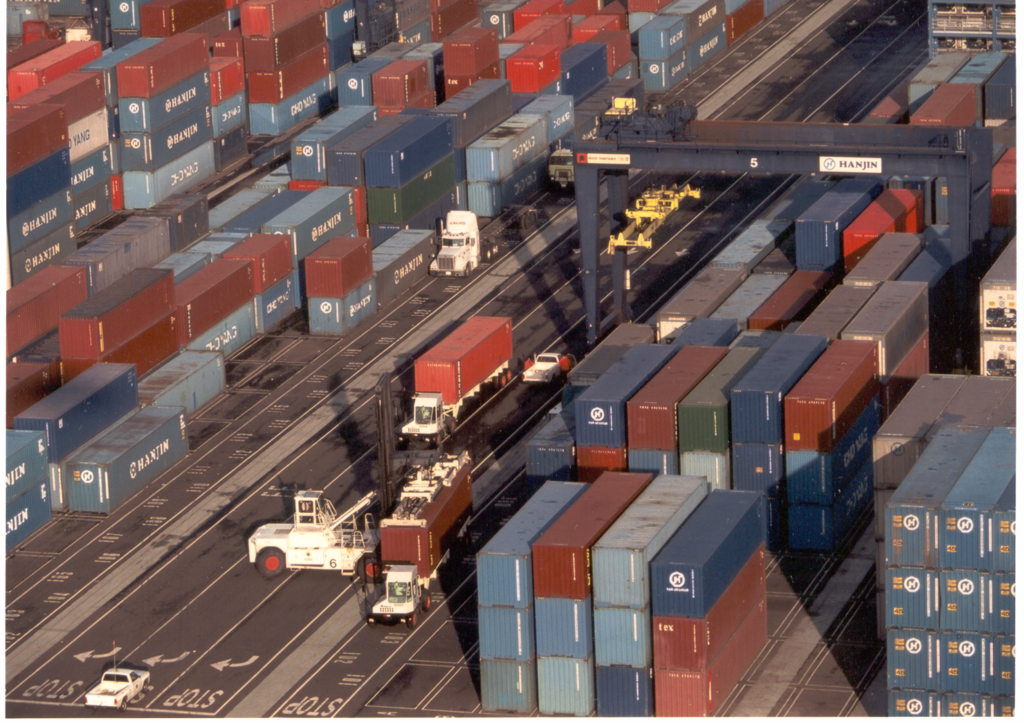
New data show that containerized US import volumes from Asia rocketed 91% between March and August. During the same five-month period a year ago, import volumes rose only 36% — so the 2020 increase is more than double the earlier pace. Numbers of incoming containers from Asia nearly doubled at the ports New York/New Jersey; Los Angeles/Long Beach, California; and Savannah, Georgia. The California ports are reported to be working nearly at capacity. This has resulted in higher handling costs and delays in trucking imports out of the port to their destinations.
Import volumes from Vietnam and India continue outpace the market generally.
Update: Imports from China Continue to Decline Relative to Other Source Regions
In August I posted a blog reporting a significant reduction in imports from China recently – first as a result of new tariffs in 2019, and second, as a result of the global economic crash associated with the Covid-19 virus.
Imports from China decreased by 16% in 2019 compared to 2018, then rose slightly in the first months of 2020. My focus then – and now – is on declining imports of heavy goods — the types of imports most likely to be packaged in wooden crates or on wooden pallets that can transport pests.
Import volumes from China rose later in the year, as the U.S. economy began to rebound. Official data from the U.S. Bureau of the Census shows US imports from China had more than doubled (by value) since March — from $19.8 billion in March to $40.7 billion in July. Still, imports of heavy items and most consumer items – other than computers – have decreased in 2020 compared to 2019.
Included in this list of imports is $1 billion worth of nursery stock – down about 7% from 2019. Nursery stock imports are rarely included in Census reports, so I value this information. Of course, these imports – even ‘though declining – still represent a series plant pest risks. One study showed that imported plants carry a pest risk 12 times higher than wood packaging material (Liebhold et al. 2012; see full reference at end of blog).
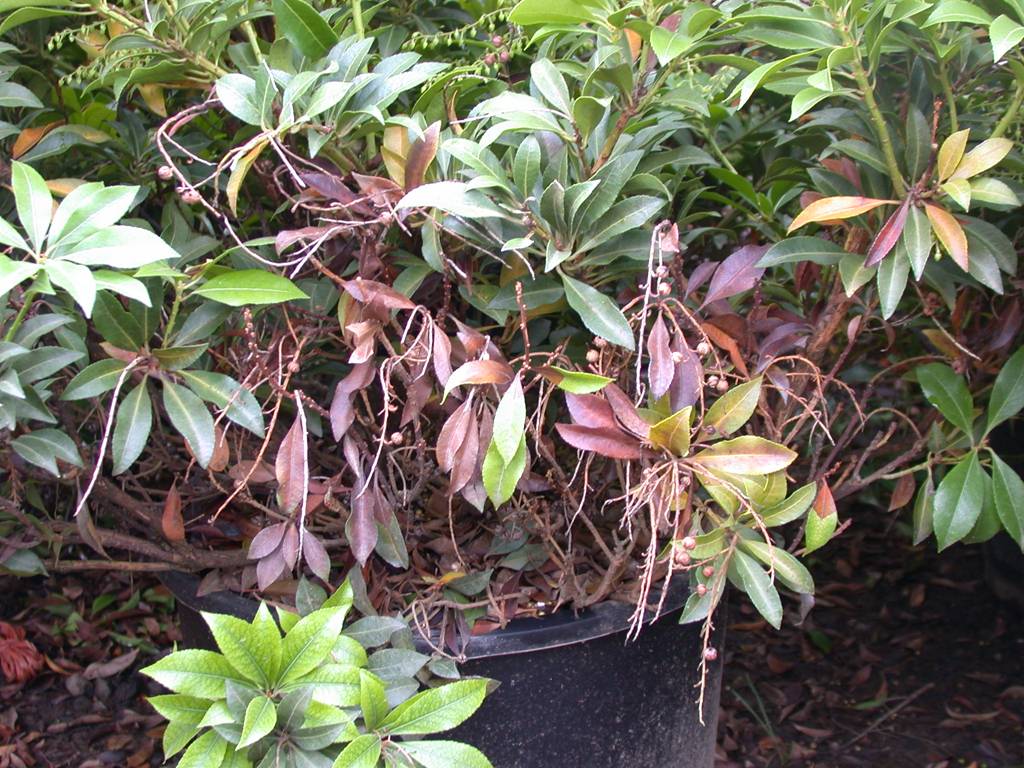
rhododendron infected by sudden oak death – photo courtesy of Jennifer Parke
Important Shifts in Sources of U.S. Imports
Data show a broad and years-long decline in the share of U.S. imports that come from China. This decline is best seen in declining volumes of imports arriving at the ports of Los Angeles, Long Beach, Northwest Sea Alliance and another port in the region. Imports arriving at these ports declined 5.3% in May 2019 compared to May 2018. At that time, this decline was blamed on importers having stocked up in advance of threatened US tariffs on goods from China. Bureau of the Census data show a 2% reduction in loaded twenty-foot-long containers (TEUs) entering Long Beach in calendar year to date 2019 compared to calendar year to date 2020 (through August).
Commercial data sources indicate even larger declines. According to the Journal of Commerce, the twin ports of Los Angeles and Long Beach handled 37.7% of the loaded TEUs entering the United States in 2018. This fell to 33.5% in July 2020 — a drop of 4.2 percentage points in just 18 months. The author of this article said the reason was a fall in imports from East Asia (including China, Hong Kong, Japan, South Korea, and Taiwan) compared to Southeast Asia, Europe, then South America and, finally, South Asia (primarily India). The article provides a table quantifying shifting sources of U.S. imports:
Total US Market Share Imports by Source Region
SOURCE 2018 2019 2020YTD 2018-2020 change
East Asia 61.6% 58% 54.5% -7.1%
Europe 14.9% 15.8% 16.9% +1.9%
Southeast Asia 8.3% 10.5% 11.9% +3.6%
South America 8.2% 10.5% 11.9% +3.6%
South Asia 2.7% 3.1% 3.1% +0.5%
Other source regions – e.g., the Caribbean, Middle East, Pacific, Africa, and Atlantic – were all below 2% of total numbers of TEU in all three years, and changed not at all or minimally over this period.
As I noted in the earlier blog, the pest risk persists. First, imports from China continue, and the most recent data (for the period 2011-2016) indicate significant numbers of shipments continue to be in violation of requirements for wood packaging (APHIS database / pers. comm). Remember, USDA passed up an opportunity to raise the issue of non-compliant wood packaging with Chinese phytosanitary officials.
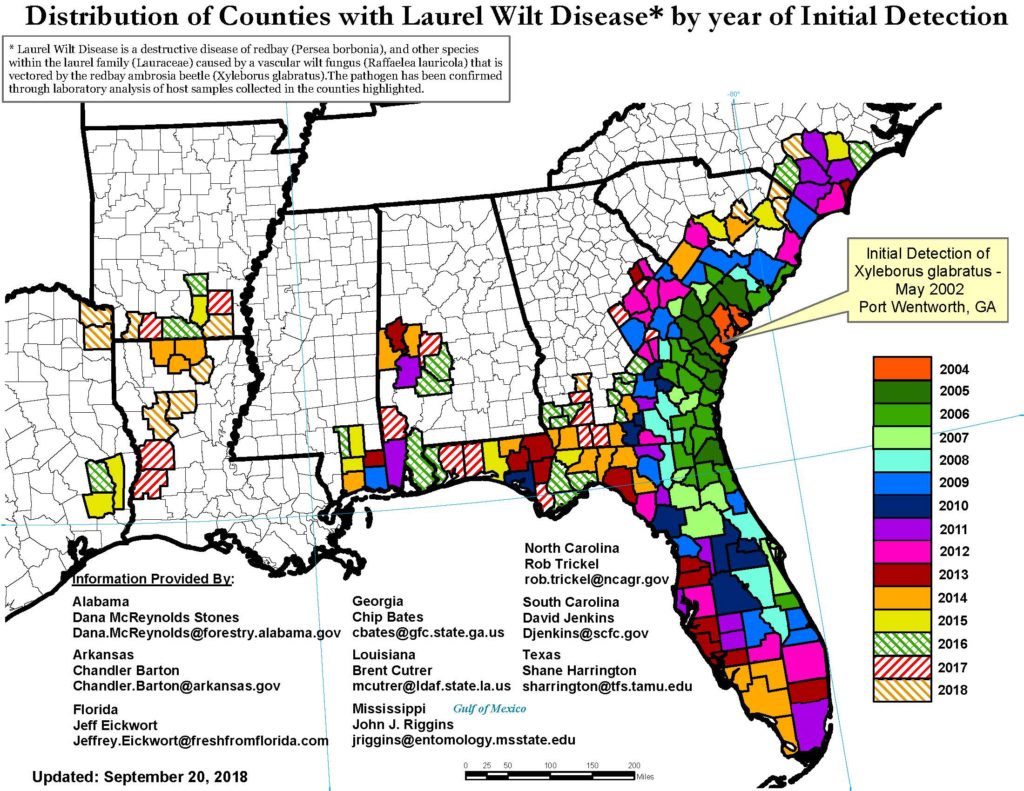
Plus other regions also are the source of pests. I wrote about the risk from Mexico in the previous blog. The region of Southeast Asia has already been the source of highly damaging pests, e.g., redbay ambrosia beetle and polyphagous shot hole borer.
distribution of laurel wilt, carried by redbay ambrosia beetle
Scientists have also detected numerous known and previously unknown species of the brown alga genus Phytophthora in Vietnam and Taiwan. Of course, this is the genus that includes the pathogens that cause sudden oak death, black ink disease, potato blight, and numerous other plant diseases. APHIS has not accepted my urging to undertake rapid assessments of the vulnerability of North American trees to these newly discovered microbes.
SOURCE
Liebhold, A.M., E.G. Brockerhoff, L.J. Garrett, J.L. Parke, and K.O. Britton. 2012. Live Plant Imports: the Major Pathway for Forest Insect and Pathogen Invasions of the US. www.frontiersinecology.org
Posted by Faith Campbell
We welcome comments that supplement or correct factual information, suggest new approaches, or promote thoughtful consideration. We post comments that disagree with us — but not those we judge to be not civil or inflammatory.
For a detailed discussion of the policies and practices that have allowed these pests to enter and spread – and that do not promote effective restoration strategies – review the Fading Forests report at http://treeimprovement.utk.edu/FadingForests.htm
Reminder: Friday is the deadline for commenting on APHIS’ draft environmental assessment for the Asian longhorned beetle eradication program in South Carolina. Comments should be submitted at https://beta.regulations.gov/commenton/APHIS-2020-0086-0001
The Center for Invasive Species Prevention submitted comments that supported the eradication effort because of the well-documented threat that the ALB poses to the forests of North America. We also supported the preferred alternative in the EA.
However, we found the environmental assessment (EA) to be deficient in several ways:
the EA does not identify the host species present in the program area – not even of the 5,800 trees inspected by the program as of mid-August.
the EA provides no estimate of the proportion of deciduous trees and shrubs in the area that are host species. Conifers dominate the area. This means that any fauna dependent on deciduous trees and shrubs for food and shelter already contend with limited resources. Consequently, while we concur with the EA that any impacts will be localized, they might be exacerbated by the relative rarity of hardwood species in the local area. It is particularly important that the EA address this question since the Programmatic EIS was written under the assumption that forests at risk to the ALB are like those in the Northeast and Midwest, where hardwoods dominate.
Without knowing the proportion of deciduous flora comprised of host species, no one can evaluate the amount of wildlife food that could be removed or treated by pesticides. Some wildlife species are potentially vulnerable, including those that feed on pollen and nectar (i.e., bees and other pollinators) and those that feed on insects and other invertebrates. The latter include two species listed federally as threatened species: the frosted flatwood salamander (Ambystoma cingulatum) and northern long-eared bat (Myotis septentrionalis). Also vulnerable are birds, 96% of which feed their young on insects and other invertebrates. I worry about sublethal effects and possible bioaccumulation. Aquatic organisms, especially invertebrates, might also be affected.
The information gaps in the EA highlight weaknesses in the Programmatic EIS, on which it relies. The most important gap is the dearth of pesticide dose/mortality data for terrestrial amphibians. Apparently, EPA has not required such studies before approving pesticides.
Posted by Faith Campbell
We welcome comments that supplement or correct factual information, suggest new approaches, or promote thoughtful consideration. We post comments that disagree with us — but not those we judge to be not civil or inflammatory.
For a detailed discussion of the policies and practices that have allowed these pests to enter and spread – and that do not promote effective restoration strategies – review the Fading Forests report at http://treeimprovement.utk.edu/FadingForests.htm
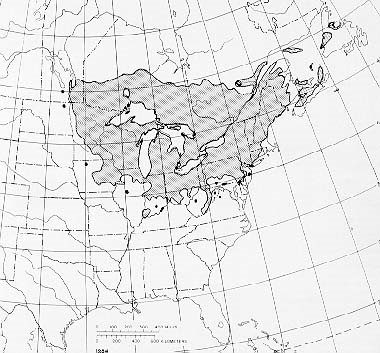
Another unique ecosystem being severely damaged by non-native tree-killing pests are the wetlands dominated by black ash (Fraxinus nigra). Black ash typically grows in fens, along streams, or in poorly drained areas that often are seasonally flooded. Such swamps stretch from Minnesota to Newfoundland; in the three states of Michigan, Wisconsin, and Minnesota, they cover a total of over 2 million hectares (Kolka et al. 2018).
Recent research allows us to understand the impending loss to these unique ecosystems that will be caused by the emerald ash borer (EAB).
Hydrology is the dominant factor that influences a host of ecosystem functions in black ash wetlands. Water levels are largely determined by a combination of precipitation and evapotranspiration rates. Black ash can thrive in wetter areas than most other tree species (Slesak et al. 2014). Water tables in these swamps are typically above the surface throughout early spring, followed by drawdown below the surface during the growing season with periodic rises following rain events. Water table drawdown coincides with peak evapotranspiration following black ash leaf out, demonstrating the fundamental control that this species has on animal and other plant communities (Kolka et al. 2018; Slesak et al. 2014).
Ecological Importance
Black ash generally dominate the canopy of these wetlands. Ash density can range from about 40% to almost 100%. Several other tree species are present, including northern white cedar (Thuja occidentalis), red maple (Acer rubrum), American elm (Ulmus americana) (Kolka et al. 2018), quaking aspen (Populus tremuloides), American basswood (Tilia americana), and bur oak (Quercus macrocarpa) (Slesak et al. 2014), balsam fir (Abies balsamea), balsam poplar (Populus balsamifera), and speckled alder (Alnus incana) (Youngquist et al. 2020). Black ash, by maintaining low water levels during the growing season, creates conditions under which these other trees can live but not thrive (summary of study by B.J. Palik, USDA Forest Service, here. Most other species lack the physiological adaptations of black ash or face pathogenic constraints (e.g., Dutch elm disease on American elm Ulmus americana) (Kolka et al. 2018).
Ash trees in these swamps are uneven-aged with canopy tree ages ranging from 130–232 years (Slesak et al. 2014). This complexity provides important habitat for many wildlife species, including ground beetle community assemblages (Kolka et al. 2018) and an abundance of aquatic macroinvertebrates. These are characterized and dominated by mollusks (Sphaeriidae, Lymnaeidae, Physidae), annelids (Lumbriculidae, Hirudinea), caddisflies (Limnephilidae, Leptoceridae), and dipterans (Chironomidae, Culicidae) (Youngquist et al. 2020).
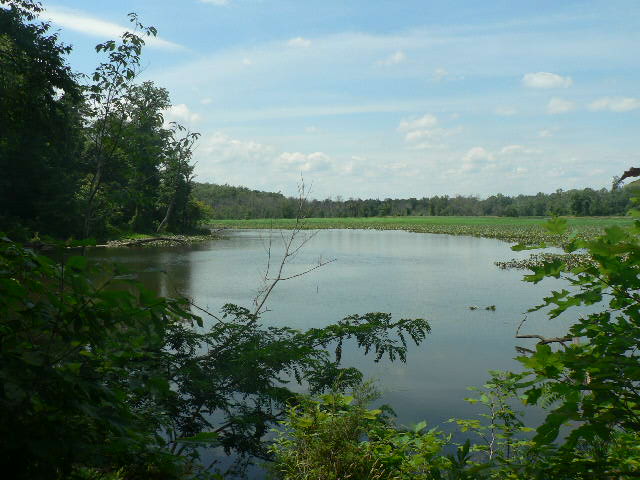
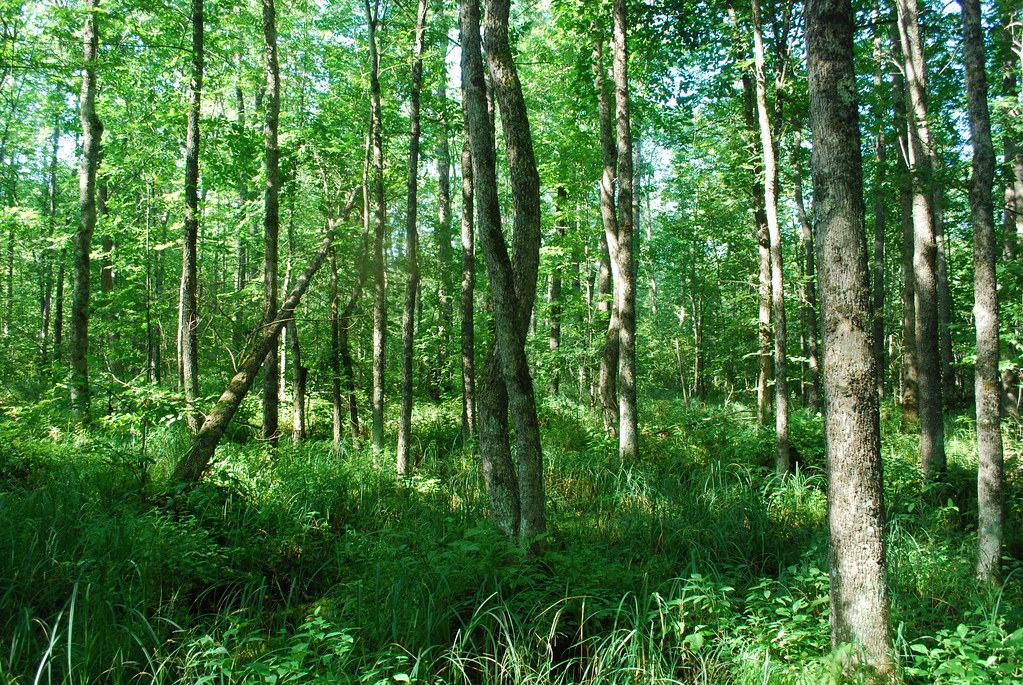
a black ash swamp; source: Flickr
A major concern is that loss of trees – especially ash – might result in open marshes dominated by grasses, especially lake sedge (Carex lacustris). Conversion to sedge-dominated marshes has been observed in areas where trees have been removed as part of experiments to test various ecosystem responses to loss of the ash component (Slesak et al. 2014). Even if other trees took the place of ash, the substitutes might not support the same animal communities (see below).
Impact of Emerald ash borer and loss of black ash
Black ash is highly susceptibility to the EAB (Engelken and McCullough, 2020), so scientists expect severe impacts of the invasion in ash-dominated wetlands and – to a somewhat lesser extent — in forested stream systems’ riparian areas (Engelken and McCullough, 2020). They expect cascading impacts on 1) hydrology; 2) plant communities; 3) wildlife; 4) Native American cultures; and possibly even storage of carbon in vegetation and soils (Kolka et al. 2018).
1) Hydrology
Experiments suggest that loss of ash will cause higher water tables, especially during late summer and fall (Kolka et al 2018). This will result from reductions in evapotranspiration as large trees are replaced by shrubs and grasses (see below) (Kolka et al. 2018; Slesak et al. 2014). The higher water table might be exacerbated if higher annual precipitation levels predicted by climate change models occur. On the other hand, these models also predict a simultaneous increase in longer droughts, which might partially counteract higher precipitation and reduced evapotranspiration (Kolka et al. 2018). If they occur, these possible increases in drought length and frequency might enhance the establishment of less water-tolerant non-ash tree species in former black ash wetlands.
2) Plant Communities
Higher water tables are expected to reduce tree densities and promote conversion to open or shrub-dominated marshes. Several of the possible alternative tree species do not thrive as well as black ash under current conditions (Kolka et al. 2018). However, new hydrologic conditions might make forest restoration even more difficult because herbaceous plants transpire less water than trees, thus exacerbating the rising water tables (Slesak et al. 2014).
In upper Michigan, experiments which killed ash by cutting or girdling did not lead to an increase in growth rates of the remaining canopy species despite the increase in available resources (e.g., sunlight and nutrients) – presumably because of the raised water table (Kolka et al. 2081).
While some studies have found that black ash seedlings and saplings dominated the woody component of the swamp understory up to three years after ash were experimentally removed (Kolka et al. 2018), Engelken and McCullough (2020) found only eight saplings and a single seedling.
Scientists have planted several tree species in experiments to see which might be used to maintain the forested wetlands in the absence of black ash. The results are a confusing mix. Some species grew well once established – but had low levels of seedling establishment. Some trees planted on elevated microsites (hummocks) had the greatest survival and growth rates. (For specific data, see Kolka et al. 2018). A further consideration is tree species’ ability to adapt to warming temperatures already evident and expected to increase in coming decades (Slesak et al. 2014).
Consequently, Slesak et al. (2014) think it is likely that the EAB invasion will alter vegetation dynamics and cause a shift to an altered ecosystem state (e.g., open marsh condition) with higher water tables. They caution that the degree of ecosystem alteration will vary depending on site hydrology, annual precipitation, and period of time necessary for establishment of deeper rooted vegetation.
3) Wildlife
Moreover, any changes in vegetation will also affect the biota in more subtle ways through altered nutrient cycles. Black ash leaf litter is highly nutritious, having some of the highest nitrogen, phosphorus, and cation contents of any hardwood forest species (Kolka et al. 2018). Black ash leaves also decompose faster than most alternative tree species’ leaves (summary of Palik USDA Forest Service, here; Youngquist et al. 2018).
Youngquist et al. (2018) studied litter breakdown, litter nutritional quality, and growth of a representative invertebrate litter feeder – larvae of a shredding caddisfly (Limnephilus indivisus). They found that the larvae’s risk of death increased by a factor of three times or more when caddisflies were fed American elm, balsam poplar, or lake sedge leaves compared to black ash leaf litter. Even when the larvae lived – but matured more slowly because of the lower nutrition value of the leaves – they would still be vulnerable because they must reach metamorphosis before pond dry-down. In any planting done to maintain forested quality of wetlands, need to consider the nutritional quality of the leaf litter provided by replacements. Speckled alder was only apparently acceptable substitute; it was second to black ash in acceptability to caddisflies (Youngquist et al. 2020)
In fact, Youngquist et al. (2020) concluded that plant and detritivore biodiversity loss due to EAB invasion could alter productivity and decomposition at rates comparable to other anthropogenic stressors (e.g., climate change, nutrient pollution, acidification). The result will be altered biogeochemical cycles, resource availability, and plant and animal communities.
Scientists are also concerned about the impact of ash tree mortality on forest connectivity. Conversion of wooded swamps to shrub-and sedge-dominated wetlands will result in the loss of important micro-habitats that are already limited across the forested landscape and may also reduce availability of critical habitat for migrating birds. These changes will exacerbate on-going changes in land use in the Great Lakes region that are causing loss of forest habitat and forest homogenization. As yet, the magnitude of the impact on wildlife is unclear (Kolka et al. 2018).
black ash baskets – displayed at 2006 conference photo by Faith Campbell
4) Cultural importance – baskets
Native Americans living in the range of black ash have utilized the wood to make baskets and other tools for thousands of years. Baskets had numerous uses, such as packs for carrying items, fish traps, and for preparing food and storing household items. Ash items also had ceremonial uses and they are highly sought as gifts and in trade. The skill needed to select a good tree and work the wood is handed down through the generations and is an important part of tribes’ culture (Benedict 2010).
Discussion of these cultural traditions can be found as Powerpoints here and here.
Concerned by the spread of EAB and probable impact on black ash swamps, the USDA Forest Service has initiated major research studies with the goal of filling in the numerous knowledge gaps and developing management recommendations. A large-scale study using various manipulations to simulate the EAB invasion was initiated in the Chippewa National Forest in northern Minnesota in 2009. A companion study began in the Ottawa National Forest in Michigan in 2010 (Kolka et al. 2018). The Slesak, Youngquist, and Kolka publications cited in this blog report results of some of the studies in this project. Other studies of black ash conditions, including regeneration, at various stages of the EAB invasion wave are being carried out by Deb McCullough, Nate Siegert, and others. They are working at sites from Michigan to New England (D.G. McCullough, pers. comm.).
Posted by Faith Campbell
We welcome comments that supplement or correct factual information, suggest new approaches, or promote thoughtful consideration. We post comments that disagree with us — but not those we judge to be not civil or inflammatory.
For a detailed discussion of the policies and practices that have allowed these pests to enter and spread – and that do not promote effective restoration strategies – review the Fading Forests report here.
For a great discussion of black ash basketweavers, see Anne Bolen, A Silent Killer: Black Ash Basket Makers are Battling a Voracious Beetle to Keep their Heritage Alive, American Indian Magazine, Spring 2020, available here.
Engelken, P.J. and D.G McCullough. 2020. Riparian Forest Conditions Along Three Northern Michigan Rivers Following Emerald Ash Borer Invasion. Canadian Journal of Forest Research. Submitted
Kolka, R.K., A.W. D’Amato, J.W. Wagenbrenner, R.A. Slesak, T.G. Pypker, M.B. Youngquist, A.R. Grinde and B.J. Palik. 2018. Review of Ecosystem Level Impacts of Emerald Ash Borer on Black Ash Wetlands: What Does the Future Hold? Forests 2018, 9, 179; doi:10.3390/f9040179 www.mdpi.com/journal/forests
Slesak, R.A., C.F. Lenhart, K.N. Brooks, A.W. D’Amato, and B.J. Palik. 2014. Water table response to harvesting and simulated emerald ash borer mortality in black ash wetlands in MN, USA. Can. J. Forestry. Res. 44:961-968.
Youngquist, M.B., C. Wiley, S.L. Eggert, A.W. D’Amato, B.J. Palik, & R.A. Slesak. 2020. Foundation Species Loss Affects Leaf Breakdown and Aquatic Invertebrate Resource Use in Black Ash Wetlands. Wetlands. Society of Wetland Scientists
Posted by Faith Campbell
We welcome comments that supplement or correct factual information, suggest new approaches, or promote thoughtful consideration. We post comments that disagree with us — but not those we judge to be not civil or inflammatory.
For a detailed discussion of the policies and practices that have allowed these pests to enter and spread – and that do not promote effective restoration strategies – review the Fading Forests report at http://treeimprovement.utk.edu/FadingForests.htm
We know the dire threats to Hawaiian forests from pathogens. Some threaten the most widespread tree – ohia. Others are insects threatening trees and shrubs in the remnant dryland forests.
The forests of smaller islands of the Pacific also appear to be facing severe threats – although I have been unable to find information on the current situation.
Guam and its Neighbors
The forests of Guam, Palau, and others in the Western Pacific are among those threatened.
They are geographically isolated and hard to reach, but that distance has not protected them from biological invaders. Their predicament illustrates the dominant role of global movement and trade in spreading pests. In this case, it’s mostly trade in ornamental plants.
These islands have unique flora and fauna. And true to invasive species experts’ expectations, they are vulnerable to bioinvaders. Guam’s most famous invasive species is the brown tree snake (Boiga irregularis), which over a few decades eradicated many bird species and the only native terrestrial mammal, the fruit bat.
Less known, but equally damaging, have been a group of insects that are decimating Guam’s native forest flora.
The most widespread arboreal species in the forests of Guam and neighboring islands is the Micronesian cycad, Cycas micronesica. Its range is Micronesia, the Marianas Group including Guam and Rota Islands; and several of the western Caroline Islands, e.g., Palau and Yap (Marler, Haynes, and Lindstrom 2010).
These forests have already absorbed severe habitat destruction as the sites of fierce fighting in World War II and – in some cases – construction of large military bases. Still, cycads were the most common species in the forest as late as 2002 (Moore, A., T. Marler, R. Miller, and L. Yudin. Date uncertain).
The Worst Pest: Asian Cycad Scale
The most severe current threat to the cycads are introduced insects, especially the Asian cycad scale Aulacaspis ysumatsui.
The cycad scale is native to Southeast Asia. It was first detected on Guam in 2003, when officials noticed that cycads planted near hotels had begun to die. However, this scale had already been spreading thanks to the trade in ornamental cycads. It was detected in Florida in 1996, on Hawai`i in 1998. It continued to spread rapidly in the western Pacific: to Rota in 2007, Palau in 2008 (University of Guam 2012). By late 2019, the scale had spread globally – numerous islands and neighboring mainland areas in the Caribbean (including Puerto Rico and US Virgin Islands), several US states in the Southeast, California, and Taiwan (Moore, Marler, Miller, and Yudin. Date uncertain.) and South Africa. (vanWilgen, et. al. 2020) Also, see the map prepared by CABI.
In every case, the scale has apparently been spread on nursery stock. It is difficult to contain by standard phytosanitary measures – visual inspection – because the scale is tiny and hides deep in the base of the plant’s stiff leaves and other crevices. (Marler and Moore 2010)
By 2005 the scale was killing the native cycad on Guam. Within four years, the millions of C. micronesica on Guam were reduced by more than 90% (Marler, T.E. and K.J. Niklas. 2011). The last time cycads on Guam reproduced in any significant number was in 2004 (Marler and Niklas 2018).
The severe impact of the scale was so rapid that the International Union for Conservation of Nature and Natural Resources (IUCN) changed its listing of C. micronesica from “near threatened” in 2003 to “endangered” in 2006. (IUCN Red List of Threatened Species Online 2008).
Scientists have made several attempts to introduce a biocontrol agent. However, the most promising – the lady beetle Rhyzobius lophanthae – has failed to control the scale, despite having become virtually ubiquitous on Guam. The beetle is too big to reach the significant proportion of scale insects living in small cracks and voids within the plant structures. Evidence from another cycad species indicates that the beetles also don’t prey on scale insects living beneath trichomes (fine hairlike structures on the leaves) or on parts of the plant close to the ground. (Moore, Marler, Miller, and Yudin. Date uncertain.).
Attempts to introduce a second biocontrol organism – the parasitoid wasp Aphytis lignanensis – were stymied by the presence of R. lophanthae (Moore, Marler, Miller, and Yudin. Date uncertain).
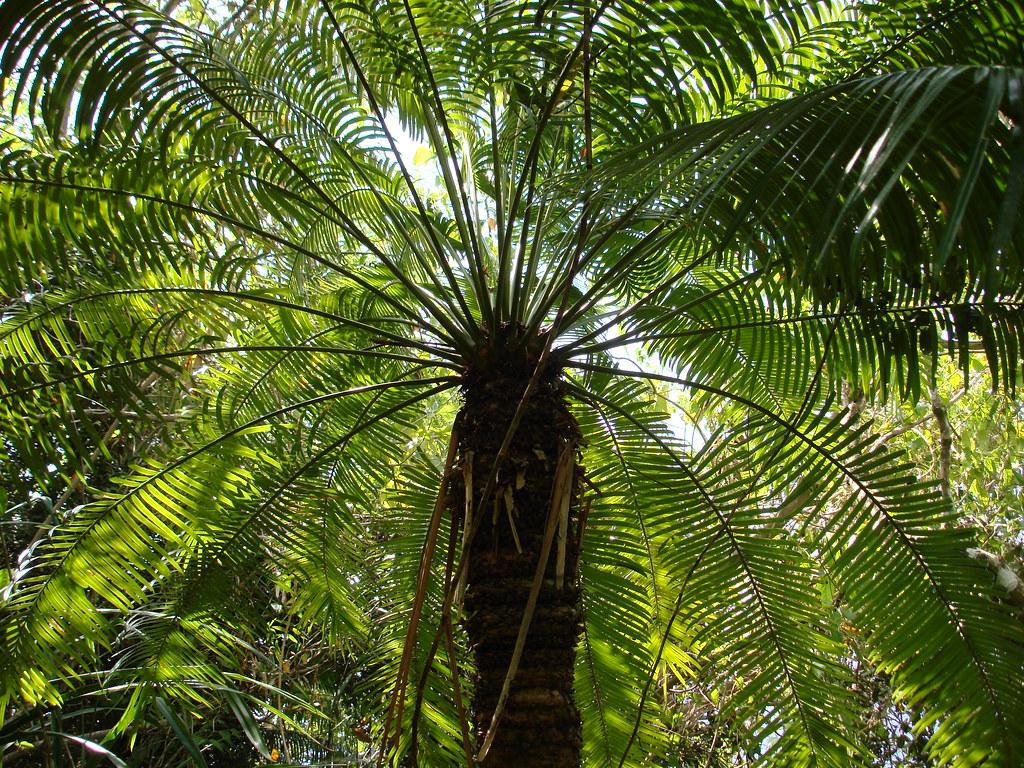
Micronesian cycad photo by Lauren Gutierrez
Other Invasive Species Attacking Cycads
The cycad blue butterfly (Chilades pandava) was detected in 2005 and spread throughout Guam within months (IUCN 2009). Also, it’s been found on Saipan (1996) and Rota (2006). The butterfly is native to southern Asia from Sri Lanka to Thailand and Indonesia. High populations can cause complete defoliation of new foliage. Repeated defoliations can kill the plant. Cycads on Guam are particularly vulnerable because the scale has already caused loss of most of their leaves. Butterfly larvae are often protected by ants (Anonymous).
On cultivated plants the butterfly can be controlled by microbial insecticides containing Bacillus thuringiensis kurstaki (Moore). Scientists at the University of Guam are exploring use of injected insecticides (Moore). They have found an egg parasite, but parasitism levels are low. Any biocontrol agent targetting larvae would have to contend with the ants (Anonymous).
A longhorned beetle (Dihammus (Acalolepta) marianarum) and a snail (Satsuma mercatorius) are also feeding on the cycads (Marler 2010).
The Indo-Malayan termite Schedorhinotermes longirostris was detected in 2011. The termites weaken the cycad stems, which are then toppled by feeding by introduced deer. The termites are also damaging the cycad’s reproductive structures (megastrobili). Termite attacks on cycads surprised scientists since cycads do not form true wood. The termite had probably been introduced recently because, as of 2011, it had been detected only near the Andersen Air Force Base airport (Marler, Yudin, and Moore 2011).
More Isolated – but Still Overrun
Scattered across the Pacific are groups of atolls, including Palmyra and Rose.
Despite their distance from other islands, they have all been visited by mariners for centuries. As a result, they have non-native species, including insects that attack trees.
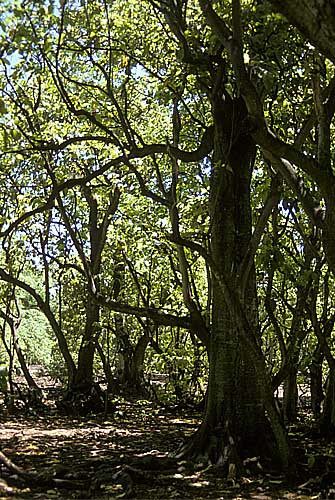
Pisonia tree forest – Wikimedia
The tree most affected is pisonia – Pisonia grandis.
The principal insect is another scale, Pulvinaria urbicola. There are some reports that the scale is farmed by ants; species mentioned include several introduced species such as the yellow crazy ant, Paratrechina longicornis.
The scale is probably from the West Indies. Once it reached the Pacific, it might have been distributed to additional islands on seabirds, which travel long distances between the atolls.
The scale’s impact is unclear.
At first, in the mid-2000s, impacts seemed dire. It was reported to be causing widespread tree death on Palmyra and Rose atolls, islands around northeastern Australia, in the Seychelles, and possibly in Tonga.
However, in 2018, scientists reported that eradication of rats on Palmyra Atoll had resulted in an immediate spurt of reproduction of a tree. Numbers of “native, locally rare tree” seedlings (possibly but not explicitly said to be Pisonia grandis) jumped from 140 pre-eradication to 7,756 post-eradication (in 2016). The study made no mention of the scale.
Rose Atoll has only one small island (6.6 ha) with vegetation. Before 1970, it was dominated by Pisonia grandis, but by 2012, there were only seven trees on the island. Several possible causes of this decline have been suggested. Other than the scale, suggested causes include storms, drought, rising sea level / saltwater incursion, and imbalance of bird guano-derived nutrients in the soil. [All information about Rose Atoll is from Peck et al., 2014)
A survey carried out in April 2012 and November 2013 detected 73 species of arthropods from 20 orders on Rose Island, including nine ant species (all but one non-native). Two of these ants – Tetramorium bicarinatum and T. simillimum – were detected tending the scales on Pisonia.
The survey found no evidence of natural enemies of the Pulvinaria scales.
The scientists tested treatment of Pisonia with the systemic insecticide imidacloprid. This treatment apparently reduced scale populations considerably for several months, but then they began to build up again.
In contrast to Palmyra, Polynesian rats (Rattus exulans) were eliminated from Rose Atoll in 1990–1991 – so their role in destroying the trees had ended 20 years before the study. What does the continued decline of the Pisonia trees in subsequent decades suggest for the future of Pisonia trees on Palmyra?
I have sought updates on the tree-pest situations on Guam and the other Pacific islands, but my queries have not received a reply.
CABI November 2019. Aulacaspis yasumatsui (cycad aulacaspis scale (CAS)) or the Asian cycad scale. https://www.cabi.org/isc/datasheet/18756 (was formerly Commonwealth Agricultural Bureaux (CAB) International; now apparently just uses acronym)
Marler, T.E. pers. comm. August 15, 2012
Marler, T.E. 2010. Cycad mutualist offers more than pollen transport. American Journal of Botany, 2010; 97 (5): 841. Viewed as materials provided by University of Guam, via EurekAlert; accessed 6 August, 2012.
Marler, T., Haynes, J. & Lindstrom, A. 2010. Cycas micronesica. The IUCN Red List of Threatened Species 2010: e.T61316A12462113. http://dx.doi.org/10.2305/IUCN.UK.2010-3.RLTS.T61316A12462113.en Accessed 22 April, 2020.
Marler, T.E., and A. Moore. 2010. Cryptic Scale Infestations on Cycas revoluta Facilitate Scale Invasions. HortScience. 2010; 45 837-839. Retrieved August 6, 2012 from www.eurekalert.org
Marler, T.E. and K.J. Niklas. 2011. Reproductive Effort and Success of Cycas micronesica K.D. Hill Are Affected by Habitat. International Journal of Plant Sciences, 2011; 172 (5): 700. Viewed as materials provided by University of Guam, via EurekAlert; accessed 6 August, 2012.
Peck, R., P. Banko, F. Pendleton, M. Schmaedick, and K. Ernsberger. 2014. Arthropods of Rose Atoll with Special Reference to Ants and Pulvinaria urbicola scales (Hemiptera: Coccidae) on Pisonia grandis trees. Hawaii Cooperative Studies Unit. University of Hawaii. Technical Report HCSU-057 December 2014
vanWilgen, B.W.,J. Measey, D.M. Richardson, J.R. Wilson, T.A. Zengeya. Editors. 2020. Bioinvasions in South Africa. Invading Nature. Springer Series in Invasion Ecology 14.
Posted by Faith Campbell
We welcome comments that supplement or correct factual information, suggest new approaches, or promote thoughtful consideration. We post comments that disagree with us — but not those we judge to be not civil or inflammatory.
For a detailed discussion of the policies and practices that have allowed these pests to enter and spread – and that do not promote effective restoration strategies – review the Fading Forests report at http://treeimprovement.utk.edu/FadingForests.htm These reports do not include details on the pest situation on the Pacific islands (including Hawai`i).
EAB-kiled ash tree in Shenandoah National Park in 2016 photo by F.T. Campbell
As we have known for years, forests of the eastern United States are under severe pressure from non-native forest insects and diseases. Several recent studies have put this fact into perspective.
Fei et al. (2019) found that the 15 most damaging introduced species threaten 41.1% of the total live forest biomass in the 48 conterminous states. Nine of the 15 species included in this calculation are pests of the eastern forest. Indeed, the greatest increase in biomass loss, as measured by USDA Forest Service Forest Inventory and Analysis (FIA) plot data occurred here. Compensatory growth in unaffected trees and the recruitment of new regeneration occurs only later – as much as two or more decades after the pest invasions began. Fei et al. (2019) expect these losses will be exacerbated in the future due in part to the likelihood that additional pests will be introduced.
Randall Morin found that non-native pests had caused approximately 5% increase in total mortality, by tree volume, nation-wide.
Most widespread pest threats in the East
Scientists have used several methods of measuring introduced pests’ impacts. One measure is the number of counties where the pest is present. A second measure is the proportion of the volume of the host that has been affected. Both metrics are used by Morin. A third method, used by the CAPTURE Project (Potter et al. 2019a), is the number of hosts affected by the pest.
Morin and colleagues found that the European gypsy moth has invaded 630 counties – or 29% of the volume of its principal host, oaks. (In both cases, the gypsy moth trailed white pine blister rust in extent of infestation. The latter is nationwide but having its greatest impacts in the West). The CAPTURE Project found that the gypsy moth affected the largest number of hosts – 65.
Using the “counties invaded” metric, Morin and colleagues found that dogwood anthracnose had invaded 609 counties in the East (and additional areas in the West); the emerald ash borer had invaded 479 counties at the time of analysis; the hemlock woolly adelged had invaded 432 counties. Using the number of hosts impacted measure, oak wilt (Bretziella fagacearum) affected the second largest number of hosts – 61 (Potter et al. 2019a). [All these pests are described briefly here.]
Project CAPTURE (Potter and colleagues 2019a) evaluated 339 serious pests threatening one or more of 419 native tree species in the continental US. They included both native and introduced pests. They analyzed 1,378 pest-host combinations. They found that:
54% of the host tree species (228) are infested by an exotic pest – although only 28% of the 1,378 host/agent combinations involved pests are known to be non-native in origin.
Exotic agents have, on average, considerably more severe impacts than native pests.
Non-native pests had greater average severity on angiosperms than on conifers. (As an earlier blog documented, Mech and colleagues have reached a similar – although tentative – conclusion.)
Their estimate of the threat posed by non-native pests to forests – especially for the East – is an underestimate because established pests could spread to additional vulnerable areas and there is a high likelihood that new pests will be introduced. The Southeast was consistently a “coldspot” – despite the near extirpation of one understory tree – redbay.
Potter et al. (2019a) ranked forest threats in two ways. Four host families were at highest risk to alien pests, as measured by both the numbers of tree species affected and by the most host/agent combinations: Fagaceae (oaks, tanoaks, chestnuts, beech); Pinaceae (pines); Sapindaceae (soapberry family; includes maples and buckeye); Salicaceae (willows, poplars, aspens). When host families were ranked by the severity of the host/pest threat, Fagaceae was still at greatest risk, and Sapindaceae was still in the top four; however, Ulmaceae (elms) and Oleaceae (includes Fraxinus) replaced pines and willows.
A very interesting study was published by scientists based in the Blue Ridge Mountains of Virginia (Anderson-Teixeira et al. 2020). They contend that their area is a good example of what is happening more broadly in the Mid-Atlantic region.
Anderson-Teixeira et al. (2020) found that non-native pests have substantially impacted at least 24% of the 33 tree genera (eight genera) recorded as present in their study plots. They estimated that over the century beginning with the appearance of chestnut blight in the region and ending with the expected extirpation of ash trees, net live aboveground biomass (AGB) loss among affected species totaled roughly 6.6–10 kg m -2. Forty to sixty percent of this loss started before the Park initiated quantitative surveys of permanent plots in 1987. The authors estimated that chestnut contributed up to 50% of estimated AGB losses over the century. Consequently, the estimate has very high uncertainty.
Despite these losses, Anderson-Teixeira et al. (2020) found that both total aboveground biomass and diversity within individual study plots had largely recovered through increases in non-vulnerable genera.
Average above ground biomass across the plots established in Shenandoah National Park increased as the forest recovers from logging, farming, and other disturbances before formation of the Park. These increases were due primarily to reproduction and growth of tulip poplar (Liriodendron tulipifera) and growth (but not reproduction) of oaks. Net AGB biomass was lost in oak- and hemlock-dominated plots. At plots established in the neighboring Smithsonian Conservation Biology Institute, pests had caused relatively minor impacts on AGB.
Diversity of tree species also did not change much. In the Park, the average number of genera per plot declined only 3% between 1991 and 2013. Diversity at the landscape scale increased by two genera – from 26 to 28. Many individual plots, though, lost three genera due to non-native pests – chestnut, redbud, and hemlock. A fourth genus was lost due to stochastic change. At the same time, the plots gained six native genera). This finding might be skewed by the short duration of the study period, which missed initial declines in several taxa and captured only the initial stages of decline in ash.
Several taxa were lost from the monitoring plots but were not completely extirpated from the region. Even those species not “lost” suffered elevated mortality rates and steep declines in abundance and above-ground biomass. These declines have not been reversed. The exception was some oaks, which regained above ground biomass, but not abundance, following the gypsy moth outbreak in the 1980s and early 1990s.
Fei et al. (2019) found that losses in biomass due to non-native pests – as measured by FIA plot data – was greatest for ashes, elms, beech trees, and hemlocks..
Morin and colleagues found annual mortality rates had increased three-fold above background levels for ash, beech, and hemlock. They also calculated the present mortality rates for several species for which the majority of loss occurred before their study (consequently, they could not calculate a pre-invasion “background” rate to which present rates could be compared). These included American chestnut (mortality rate of 7%), butternut (mortality rate of 5.6%), and elm trees (mortality rate of 3.5%).
The CAPTURE Project (Potter et al. 2019a) identified fifteen host-agent combinations with the highest severity. Ten of these species are found in the Mid-Atlantic region:
American chestnut (Castanea dentata)
Allegheny chinquapin (C. pumila)
Carolina ash (Fraxinus caroliniana) ,
pumpkin ash (F. profunda)
Carolina hemlock (Tsuga caroliniana)
butternut (Juglans cinerea)
eastern hemlock (Tsuga canadensis)
white ash (Fraxinus americana)
black ash (F. nigra)
green ash (F. pennsylvanica)
Four of these species are in genera included among the eight genera evaluated in the study conducted in the Blue Ridge (Anderson-Teixeira et al. 2020): American chestnut, butternut, eastern hemlock, green and white ash. The four other genera in the Blue Ridge study were elm (Ulmus), oak (Quercus), redbud Cercis, and dogwood (Cornus). All except redbud are recognized by other sources as heavily affected by non-native pests – confirming Anderson-Teixeira et al. (2020)’s conclusion that findings on the Blue Ridge reflect the wider situation.
Anderson-Teixeira et al. (2020) note that several of these tree species have been declared imperiled by the International Conservation Union (IUCN): American chestnut, butternut, American elm, eastern hemlock, and ash species.
Anderson-Teixeira et al. (2020) report data on three taxa previously important in the canopy of Blue Ridge forests – chestnut, elms, and butternut. Chestnuts larger than 10 cm DBH had disappeared from the future site of Shenandoah National Park by 1910. Short-lived sprouts continue to be present in plots in the low-elevation Smithsonian Conservation Biology Institute. Two elm species were described as ‘‘sparse’’ in the 1939 qualitative survey. Elms have persisted at low densities, low biomass, and increasingly small sizes. Butternut was ‘‘common’’ in 1939, but had disappeared from Shenandoah NP by 1987. On the Smithsonian’s property, butternut declined from four living individuals in 2008 to two in 2018. The near disappearance of butternut reflects the national picture: FIA data show the species has decreased about 58% across its U.S. range since the 1980s – which is decades after butternut canker started having a detectable impact in the Midwest.
In the Park, oak-dominated plots lost on average 24.9% of individuals and 15% of aboveground biomass. After 1995, when the gypsy moth was better controlled by spraying of Bacillus thuringiensis var. curstaki, oak aboveground biomass increased gradually, driven by individual tree growth rather than new recruitment. Continued declines in oak abundance are attributable to oak decline and management actions (or inactions) that do not promote regeneration.
In a separate study, a group of oak experts went through a process of queries to identify the greatest threat to oaks now and in the future (Conrad et al. 2020). They initially identified the following threats as most important currently (descending order): gypsy moth, oak wilt, oak decline, climate change, and drought. The top five future threats were initially identified as climate change, oak wilt, sudden oak death, oak decline, and some unknown new or emerging (non-native) pest or pathogen. By the third round, after the experts thought about their colleagues’ responses, oak decline had replaced gypsy moth as the most critical threat currently. Attack by an unknown new or emerging (non-native) pest or pathogen replaced climate change as the most critical future threat. While there was not a complete consensus, the consensus was stronger on the threat from a new pest.
remnant eastern hemlock at Linderlost, Shenandoah National Park photo by F.T. Campbell
Anderson-Teixeira et al. (2020) reported that eastern hemlock was initially present in ten of Shenandoah plots, but was no longer recorded in the survey plots after 2007. (More than 20,000 insecticide-treated trees remain alive throughout Shenandoah NP).
Before arrival of the emerald ash borer, ash aboveground biomass was increasing in Shenandoah NP and stable on the Smithsonian Institute. EAB-caused mortality was first detected at the Smithsonian site in 2016 and accelerated steeply thereafter, exceeding 12.5% year by 2018. As of 2019, ash had lost 28% of individuals and 30% of aboveground biomass relative to 2016. Ninety-five percent of remaining live trees were considered “unhealthy’’ (Anderson-Teixeira et al. 2020).
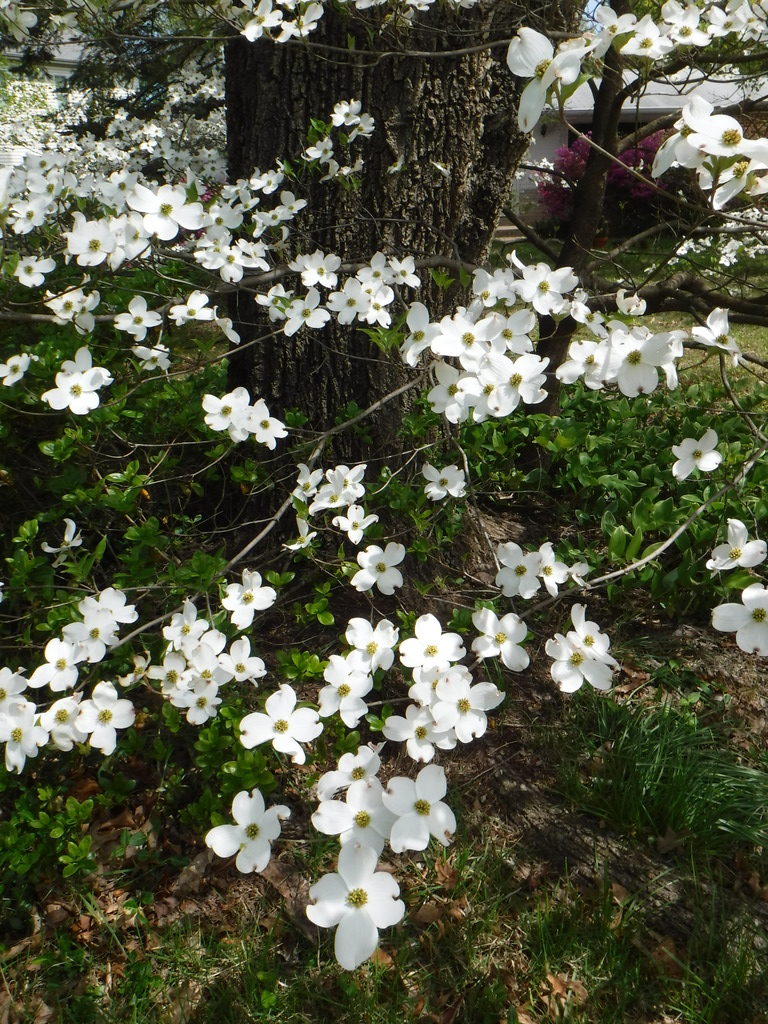
eastern (flowering) dogwood; photo by F.T. Campbell
Unlike many studies, the Shenandoah study included understory species. Flowering dogwood declined by up to 90% from plots on the Smithsonian property; 2008–2019 mortality rates averaged 7.1%. Redbud declined by up to 76% from 1995 to 2018. The 2008–2019 mortality rates averaged 6.2% year.
Anderson-Teixeira et al. (2020) concede difficulty in estimating mortality due to less virulent or lethal pathogens, including Neofusicoccum spp. on redbud and Dutch elm disease on slippery elm.
Nevertheless, they believe their analysis probably underestimates the overall pest impacts because they did not analyze several other pest/host combinations known to be present in the Park: balsam woolly adelgid (Adelges piceae) on high-elevation populations of Abies balsamea; white pine blister rust (Cronartium ribicola) on eastern white pine (Pinus strobus); beech bark disease (Neonectria spp.) on American beech (Fagus grandifolia); thousand canker disease on walnut and butternut; and emerald ash borer on the novel host fringetree Chionanthus virginicus.
Another possible threat to oaks, winter moth (Operophtera brumata), is apparently now being controlled by the biocontrol agent Cyzenis albicans.
I am uncertain about the current status of two Diplodia fungi – Diplodia corticola and D. quercivora – link to blog which have been detected in both Florida and California. In Florida, almost all the symptomatic trees grow in cultivated settings where they are exposed to various stresses (Mullerin and Smith 2015).
However, host range studies indicate that 33 species of oaks and one species of chestnut that grow in the Southeast are vulnerable, to varying degrees, to D. corticola. Oaks in the red oak group (Section Lobatae) are more vulnerable than are white oaks (Section Quercus) (Mullerin and Smith 2015). In the test, the most vulnerable appear to be the following species native to the Southeast: Q. laurifolia, Q. virginiana, Q. geminata, Q. chapmanni, Q. laevis (turkey oak), Q. phellos, Q. pumila, and Q. incana (Dreaden et al. 2016).
What should we do?
Fei et al. (2019) noted that the losses to biomass would be exacerbated by the likely introduction of additional pests. They did not recommend any prevention actions.
Conrad et al. (2020) said their findings “lend support to national regulatory and awareness efforts to prevent the introduction and establishment of novel exotic insects and pathogens.”
Anderson-Teixeira et al. (2020) join others in declaring that future survival of the IUCN-listed species probably depends on conservation and restoration actions. They cite several sources, but not the CAPTURE Project – although the two studies reinforce each other. They specifically mention limiting invasive species’ spread through strengthened regulations and “enhanced plant biosecurity cyberinfrastructure”.
This last recommendation reinforces the message of Bonello et al. (2019) link to publication. We called for creation of a federal Center for Forest Pest Control and Prevention to implement end-to-end responses to forest pest invasions. One focus would be correcting the currently-inadequate focus on detection, development and deployment of genetic resistance while using modern techniques that allow for much faster breeding cycles.
Posted by Faith Campbell
We welcome comments that supplement or correct factual information, suggest new approaches, or promote thoughtful consideration. We post comments that disagree with us — but not those we judge to be not civil or inflammatory.
For a detailed discussion of the policies and practices that have allowed these pests to enter and spread – and that do not promote effective restoration strategies – review the Fading Forests report at http://treeimprovement.utk.edu/FadingForests.htm
SOURCES
Anderson-Teixeira, K.J., V. Herrmann, W.B. Cass, A.B. Williams, S.J. Paull, E.B. Gonzalez-Akre, R. Helcoski, A.J. Tepley, N.A. Bourg, C.T. Cosma, A.E. Ferson, C. Kittle, V. Meakem, I.R. McGregor, M. N. Prestipino, M.K. Scott, A.R. Terrell, A. Alonso, F. Dallmeier, and W.J. McShea. Date? Long-Term Impacts of Invasive Insects and Pathogens on Composition, Biomass, and Diversity of Forests in Virginia’s Blue Ridge Mountains. Ecosystems
Bonello, P. , F.T. Campbell, D. Cipollini, A.O. Conrad, C. Farinas, K.J.K. Gandhi, F.P. Hain, D. Parry, D.N. Showalter, C. Villari, and K.F. Wallin. 2019. Invasive tree pests devastate ecosystems – A proposed new response framework. Frontiers
Conrad, A.O., E.V. Crocker, X. Li, W.R. Thomas, T.O. Ochuodho, T.P. Holmes, and C. D. Nelson. 2020. Threats to Oaks in the Eastern US: Perceptions and Expectations of Experts. Journal of Forestry, 2020, 14–27
Dreaden, Black, Mullerin, and Smith. Poster presented at the 2016 USDA Invasive Species Research Forum
Fei, S., R.S. Morin, C.M. Oswalt, and A.M. Liebhold. 2019. Biomass losses resulting from insect and disease invasions in United States forests. Proceedings of the National academy of Sciences.
Guo, Q., S. Feib, K.M. Potter, A.M. Liebhold, and J. Wenf. 2019. Tree diversity regulates forest pest invasion. PNAS. www.pnas.org/cgi/doi/10.1073/pnas.1821039116
Morin, R.S., K.W. Gottschalk, M.E. Ostry, A.M. Liebhold. 2018. Regional patterns of declining butternut (Juglans cinerea L.) suggest site characteristics for restoration. Ecology and Evolution.2018;8:546-559
Morin, R. A. Liebhold, S. Pugh, and S. Fie. 2019. Current Status of Hosts and Future Risk of EAB Across the Range of Ash: Online Tools for Broad-Scale Impact Assessment. Presentation at the 81st Northeastern Forest Pest Council, West Chester, PA, March 14, 2019
Mullerin, S. & J.A. Smith. 2015. Bot Canker of Oak in FL Caused by Diplodia corticola & D. quercivora. Emergent Pathogens on Oak and Grapevine in North America. FOR318
Potter, K.M., M.E. Escanferla, R.M. Jetton, and G. Man. 2019a. Important Insect and Disease Threats to United States Tree Species and Geographic Patterns of Their Potential Impacts. Forests. 2019 10 304.
Potter, K.M., M.E. Escanferla, R.M. Jetton, G. Man, and B.S. Crane. 2019b. Prioritizing the conservation needs of United States tree species: Evaluating vulnerability to forest insect and disease threats. Global Ecology and Conservation. (2019)
Dream Lake, Rocky Mountain National Park, with limber pine photo by F.T. Campbell
In this blog, I summarize two pest threats to the unique ecosystems on high-elevation mountain ridges in the West. At risk are several keystone tree species: the five-needle pines growing at high elevations (“high-five” pines) and subalpine fir. The invasive species causing this damage – white pine blister rust (WPBR; Cronartiumribicola) and balsam woolly adelgid (BWA; Adelges piceae) – are two of the most widespread non-native species threatening North American trees and affecting the highest proportion of host volumes (Morin).
The pines being killed by white pine blister rust are whitebark pine (Pinus albicaulis), limber pine (P. flexilis), Rocky Mountain bristlecone pine (P. aristata), foxtail pine (P. balfouriana), and southwestern white pine (P. flexilis var. reflexa). As of 2010, infestations had not been reported on Great Basin bristlecone pine (P. longaeva) and the Mexican white pine species. [Unless otherwise indicated, information on white pine blister rust is from a comprehensive review and synthesis published in the August 2010 issue of Forest Pathology (Vol. 40:3-4).]
As noted above, sub-alpine fir (Abies lasiocarpa) is also being affected – although less uniformly than the pines – by the balsam woolly adelgid.
Both of these pests arrived approximately a century ago, but they are still spreading and causing additional damage. White pine blister rust had spread widely throughout the West within 40 years of its introduction. Meanwhile, BWA spread among lowland and subalpine firs along the Pacific coast from California to British Columbia within 30 years of its first detection. Its spread eastward was slower, but relentless. It reached Idaho, Montana, Utah and interior British Columbia within 50 years. Also, BWA reached Alaska within 90 years of its introduction in California. These pests are perfect examples of how invasive species introduced long ago are dreaded “gifts that keep on giving”.
For a detailed discussion of these pests’ impacts, see the descriptions posted here. To summarize, though, WPBR is present in the ranges of eight of the nine vulnerable western white pines and has caused severe mortality to some species (Sniezko et. al. 2011). For example, 88% of the limber pine range in Alberta is affected (Dawe et al. 2020). WPBR is generally causing more damage to its hosts’ northern populations. Impact of the BWA are more subtle than WPBR. Also, impacts’ severity is linked to climatic conditions. For example, measurable decline on the Olympic Peninsula was greater on south-facing slopes. However, the study did not determine whether this reflected heat-loading and tree stress or more abundant subalpine fir on these slopes. An estimated 19-53% (average 37%) of subalpine fir trees had died on sample plots on one ridge over the 19 years since BWA was first detected there. Overall forest growth after 2007 could indicate partial recovery, a momentary pause in BWA invasion, or tree growth after severe weather events (Hutton 2015).
Ranges of Trees at Risk
Many of the host trees of these two pests are widespread; others are more narrowly endemic.
Limber pine reaches from Alberta and British Columbia south to mountain peaks in Arizona and New Mexico. Whitebark pine is found from Alberta and British Columbia to California and Nevada (USDA Plants database. Subalpine fir stretches from southeast Alaska along the Canadian Rockies coast into Washington, Oregon, east into Idaho, Montana, Wyoming, Colorado, Utah, even into scattered mountain ranges of Nevada and New Mexico (Hutton 2015).
Limber pine and subalpine fir are also found in a wide range of ecosystems within these ranges. Limber pine is found at both upper and lower tree lines in grassy, open forests; on exposed rocky slopes; and in dense, mixed-conifer stands. Subalpine fir is a pioneer species on ridges, alpine meadows, avalanche chutes, and lava beds (Ragenovich and Mitchell, 2006).
Before arrival of non-native pests or pathogens, these tree species have persisted for thousands of years under harsh conditions (Hutton 2015). Many of the individual trees were long-lived; some five-needle pines, e.g., bristlecone pines, have famously live for thousands of years. Core studies demonstrated that subalpine firs trees could live 272 years in the forests of Olympic National Park and 240 years in Glacier National Park (Hutton 2015). Surely loss of these trees – or even their conversion from large and old to small and short-lived – will result in significant destruction of these unique biomes.
All these trees play important roles in high altitude, unique ecosystems (Pederson et al. no date; Dawe 2020; Hutton 2015):
They retain ground water, slow the rate of snow melt, and maintain stream flow characteristics and water quality;
They curtail soil erosion and maintain slope stability; and
They provide high-value food and shelter to wildlife.
Whitebark and limber pines are famous for providing critical food for many wildlife species at high elevations —notably bears and nutcrackers (Compendium and Dawe 2020).
More Pest Threats
Other diseases, insects, and disturbances also pose serious threats to these tree species. The threats vary by region and age of the stand. They include – for the pines — mountain pine beetle (Dendroctonus ponderosae), dwarf mistletoe (Arceuthobium spp.), and various shoot, cone or foliage insects and pathogens. For subalpine fir, threats include western balsam bark beetle (Dryocoetes confusus), fir engraver (Scolytus ventralis), and the fir root bark beetle (Pseudohylesinus granulatus) (Hutton 2015). Trees are also damaged by bear and deer, seed predation by squirrels, wildfire, and biotic succession.
On Washington’s Olympic Peninsula, BWA initiates or predisposes subalpine fir for a novel disturbance complex. BWA-caused stress makes the trees more susceptible to moisture stress and endemic bark beetle attack. Surviving trees are subsequently subject to toppling by wind. A tree can die in a few years, survive with insects for up to 20 years, or recover, depending on duration, severity, and location of infestation, and local environmental conditions (Hutton 2015).
BWA study plots in the Cascade Range experienced subalpine fir mortality ranging from 7 to 79% (measured as stem counts, not basal area) over a 19 to 38 years study period. Higher mortality occurred at low-elevation, mesic sites. One stand experienced 40% mortality in 19 years, but lost the remaining 60% during a subsequent spruce budworm infestation. Most plots continued to show sporadic signs of adelgid presence and continued tree mortality. However, 41-69% of trees survived stem infestations (Hutton 2015).
How to Protect These Ecosystems
The seeds of both whitebark and limber pines are dispersed to newly disturbed, open areas by Clark’s nutcracker (Nucifraga columbiana). Furthermore, whitebark cones open to release seeds only after fire. This had led to expectations that prescribed fire could promote regeneration of these species. However, studies by Dawe (2020) and other have found that nutcracker seed caching behavior and seedling establishment are complex. Fire management might have to vary among regions, demanding consideration of stand characteristics,like openness and the presence of other tree species. For example, in the Colorado Front Range, limber pine can be replaced by subalpine fir when fire-free intervals are long. On the other hand, in Alberta, fire appeared to boost regeneration of the dominant tree species in the stands pre-fire. In the study areas, these were white spruce (Picea glauca) and lodgepole pine (Pinus contorta) (Dawe 2020). Dawe recommends protecting existing stands of limber pine through fire mitigation efforts, e.g., thinning and other fuel treatments, and supplementary planting of seedlings.
Efforts to find biocontrol agents to target the balsam woolly adelgid began in 1957; the original focus was on the insects’ damage to Fraser fir (Abies fraseri) in the southern Appalachians. More than 25 predatory species have been introduced from Europe and Asia. There was simultaneous research on native predators. None has had an impact on BWA populations in either the East or the West.
Neither white pine blister rust nor balsam woolly adelgid is considered a quarantine pest by federal officials, so there is no attempt to prevent their movement via interstate trade in Christmas trees, timber, or nursery stock. Hutton (2015) hypothesizes that the absence of regulatory measures targetting BWA arises from the pest’s gradual effect and the hosts’ not being commercially important as timber species (although several firs are important in horticulture and as Christmas trees). I think another factor is that the pests were introduced so long ago and are now widespread.
Efforts are under way to detect resistant genotypes to be used in breeding programs. Several of the lower-elevation five-needle pines vulnerable to WPBR have benefitted from extensive breeding efforts Whitebark pine has more recently been added to programs.
The eastern Fraser fir is the target of breeding – primarily for Christmas trees (APS). However, at least small-scale volunteer efforts have been carried forward by the Alliance for Saving Threatened Forests.
Hutton (2015) expresses hope that evolutionary pressure by BWA might enhance survival of more resistant forms of subalpine fir and lead to their gradual takeover. However, I ask, why leave it to chance?
In this context, I remind you of my involvement with a group (see Bonello et al. 2019) proposing creation of a federal Center for Forest Pest Control and Prevention to implement end-to-end responses to forest pest invasions – including overcoming the currently inadequate focus on detection, development and deployment of genetic resistance using modern techniques that allow for much faster breeding cycles.
I am puzzled that the Project CAPTURE places whitebark pine and subalpine fir only in Class A4.2, not among the highest priority species (Potter et al. 2019). As I blogged last spring, Project CAPTURE is part of a multi-partner effort to categorize and prioritize US tree species for conservation actions based on the threats and the trees’ ability to adapt to those threats. I find it puzzling because I am not sure I agree that these two species have a moderately high mean pest severity score – as required by the category. I am less puzzled by the assignment of a low adaptive capacity score.
Limber pine apparently ranks even lower in the Project CAPTURE priority process.
Posted by Faith Campbell
We welcome comments that supplement or correct factual information, suggest new approaches, or promote thoughtful consideration. We post comments that disagree with us — but not those we judge to be not civil or inflammatory.
For a detailed discussion of the policies and practices that have allowed these pests to enter and spread – and that do not promote effective restoration strategies – review the Fading Forests report at http://treeimprovement.utk.edu/FadingForests.htm
SOURCES
A comprehensive review and synthesis of the history, ecology, and management of white pines threatened by white pine blister rust see the August 2010 issue of Forest Pathology (Vol. 40:3-4).
Bonello, P. , F.T. Campbell, D. Cipollini, A.O. Conrad, C. Farinas, K.J.K. Gandhi, F.P. Hain, D. Parry, D.N. Showalter, C. Villari, and K.F. Wallin. 2019. Invasive tree pests devastate ecosystems – A proposed new response framework. Frontiers
Dawe, D.A., V.S. Peters, M.D. Flannigan. 2020. Post-fire regeneration of endangered limber pine (Pinus flexilis) at the Northern extent of its range. Forest Ecology and Management 457 (2020) 117725
Hutton, K.M. 2015. A dissertation submitted in partial fulfillment of the requirements for the degree of Doctor of Philosophy. University of Washington. Available here
Morin, R. Presentation to the 81st Northeastern Forest Pest Council Northeastern states forst agencies, Philadelphia, Pennsylvania, March 2019.
Potter, K.M., Escanferla, M.E., Jetton, R.M., Man, G., Crane, B.S. 2019. Prioritizing the conservation needs of US tree spp: Evaluating vulnerability to forest P&P threats, Global Ecology and Conservation (2019), doi: https://doi.org/10.1016/
Sniezko, R.A., M.F. Mahalovich, A.W. Schoettle, D.R. Vogler. 2011. Past and Current Investigations of the Genetic Resistance to Cronartium ribicola in High-elevation Five-needle Pines. In Keane, R.F., D.F. Tomback, M.P. Murray, and C.M Smith, eds. 2011. The future of high-elevation, five-needle white pines in Western North America. Proceedings of the High Five Symposium. 28-30 June, 2010. Missoula, MT.
The California Department of Food and Agriculture (CDFA) is seeking comments on the appropriate pest rating for Leptosillia pistaciae, a recently discovered fungus that causes pistachio canker.
The
Department’s draft pest ranking assigns the highest Economic Impact score –
three. It assigns a medium Environmental Impact – two. This is because the
pathogen can kill an important native shrub, with possible follow-on
consequences of reduced biodiversity, disrupted natural communities, or changed
ecosystem processes.
CDFA
states that there is no uncertainty in its evaluation, but I see, and describe
here, numerous questions about the possible true extent of the invasion and
possible host range.
Comments are due
on April 4, 2020.
The
pathogen was detected in June 2019, when a habitat manager from an ecological
reserve in San Diego County noticed multiple dead lemonade berry shrubs (Rhus integrifolia) in one of the parks.
This is the first known detection of Leptosillia
pistaciae in the United States and on this host. USDA APHIS has classified Leptosillia pistaciae as a federal quarantine
pest. Rhus and Pistacia are in the same family, Anacardiaceae (cashews and sumacs).
According
to the CDFA, Leptosillia pistaciae is
the only member of this fungal genus known to be associated with disease
symptoms on plants. Other species are endophytes or found in dead plant
tissues. [It is not at all unusual for fungal species to be endophytes on some
plant hosts but pathogenic on others. A California example is Gibberella
circinata (anamorph Fusarium circinatum), which causes
pitch canker on Monterey pine (Pinus
radiata) but is an endophyte on various grass species (Holcus lanatus and Festuca
arundinacea).]
(Reminder: this is the second new pest of native species detected in California state in 2019; I blogged about an ambrosia beetle in Napa County here. )
Rhus integrifolia (lemonade berry
or lemonade sumac) is native to California. It grows primarily in the south, along
the coast – from San Diego to San Luis Obispo. However, some populations are
also found in the San Francisco Bay area. This and other sumacs are also sold
in the nursery trade.
On
pistachio trees in Italy, symptoms are observed in the winter and late spring. During
the winter dormant season, trees had gum exudation and cracking and peeling of
bark on trunks and branches. On trunks and large branches, cankers appeared
first as light, dead circular areas in the bark; subsequently they became
darker and sunken. Under the bark, cankers were discolored with necrotic
tissues; in some cases, these extended to the vascular tissues and pith. During
the active growing season, the symptomatic plants also showed canopy decline.
Inflorescences and shoots, originating from infected branches or twigs, wilted
and died. When the trunk was girdled by a canker, a collapse of the entire tree
occurred.
range map for Rhus integrifolia
On
lemonade berry, large clumps of dead
adult shrubs were observed on the edge of hiking trails. Some shrubs that had completely
dead foliage were re-sprouting from their bases. Trunks of shrubs that were not
completely dead were copiously weeping sap and fluids and showed foliage
browning and die back with symptoms of stress.
It
is thought that spores could be spread by wind, rain splashing, and the
movement of dead or dying trees, greenwaste, and infected nursery stock. Contaminated
pruning tools might also transport the spores. The possibility of a latent
phase – or perhaps asymptomatic hosts – adds to the probability of
anthropomorphically assisted spread.
I question how much effort has been put into detection surveys, especially in natural systems with native Rhus species. California has three other native sumacs: R. ovata, R. aromatica, and Malosma laurina (CNPS; full citation at the end of the blog). In addition, there are numerous other species in the family, including poison oaks (Toxicodendron spp.) and the widespread invasive plant genus Schinus.
Furthermore, some plants in the family (other than pistachios) are grown for fruit or in ornamental horticulture, including two of the native sumacs and two non-native species, Rhus glabra and R. lanceolata, cashew, mango, and smoke trees (Cotinus spp.).
Yet
CDFA confidently states that there are only two hosts and that it has been
detected in only one population – that in San Diego. This is because CDFA
considers only official records identified by a taxonomic expert and supported
by voucher specimens.
CDFA
states that the pathogen is likely to survive in all parts of the state where
pistachios are grown – primarily in the Central Valley. California supplies 98%
of the pistachios grown in the United States; the remainder is raised in
Arizona and New Mexico. California production occurred on 178,000 acres in
2012. A map is included in a flyer on production available at the url listed at
the end of this blog.
In
discussing spread potential, no mention is made of possible human-assisted
spread.
The CDFA document includes instructions for submitting comments; the deadline is April 4.
Sources:
Rhus and related
species native to California: California Native Plant Society
We welcome comments that supplement or correct factual information, suggest new approaches, or promote thoughtful consideration. We post comments that disagree with us — but not those we judge to be not civil or inflammatory.