In August I blogged that import volumes had crashed … US imports from Asia declined each month from January through June (Mongelluzzo Dec 14; full citations at end of blog). However, the economic rebound over the summer brought a surge in imports that continues. Given our concern about introductions of tree-killing pests, it is not good news that imports from Asia are driving the growth in imports.
US imports from Asia during the first 11 months of 2020 were 2% higher than the figure from the first 11 months of 2019. In November alone, the U.S imported 1.6 million TEUs [twenty-foot equivalent units; a standard measurement that counts incoming volume as though contained in twenty-foot-long containers] worth of goods from Asia. Imports in December are projected to remain high (Mongelluzzo Dec 14; full citation at end of blog).
Imports from Asia were 1.626 million TEU in December – up 29.9% from December 2019 (although still lower than October and August). December imports were pushed by record e-commerce sales and shipments of personal protective equipment (PPE) and medical supplies. For all of 2020, imports from Asia totaled 16.6 million TEU, up 4.1% from 2019 (Mongelluzzo Jan. 19)
This surge in imports – which began in late June — is certain to continue at least for the next two months as retailers ship more merchandise before some factories in Asia close for the Lunar New Year (Mongelluzzo Jan 19).
Because of the history of tree-killing pests introduced from Asia, I have blogged most often about the situation at West Coast ports. However, in 2020 there has been a noticeable shift to East and Gulf Coast ports because of the congestion and delays at West Coast ports. Thus, in November 2020, West Coast ports handled 60.2% of imports from Asia; East Coast ports handled 33.7%; Gulf Coast ports handled 5.7%. The East Coast figure is 30% higher than over the same period in 2019. At New York-New Jersey specifically, the increase was 35.1% (Mongelluzo Dec 16). Imports to Gulf Coast ports continue to rise; Gulf Coast ports handled only 4.8% of total US imports from Asia during the first nine months in 2019 and less than 3% before the widening of the Panama Canal (in 2016) (Angell October 28). Link to blog #203 midNov (In future, goods shipped from Asia across the Arctic Ocean to the U.S. east coast could add to the pest risk confronting our already hard-hit Eastern Deciduous Forest.)
Pacific Coast Ports
According to Mongelluzzo (December 9), the Los Angeles-Long Beach port complex (LA-LB) set records for US imports from Asia in August and again in October. The port complex handled 2.5 million TEU of imports from Asia in the three-month period of August through October. Despite shippers’ concern about delays, LA-LB is expected to continue to handle the bulk of Asian goods entering the country in coming months.
The ports of Los Angeles-Long Beach handle 50% of US imports from Asia. From July 2020 through February 2021, these ports received an average of 791,838 TEU each month – a 23% increase over the 2019 average of 642,000 TEU per month (Mongeluzzo April 2021).
Ports in the Southeast
As reported by Ashe (December 10), several ports in the southeast US are seeing record import volumes caused by retailers’ restocking, e-commerce, and Christmas shopping. November import volumes hit all-time highs in Savannah and Port of Virginia, while they were up year over year in Charleston. The three port authorities say the surge is the result of demand for furniture, bedding, refrigerators, freezers, and air conditioners – reflecting Americans’ current focus on improving their homes. Imports also include artificial Christmas trees (which have been a vector of pests in the past – as has furniture).
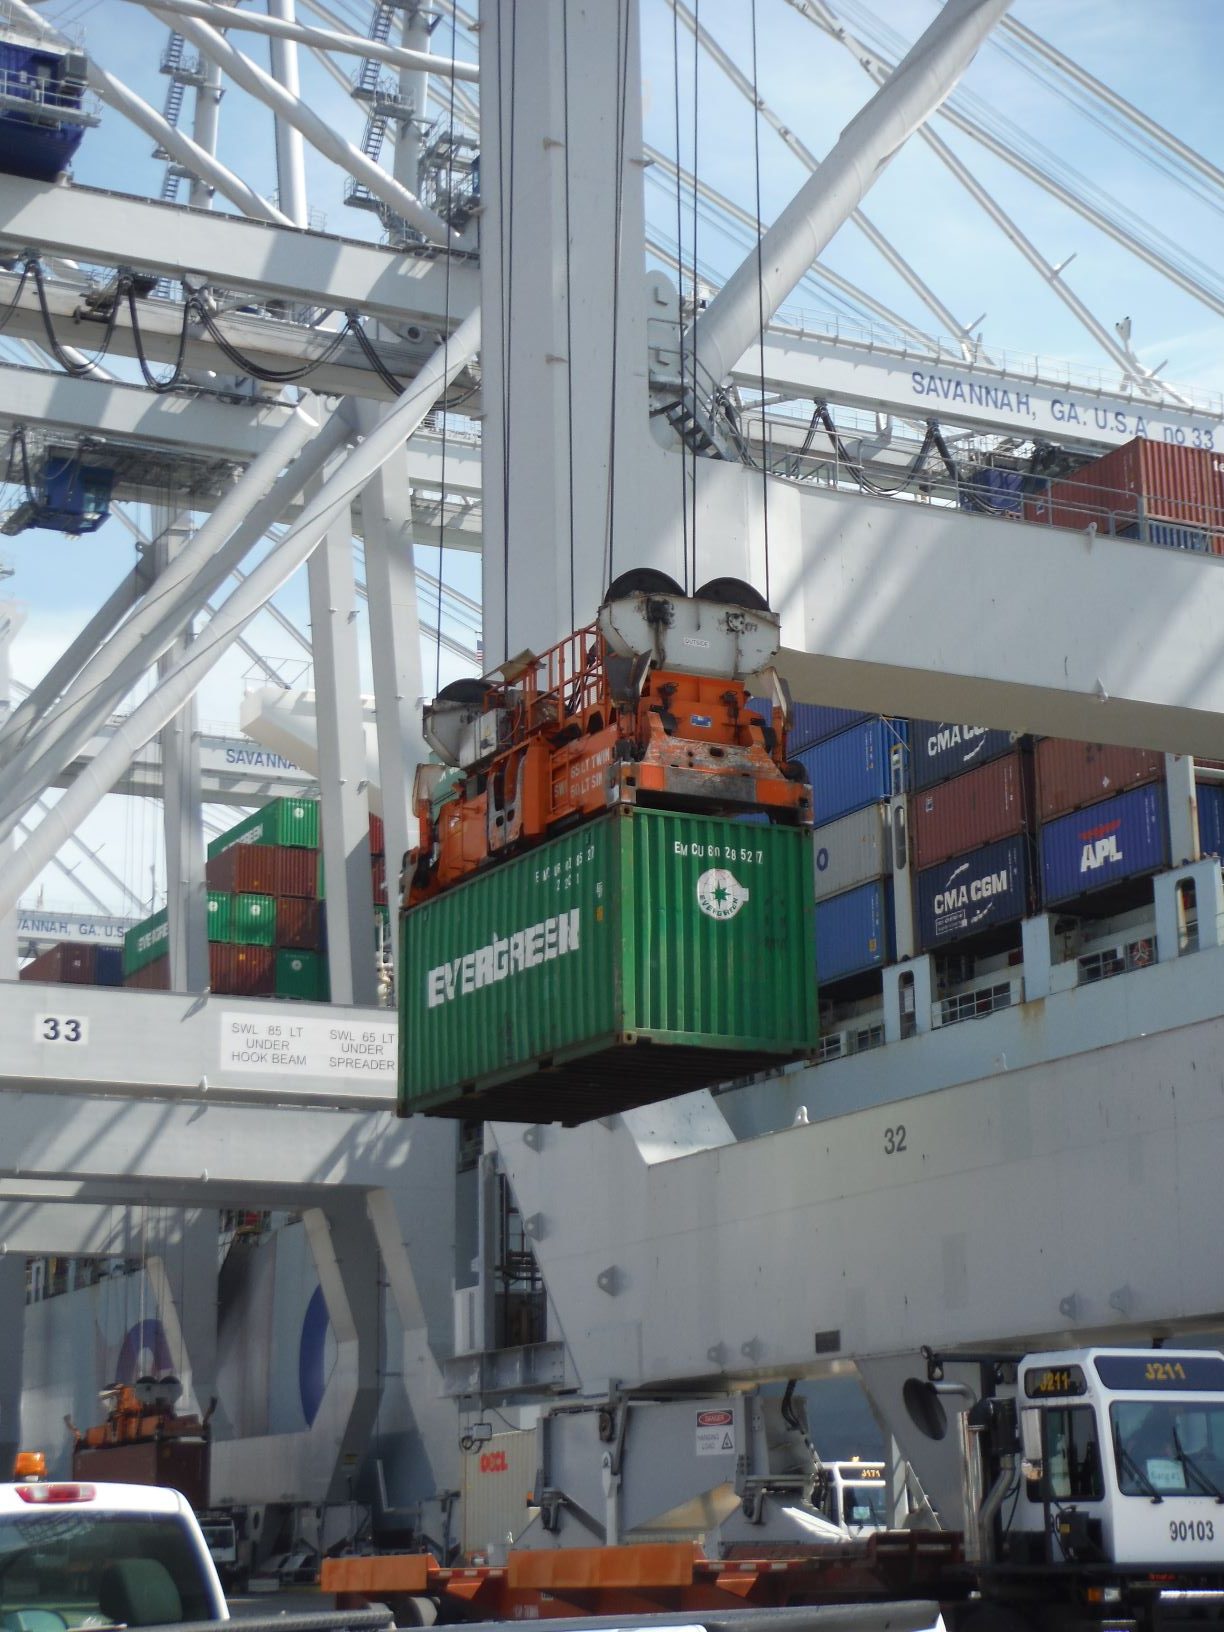
The volume of imports into Savannah from all sources surged 34% over the November 2019 volume. Imports from Asia rose 36%. Imports of furniture rose 42% in August and September. “Hardware, home goods, machinery, and appliances from Asia were up double digits,” according to Georgia Port Authority CEO Griff Lynch. Import volumes from Asia rose 36% in Virginia and 32% in Charleston.
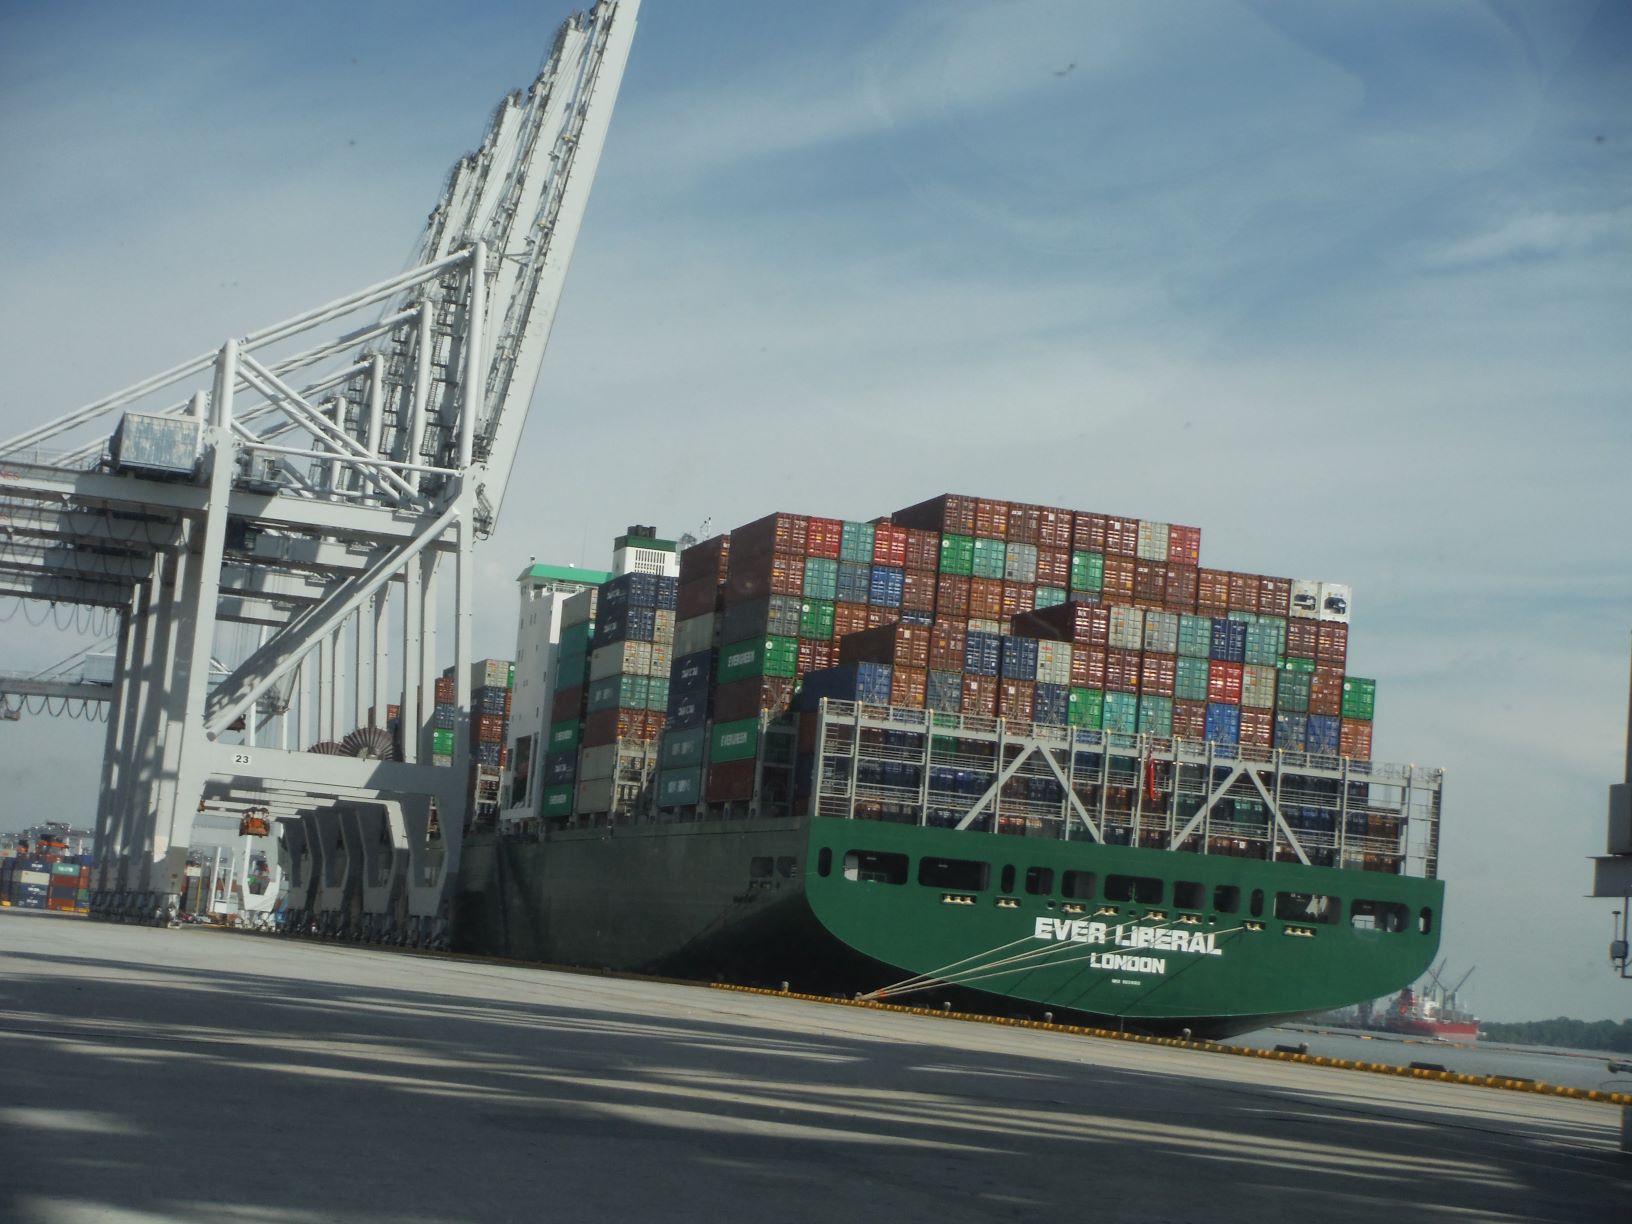
Vessels Carry More Containers
Another threat of increased pest introductions arises from the increasing size of container ships. Increasing proportions of vessels with the capacity to carry more than 10,000 containers are arriving. Since 2010, the proportion of such ships arriving at West Coast ports has risen from 1.1% to 75.5%. The proportion arriving at East Coast ports has grown since the opening of the widened Panama Canal in 2017. The proportion of high-capacity ships visiting East Coast ports has risen from 3% in 2017 to 15% during the first 10 months of 2020. Gulf Coast ports receive few such vessels because the serve a smaller share of the U.S. market. The largest ships serve the trade from Asia primarily (Mongelluzzo Dec. 21, 2020). Of course, arrival of ten to fifteen thousand containers at once surely strains Custom’s inspection staff.
Imports from Geographic Regions Other Than Asia
Imports (from all sources) through New York and New Jersey ports were 22% percent higher in October 2020 than in October 2019 (Angell November 10). As noted above, most of the higher volume of imports originated in Asia.
According to Journal of Commerce staff (November 30), containerized imports from the Caribbean and Central America grew a negligible 0.1% over the same period last year. Principal ports for this trade are in Florida and along the Gulf Coast, but include Wilmington, DE, and Philadelphia.
According to JOC staff (November 2), containerized cargo import volumes from all regions flowing through the busiest US Gulf Coast ports declined 2.3% in the first seven months of 2020 compared to the same period in 2019.
Non-containerized cargoes — i.e., dry bulk, liquid bulk, roll-on/roll-off (ro-ro), and oversized/heavy-lift freight — are not included in these data. Dry bulk cargo through Houston has been reported to suffer problems in infested dunnage (wood used to brace non-containerized cargo, such as steel beams). Link to blog 173 February 2020
SOURCES
Angell, M. US Gulf pulls more Asian imports amid West Coast congestion Oct 28, 2020 https://www.joc.com/port-news/us-ports/us-gulf-pulls-more-asian-imports-amid-west-coast-congestion_20201028.html
Angell, M. Railroads send railcars to NY-NJ as import pressure mounts Nov 10, 2020 https://www.joc.com/port-news/us-ports/railroads-send-railcars-ny-nj-import-pressure-mounts_20201110.html?utm_campaign=CL_JOC%20Port%20Newsletter%2011%2F18%2F20%20-%20With%20R__e-production_E-81883_AK_1118_1200&utm_medium=email&utm_source=Eloqua
Ashe, A. Import surge at Southeast ports tightens chassis availability Dec 10, 2020 https://www.joc.com/port-news/us-ports/southeast-closing-out-2020-surging-volumes_20201210.html?utm_source=Eloqua&utm_medium=email&utm_campaign=CL_JOC%20Daily%20Newswire%2012%2F11%2F2020__e-production_E-84440_KB_1211_0617
JOC Staff JOC Rankings: Resins buoy US Gulf Coast ports during COVID-19 Nov 02, 2020 https://www.joc.com/port-news/us-ports/joc-rankings-resins-buoy-us-gulf-coast-ports-during-covid-19_20201102.html?utm_source=Eloqua&utm_medium=email&utm_campaign=CL_JOC%20Daily%20Newswire%2011%2F3%2F2020%20__e-production_E-80030_TF_1103_0617
JOC Staff. JOC Rankings: US–Carib/Central America trade tumbles in 2020 Nov 30, 2020 https://www.joc.com/maritime-news/joc-rankings-slowing-us%E2%80%93caribcentral-america-trade-tumbles-2020_20201130.html?utm_campaign=CL_JOC%20Port%20Newsletter%2012%2F2%2F20%20__e-production_E-83092_TF_1202_0900&utm_medium=email&utm_source=Eloqua
Mongelluzzo, B. Import deluge fills LA-LB terminals to capacity Dec 09, 2020 https://www.joc.com/port-news/us-ports/import-deluge-fills-la-lb-terminals-capacity_20201209.html?utm_source=Eloqua&utm_medium=email&utm_campaign=CL_JOC%20Daily%20Newswire%2012%2F10%2F2020__e-production_E-84332_KB_1210_0617
Mongelluzzo, B. Asia-US import surge slowing slightly, but spreading to East, Gulf coasts Dec 14, 2020 https://www.joc.com/maritime-news/container-lines/asia-us-import-surge-slowing-slightly-spreading-east-gulf-coasts_20201214.html?utm_source=Eloqua&utm_medium=email&utm_campaign=CL_JOC%20Daily%20Newswire%2012%2F15%2F2020__e-production_E-84893_KB_1215_0617
Mongelluzzo, B. US East Coast ports avoid gridlock despite rising volumes. Dec 16, 2020. https://www.joc.com/port-news/us-ports/us-east-coast-ports-avoid-gridlock-despite-rising-volumes_20201216.html?utm_source=Eloqua&utm_medium=email&utm_campaign=CL_JOC%20Daily%20Newswire%2012%2F17%2F2020__e-production_E-85162_KB_1216_2139
Mongelluzzo, B. Increasing vessel sizes a red flag for US ports. Dec 21, 2020 https://www.joc.com/maritime-news/container-lines/increasing-vessel-sizes-red-flag-us-ports_20201221.html?utm_source=Eloqua&utm_medium=email&utm_campaign=CL_JOC%20Daily%2012%2F22%2F20_JOC%20Daily%20Newswire_e-production_E-85422_KB_1222_0617
Mongelluzzo, B. US imports from Asia hit record December level. Jan 19, 2021 https://www.joc.com/maritime-news/container-lines/us-imports-asia-hit-record-december-level_20210119.html?utm_source=Eloqua&utm_medium=email&utm_campaign=CL_JOC%20Daily%201%2F20%2F21_PC00000_e-production_E-87262_KB_0120_0617
Mongeluzzo, B. Additional port capacity alone can’t solve congestion issues: LA-LB. Journal of Commerce. April 2021 https://www.joc.com/port-news/us-ports/additional-port-capacity-alone-can%E2%80%99t-solve-congestion-issues-la-lb_20210407.html?utm_source=Eloqua&utm_medium=email&utm_campaign=CL_JOC%20Daily%204%2F8%2F21_PC00000_e-production_E-95420_KB_0408_0837
Posted by Faith Campbell
We welcome comments that supplement or correct factual information, suggest new approaches, or promote thoughtful consideration. We post comments that disagree with us — but not those we judge to be not civil or inflammatory.
For a detailed discussion of the policies and practices that have allowed these pests to enter and spread – and that do not promote effective restoration strategies – review the Fading Forests report at http://treeimprovement.utk.edu/FadingForests.htm