Unique Black Ash Wetlands – Threatened by Emerald Ash Borer

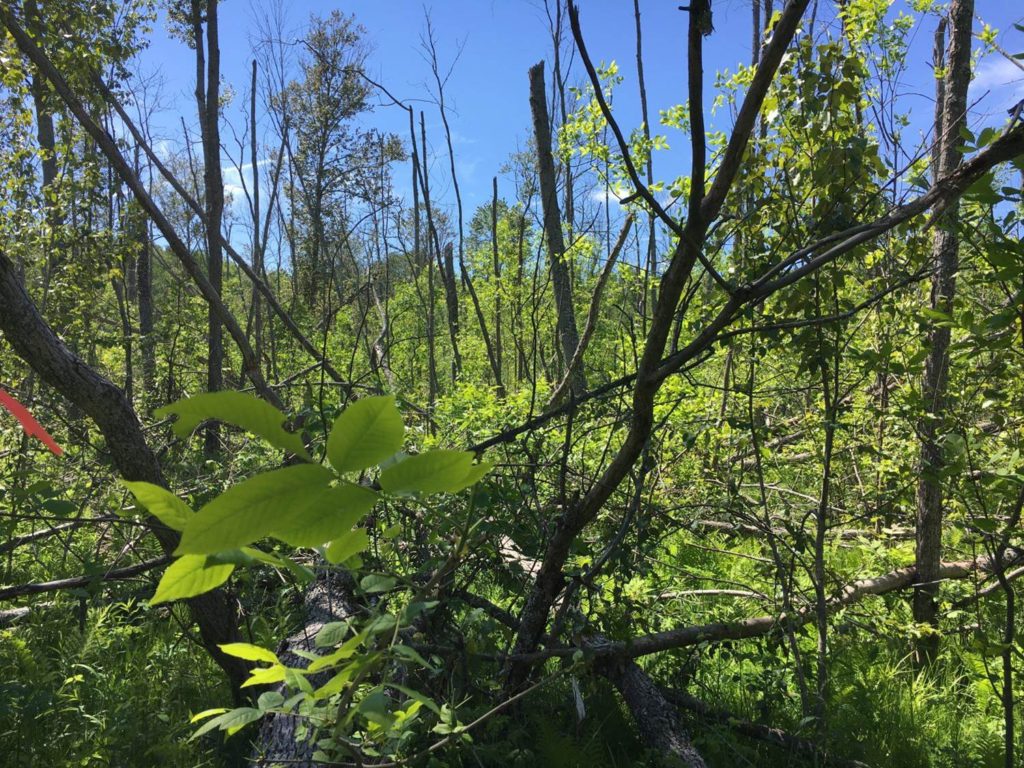
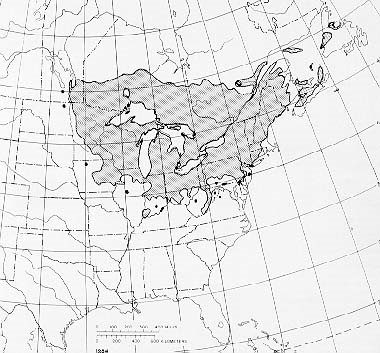
Another unique ecosystem being severely damaged by non-native tree-killing pests are the wetlands dominated by black ash (Fraxinus nigra). Black ash typically grows in fens, along streams, or in poorly drained areas that often are seasonally flooded. Such swamps stretch from Minnesota to Newfoundland; in the three states of Michigan, Wisconsin, and Minnesota, they cover a total of over 2 million hectares (Kolka et al. 2018).

locations of black ash swamps; source

Recent research allows us to understand the impending loss to these unique ecosystems that will be caused by the emerald ash borer (EAB).

Hydrology is the dominant factor that influences a host of ecosystem functions in black ash wetlands. Water levels are largely determined by a combination of precipitation and evapotranspiration rates. Black ash can thrive in wetter areas than most other tree species (Slesak et al. 2014). Water tables in these swamps are typically above the surface throughout early spring, followed by drawdown below the surface during the growing season with periodic rises following rain events. Water table drawdown coincides with peak evapotranspiration following black ash leaf out, demonstrating the fundamental control that this species has on animal and other plant communities (Kolka et al. 2018; Slesak et al. 2014).

Ecological Importance

Black ash generally dominate the canopy of these wetlands. Ash density can range from about 40% to almost 100%. Several other tree species are present, including northern white cedar (Thuja occidentalis), red maple (Acer rubrum), American elm (Ulmus americana) (Kolka et al. 2018), quaking aspen (Populus tremuloides), American basswood (Tilia americana), and bur oak (Quercus macrocarpa) (Slesak et al. 2014), balsam fir (Abies balsamea), balsam poplar (Populus balsamifera), and speckled alder (Alnus incana) (Youngquist et al. 2020). Black ash, by maintaining low water levels during the growing season, creates conditions under which these other trees can live but not thrive (summary of study by B.J. Palik, USDA Forest Service, here. Most other species lack  the  physiological adaptations of black ash or face pathogenic constraints (e.g., Dutch elm disease on American elm Ulmus americana) (Kolka et al. 2018).

Ash trees in these swamps are uneven-aged with canopy tree ages ranging from 130–232 years (Slesak et al. 2014). This complexity provides important habitat for many wildlife species, including ground beetle community assemblages (Kolka et al. 2018) and an abundance of aquatic macroinvertebrates. These are characterized and dominated by mollusks (Sphaeriidae, Lymnaeidae, Physidae), annelids (Lumbriculidae, Hirudinea), caddisflies (Limnephilidae, Leptoceridae), and dipterans (Chironomidae, Culicidae) (Youngquist et al. 2020).

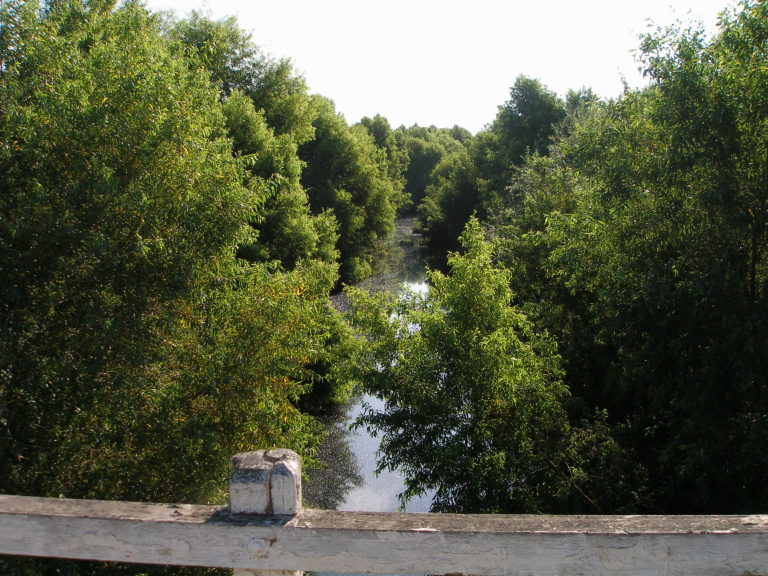
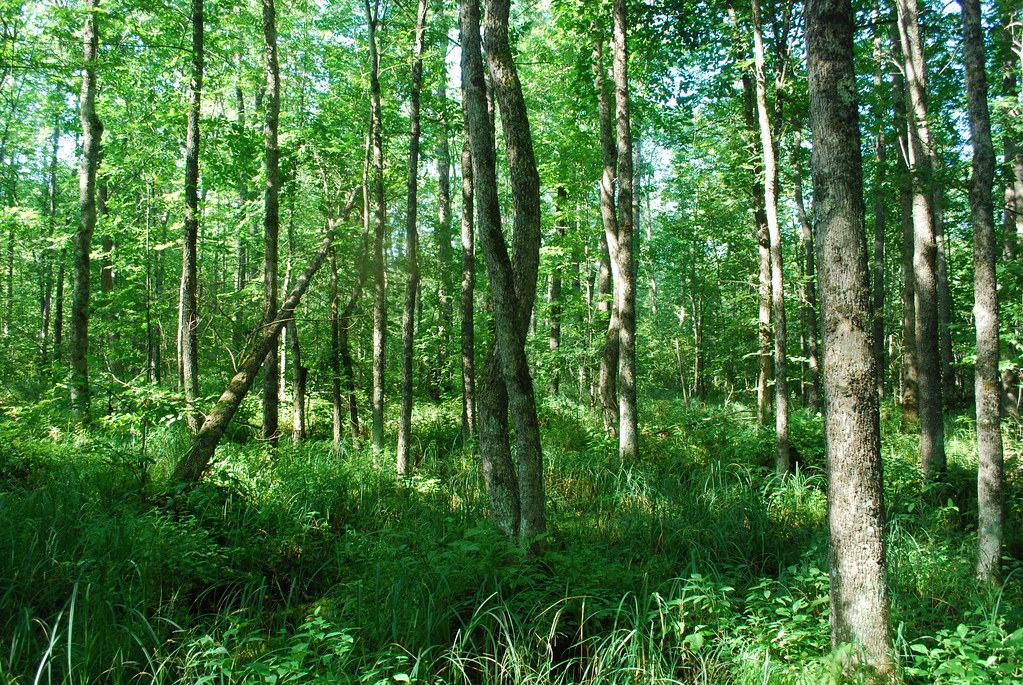
a black ash swamp; source: Flickr

A major concern is that loss of trees – especially ash – might result in open marshes dominated by grasses, especially lake sedge (Carex lacustris). Conversion to sedge-dominated marshes has been observed in areas where trees have been removed as part of experiments to test various ecosystem responses to loss of the ash component (Slesak et al. 2014). Even if other trees took the place of ash, the substitutes might not support the same animal communities (see below).

Impact of Emerald ash borer and loss of black ash

Black ash is highly susceptibility to the EAB (Engelken and McCullough, 2020), so scientists expect severe impacts of the invasion in ash-dominated wetlands and – to a somewhat lesser extent — in forested stream systems’ riparian areas (Engelken and McCullough, 2020). They expect cascading impacts on 1) hydrology; 2) plant communities; 3) wildlife; 4) Native American cultures; and possibly even storage of carbon in vegetation and soils (Kolka et al. 2018).

            1) Hydrology

Experiments suggest that loss of ash will cause higher water tables, especially during late summer and fall (Kolka et al 2018). This will result from reductions in evapotranspiration as large trees are replaced by shrubs and grasses (see below) (Kolka et al. 2018; Slesak et al. 2014). The higher water table might be exacerbated if higher annual precipitation levels predicted by climate change models occur. On the other hand, these models also predict a simultaneous increase in longer droughts, which might partially counteract higher precipitation and reduced evapotranspiration (Kolka et al. 2018). If they occur, these possible increases in drought length and frequency might enhance the establishment of less water-tolerant non-ash tree species in former black ash wetlands.

            2) Plant Communities

Higher water tables are expected to reduce tree densities and promote conversion to open or shrub-dominated marshes. Several of the possible alternative tree species do not thrive as well as black ash under current conditions (Kolka et al. 2018). However, new hydrologic conditions might make forest restoration even more difficult because herbaceous plants transpire less water than trees, thus exacerbating the rising water tables (Slesak et al. 2014).

In upper Michigan, experiments which killed ash by cutting or girdling did not lead to an increase in growth rates of the remaining canopy species despite the increase in available resources (e.g., sunlight and nutrients) – presumably because of the raised water table (Kolka et al. 2081).

While some studies have found that black ash seedlings and saplings dominated the woody component of the swamp understory up to three years after ash were experimentally removed (Kolka et al. 2018), Engelken and McCullough (2020) found only eight saplings and a single seedling.

Scientists have planted several tree species in experiments to see which might be used to maintain the forested wetlands in the absence of black ash. The results are a confusing mix. Some species grew well once established – but had low levels of seedling establishment. Some trees planted on elevated microsites (hummocks) had the greatest survival and growth rates. (For specific data, see Kolka et al. 2018). A further consideration is tree species’ ability to adapt to warming temperatures already evident and expected to increase in coming decades (Slesak et al. 2014).

Consequently, Slesak et al. (2014) think it is likely that the EAB invasion will alter vegetation dynamics and cause a shift to an altered ecosystem state (e.g., open marsh condition) with higher water tables. They caution that the degree of ecosystem alteration will vary depending on site hydrology, annual precipitation, and period of time necessary for establishment of deeper rooted vegetation.

            3) Wildlife

Moreover, any changes in vegetation will also affect the biota in more subtle ways through altered nutrient cycles. Black ash leaf litter is highly nutritious, having some of the highest nitrogen, phosphorus, and cation contents of any hardwood forest species (Kolka et al. 2018). Black ash leaves also decompose faster than most alternative tree species’ leaves (summary of Palik USDA Forest Service, here;  Youngquist et al. 2018).

Youngquist et al. (2018) studied litter breakdown, litter nutritional quality, and growth of a representative invertebrate litter feeder – larvae of a shredding caddisfly (Limnephilus indivisus). They found that the larvae’s risk of death increased by a factor of three times or more when caddisflies were fed American elm, balsam poplar, or lake sedge leaves compared to black ash leaf litter. Even when the larvae lived – but matured more slowly because of the lower nutrition value of the leaves – they would still be vulnerable because they must reach metamorphosis before pond dry-down. In any planting done to maintain forested quality of wetlands, need to consider the nutritional quality of the leaf litter provided by replacements. Speckled alder was only apparently acceptable substitute; it was second to black ash in acceptability to caddisflies (Youngquist et al. 2020)

In fact, Youngquist et al. (2020) concluded that plant and detritivore biodiversity loss due to EAB invasion could alter productivity and decomposition at rates comparable to other anthropogenic stressors (e.g., climate change, nutrient pollution, acidification). The result will be altered biogeochemical cycles, resource availability, and plant and animal communities.

Scientists are also concerned about the impact of ash tree mortality on forest connectivity. Conversion of wooded swamps to shrub-and sedge-dominated wetlands will result in the loss of important micro-habitats that are already limited across the forested landscape and may also reduce availability of critical habitat for migrating birds. These changes will exacerbate on-going changes in land use in the Great Lakes region that are causing loss of forest habitat and forest homogenization. As yet, the magnitude of the impact on wildlife is unclear (Kolka et al. 2018).

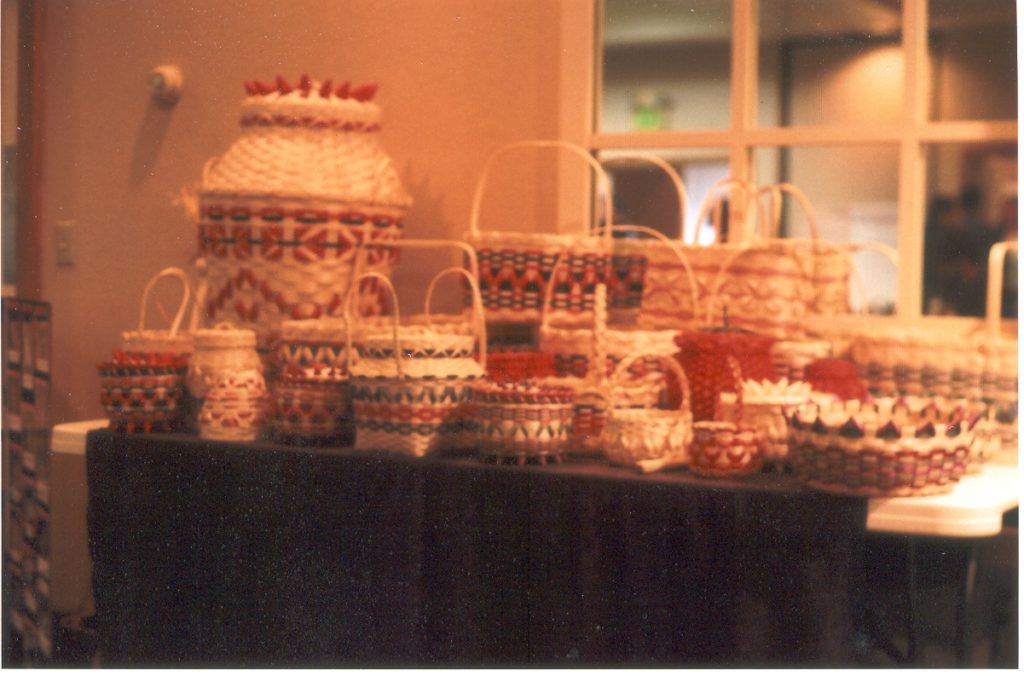
black ash baskets – displayed at 2006 conference
photo by Faith Campbell

            4) Cultural importance – baskets

Native Americans living in the range of black ash have utilized the wood to make baskets and other tools for thousands of years. Baskets had numerous uses, such as packs for carrying items, fish traps, and for preparing food and storing household items. Ash items also had ceremonial uses and they are highly sought as gifts and in trade. The skill needed to select a good tree and work the wood is handed down through the generations and is an important part of tribes’ culture (Benedict 2010).

Discussion of these cultural traditions can be found as Powerpoints here and here.

A video is posted here.

USFS Research Efforts

Concerned by the spread of EAB and probable impact on black ash swamps, the USDA Forest Service has initiated major research studies with the goal of filling in the numerous knowledge gaps and developing management recommendations. A large-scale study using various manipulations to simulate the EAB invasion was initiated in the Chippewa National Forest in northern Minnesota in 2009. A companion study began in the Ottawa National Forest in Michigan in 2010 (Kolka et al. 2018). The Slesak, Youngquist, and Kolka publications cited in this blog report results of some of the studies in this project. Other studies of black ash conditions, including regeneration, at various stages of the EAB invasion wave are being carried out by Deb McCullough, Nate Siegert, and others. They are working at sites from Michigan to New England (D.G. McCullough, pers. comm.).

Posted by Faith Campbell

We welcome comments that supplement or correct factual information, suggest new approaches, or promote thoughtful consideration. We post comments that disagree with us — but not those we judge to be not civil or inflammatory.

For a detailed discussion of the policies and practices that have allowed these pests to enter and spread – and that do not promote effective restoration strategies – review the Fading Forests report here.

For a great discussion of black ash basketweavers,  see Anne Bolen, A Silent Killer: Black Ash Basket Makers are Battling a Voracious Beetle to Keep their Heritage Alive, American Indian Magazine,  Spring  2020, available here. 

SOURCES

Benedict, M. 2010. Ecology and the Cultural and Economic Importance of Black ash (Fraxinus nigra Marsh) for Native Americans May 2010 https://www.fs.usda.gov/Internet/FSE_DOCUMENTS/stelprdb5191796.pdf

Engelken, P.J. and D.G McCullough. 2020. Riparian Forest Conditions Along Three Northern Michigan Rivers Following Emerald Ash Borer Invasion. Canadian Journal of Forest Research. Submitted

Kolka, R.K., A.W. D’Amato, J.W. Wagenbrenner, R.A. Slesak, T.G. Pypker, M.B. Youngquist, A.R. Grinde and B.J. Palik. 2018. Review of Ecosystem Level Impacts of Emerald Ash Borer on Black Ash Wetlands: What Does the Future Hold? Forests 2018, 9, 179; doi:10.3390/f9040179 www.mdpi.com/journal/forests

Slesak, R.A., C.F. Lenhart, K.N. Brooks, A.W. D’Amato, and B.J. Palik. 2014. Water table response to harvesting and simulated emerald ash borer mortality in black ash wetlands in MN, USA. Can. J. Forestry. Res. 44:961-968.

Youngquist, M.B., C. Wiley, S.L. Eggert, A.W. D’Amato, B.J. Palik, & R.A. Slesak. 2020. Foundation Species Loss Affects Leaf Breakdown and Aquatic Invertebrate Resource Use in Black Ash Wetlands. Wetlands. Society of Wetland Scientists

Posted by Faith Campbell

We welcome comments that supplement or correct factual information, suggest new approaches, or promote thoughtful consideration. We post comments that disagree with us — but not those we judge to be not civil or inflammatory.

For a detailed discussion of the policies and practices that have allowed these pests to enter and spread – and that do not promote effective restoration strategies – review the Fading Forests report at http://treeimprovement.utk.edu/FadingForests.htm

Beech Leaf Disease – Inspect Trees for Symptoms! Help Determine the Extent of this Disease

Beech trees have leafed out – so now is the time to search for symptoms of beech leaf disease.

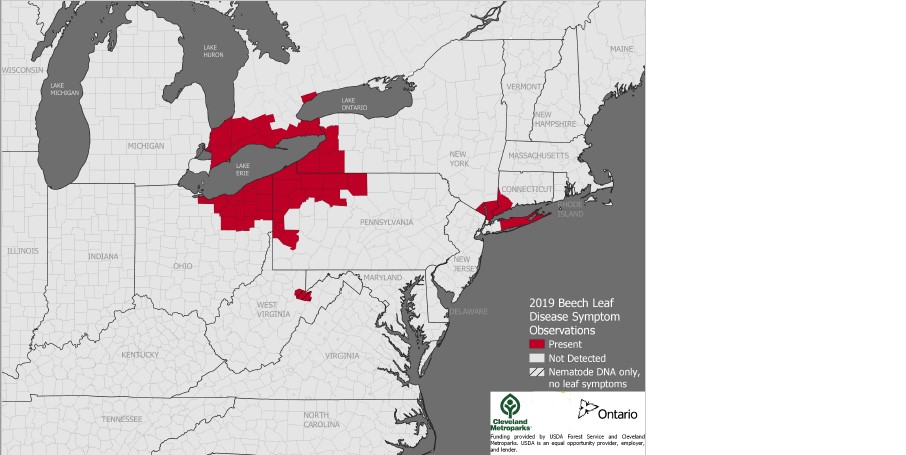
Since its first detection near Cleveland in 2012, BLD has now been detected in 40 counties in Ohio, New York, Pennsylvania, Connecticut, and Ontario.  (see map)

I ask your help now because homeowners detected the outbreaks in Connecticut in 2019. (It is often homeowners or curious citizens who detect outbreaks of tree-killing pests.)

What to look for – symptoms:

  • Dark bands between lateral veins of leaves. Banding is most apparent when viewing from below, looking upwards into the canopy. Banding is evident immediately upon leaf-out in the spring.
  • Aborted bud development and reduced leaf production.
  • Later stages result in heavily banded-darkened leaves that are thickened and leathery in texture, often with shriveled or curled edges.

All range of symptoms can be present on the same branch. Symptoms on individual leaves do not advance over the course of the summer. Severely affected leaves can drop off as summer progresses, sometimes as early as June. So the early season – now – is the best time to search.

Cleveland MetroParks has posted a pest alert (from last year), a report on symptom progression  with good photos, and instructions for participating in the Beech Tree Health Survey. Survey apps are available as iOS: https://apps.apple.com/us/app/tree-health-survey/id1498515762 or Android: https://play.google.com/store/apps/details?id=com.KentState.TreeHealth&hl=en_US

Go to https://www.clevelandmetroparks.com/parks/education/publications and scroll down to the Beech Leaf Disease section (it is in large font so you won’t miss it).

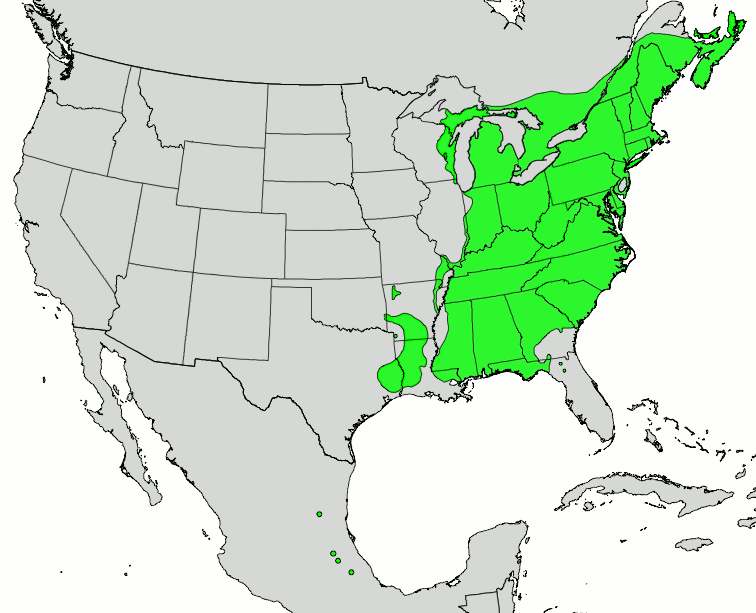
Where to look? See the map of the range of American beech.

Range of American beech; source Wikimedia

In addition to checking American beech (Fagus grandifolia), also examine European beech (F. sylvatica), and Oriental beech (F. orientalis).

I encourage you to use one of the apps. However, if you are not but see something suspicious, send me a picture by using the “contact us” button. I will take a quick look, consult with experts, and – if they see what appear to be symptoms – they will tell me and I will tell you how to contact plant health authorities in your state or province.

 Remember to include your email and phone number in your message to me – the “contact” form by itself does not provide sufficient information for me to respond to you.

Posted by Faith Campbell

We welcome comments that supplement or correct factual information, suggest new approaches, or promote thoughtful consideration. We post comments that disagree with us — but not those we judge to be not civil or inflammatory.

For a detailed discussion of the policies and practices that have allowed these pests to enter and spread – and that do not promote effective restoration strategies – review the Fading Forests report at http://treeimprovement.utk.edu/FadingForests.htm

Pest Threats to Eastern Forests – Focus on the Mid-Atlantic

EAB-kiled ash tree in Shenandoah National Park in 2016
photo by F.T. Campbell

 As we have known for years, forests of the eastern United States are under severe pressure from non-native forest insects and diseases. Several recent studies have put this fact into perspective.

Fei et al. (2019) found that the 15 most damaging introduced species threaten 41.1% of the total live forest biomass in the 48 conterminous states. Nine of the 15 species included in this calculation are pests of the eastern forest. Indeed, the greatest increase in biomass loss, as measured by USDA Forest Service Forest Inventory and Analysis (FIA) plot data occurred here. Compensatory growth in unaffected trees and the recruitment of new regeneration occurs only later – as much as two or more decades after the pest invasions began. Fei et al. (2019) expect these losses will be exacerbated in the future due in part to the likelihood that additional pests will be introduced.

Randall Morin found that non-native pests had caused approximately 5% increase in total mortality, by tree volume, nation-wide.

Most widespread pest threats in the East

Scientists have used several methods of measuring introduced pests’ impacts. One measure is the number of counties where the pest is present. A second measure is the proportion of the volume of the host that has been affected. Both metrics are used by Morin. A third method, used by the CAPTURE Project (Potter et al. 2019a), is the number of hosts affected by the pest.

Morin and colleagues found that the European gypsy moth has invaded 630 counties – or 29% of the volume of its principal host, oaks. (In both cases, the gypsy moth trailed white pine blister rust in extent of infestation. The latter is nationwide but having its greatest impacts in the West). The CAPTURE Project found that the gypsy moth affected the largest number of hosts – 65.

Using the “counties invaded” metric, Morin and colleagues found that dogwood anthracnose had invaded 609 counties in the East (and additional areas in the West); the emerald ash borer had invaded 479 counties at the time of analysis; the hemlock woolly adelged had invaded 432 counties. Using the number of hosts impacted measure, oak wilt (Bretziella fagacearum) affected the second largest number of hosts – 61 (Potter et al. 2019a). [All these pests are described briefly here.]

Project CAPTURE (Potter and colleagues 2019a) evaluated 339 serious pests threatening one or more of 419 native tree species in the continental US. They included both native and introduced pests. They analyzed 1,378 pest-host combinations. They found that:

  • 54% of the host tree species (228) are infested by an exotic pest – although only 28% of the 1,378 host/agent combinations involved pests are known to be non-native in origin.
  • Exotic agents have, on average, considerably more severe impacts than native pests.
  • Non-native pests had greater average severity on angiosperms than on conifers. (As an earlier blog documented, Mech and colleagues have reached a similar – although tentative – conclusion.)
  • Their estimate of the threat posed by non-native pests to forests – especially for the East – is an underestimate because established pests could spread to additional vulnerable areas and there is a high likelihood that new pests will be introduced. The Southeast was consistently a “coldspot” – despite the near extirpation of one understory tree – redbay.

Potter et al. (2019a) ranked forest threats in two ways. Four host families were at highest risk to alien pests, as measured by both the numbers of tree species affected and by the most host/agent combinations: Fagaceae (oaks, tanoaks, chestnuts, beech); Pinaceae (pines); Sapindaceae (soapberry family; includes maples and buckeye); Salicaceae (willows, poplars, aspens). When host families were ranked by the severity of the host/pest threat, Fagaceae was still at greatest risk, and Sapindaceae was still in the top four; however, Ulmaceae (elms) and Oleaceae (includes Fraxinus) replaced pines and willows.

A very interesting study was published by scientists based in the Blue Ridge Mountains of Virginia (Anderson-Teixeira et al. 2020). They contend that their area is a good example of what is happening more broadly in the Mid-Atlantic region.

Anderson-Teixeira et al. (2020) found that non-native pests have substantially impacted at least 24% of the 33 tree genera (eight genera) recorded as present in their study plots. They estimated that over the century beginning with the appearance of chestnut blight in the region and ending with the expected extirpation of ash trees, net live aboveground biomass (AGB) loss among affected species totaled roughly 6.6–10 kg m -2. Forty to sixty percent of this loss started before the Park initiated quantitative surveys of permanent plots in 1987. The authors estimated that chestnut contributed up to 50% of estimated AGB losses over the century. Consequently, the estimate has very high uncertainty.

Despite these losses, Anderson-Teixeira et al. (2020) found that both total aboveground biomass and diversity within individual study plots had largely recovered through increases in non-vulnerable genera.

Average above ground biomass across the plots established in Shenandoah National Park increased as the forest recovers from logging, farming, and other disturbances before formation of the Park. These increases were due primarily to reproduction and growth of tulip poplar (Liriodendron tulipifera) and growth (but not reproduction) of oaks. Net AGB biomass was lost in oak- and hemlock-dominated plots. At plots established in the neighboring Smithsonian Conservation Biology Institute, pests had caused relatively minor impacts on AGB.

Diversity of tree species also did not change much. In the Park, the average number of genera per plot declined only 3% between 1991 and 2013. Diversity at the landscape scale increased by two genera – from 26 to 28. Many individual plots, though, lost three genera due to non-native pests – chestnut, redbud, and hemlock. A fourth genus was lost due to stochastic change. At the same time, the plots gained six native genera). This finding might be skewed by the short duration of the study period, which missed initial declines in several taxa and captured only the initial stages of decline in ash.

Several taxa were lost from the monitoring plots but were not completely extirpated from the region. Even those species not “lost” suffered elevated mortality rates and steep declines in abundance and above-ground biomass. These declines have not been reversed. The exception was some oaks, which regained above ground biomass, but not abundance, following the gypsy moth outbreak in the 1980s and early 1990s.  

Taxa-specific findings

(Most of these pests are described briefly here.)

Fei et al. (2019) found that losses in biomass due to non-native pests – as measured by FIA plot data – was greatest for ashes, elms, beech trees, and hemlocks..

Morin and colleagues found annual mortality rates had increased three-fold above background levels for ash, beech, and hemlock. They also calculated the present mortality rates for several species for which the majority of loss occurred before their study (consequently, they could not calculate a pre-invasion “background” rate to which present rates could be compared). These included American chestnut (mortality rate of 7%), butternut (mortality rate of 5.6%), and elm trees (mortality rate of 3.5%).

The CAPTURE Project (Potter et al. 2019a) identified fifteen host-agent combinations with the highest severity. Ten of these species are found in the Mid-Atlantic region:  

  • American chestnut (Castanea dentata)
  • Allegheny chinquapin (C. pumila)
  • Carolina ash (Fraxinus caroliniana) ,
  • pumpkin ash (F. profunda)
  • Carolina hemlock (Tsuga caroliniana
  • butternut (Juglans cinerea)
  • eastern hemlock (Tsuga canadensis)
  • white ash (Fraxinus americana)
  • black ash (F. nigra)
  • green ash (F. pennsylvanica)

Four of these species are in genera included among the eight genera evaluated in the study conducted in the Blue Ridge (Anderson-Teixeira et al. 2020): American chestnut, butternut, eastern hemlock, green and white ash. The four other genera in the Blue Ridge study were elm (Ulmus), oak (Quercus), redbud Cercis, and dogwood (Cornus). All except redbud are recognized by other sources as heavily affected by non-native pests – confirming Anderson-Teixeira et al. (2020)’s conclusion that findings on the Blue Ridge reflect the wider situation.

Anderson-Teixeira et al. (2020) note that several of these tree species have been declared imperiled by the International Conservation Union (IUCN): American chestnut, butternut, American elm, eastern hemlock, and ash species.

Anderson-Teixeira et al. (2020) report data on three taxa previously important in the canopy of Blue Ridge forests – chestnut, elms, and butternut. Chestnuts larger than 10 cm DBH had disappeared from the future site of Shenandoah National Park by 1910. Short-lived sprouts continue to be present in plots in the low-elevation Smithsonian Conservation Biology Institute. Two elm species were described as ‘‘sparse’’ in the 1939 qualitative survey. Elms have persisted at low densities, low biomass, and increasingly small sizes. Butternut was ‘‘common’’ in 1939, but had disappeared from Shenandoah NP by 1987. On the Smithsonian’s property, butternut declined from four living individuals in 2008 to two in 2018. The near disappearance of butternut reflects the national picture: FIA data show the species has decreased about 58% across its U.S. range since the 1980s – which is decades after butternut canker started having a detectable impact in the Midwest.

In the Park, oak-dominated plots lost on average 24.9% of individuals and 15% of aboveground biomass.  After 1995, when the gypsy moth was better controlled by spraying of Bacillus thuringiensis var. curstaki, oak aboveground biomass increased gradually, driven by individual tree growth rather than new recruitment. Continued declines in oak abundance are attributable to oak decline and management actions (or inactions) that do not promote regeneration.

In a separate study, a group of oak experts went through a process of queries to identify the greatest threat to oaks now and in the future (Conrad et al. 2020). They initially identified the following threats as most important currently (descending order): gypsy moth, oak wilt, oak decline, climate change, and drought. The top five future threats were initially identified as climate change, oak wilt, sudden oak death, oak decline, and some unknown new or emerging (non-native) pest or pathogen. By the third round, after the experts thought about their colleagues’ responses, oak decline had replaced gypsy moth as the most critical threat currently. Attack by an unknown new or emerging (non-native) pest or pathogen replaced climate change as the most critical future threat. While there was not a complete consensus, the consensus was stronger on the threat from a new pest.

remnant eastern hemlock at Linderlost, Shenandoah National Park
photo by F.T. Campbell

Anderson-Teixeira et al. (2020) reported that eastern hemlock was initially present in ten of Shenandoah plots, but was no longer recorded in the survey plots after 2007. (More than 20,000 insecticide-treated trees remain alive throughout Shenandoah NP).

Before arrival of the emerald ash borer, ash aboveground biomass was increasing in Shenandoah NP and stable on the Smithsonian Institute. EAB-caused mortality was first detected at the Smithsonian site in 2016 and accelerated steeply thereafter, exceeding 12.5% year by 2018. As of 2019, ash had lost 28% of individuals and 30% of aboveground biomass relative to 2016. Ninety-five percent of remaining live trees were considered “unhealthy’’ (Anderson-Teixeira et al. 2020).

eastern (flowering) dogwood; photo by F.T. Campbell

Unlike many studies, the Shenandoah study included understory species. Flowering dogwood declined by up to 90% from plots on the Smithsonian property; 2008–2019 mortality rates averaged 7.1%. Redbud declined by up to 76% from 1995 to 2018. The 2008–2019 mortality rates averaged 6.2% year.

Anderson-Teixeira et al. (2020) concede difficulty in estimating mortality due to less virulent or lethal pathogens, including Neofusicoccum spp. on redbud and Dutch elm disease on slippery elm.

Nevertheless, they believe their analysis probably underestimates the overall pest impacts because they did not analyze several other pest/host combinations known to be present in the Park: balsam woolly adelgid (Adelges piceae) on high-elevation populations of Abies balsamea; white pine blister rust (Cronartium ribicola) on eastern white pine (Pinus strobus); beech bark disease (Neonectria spp.) on American beech (Fagus grandifolia); thousand canker disease on walnut and butternut; and emerald ash borer on the novel host fringetree Chionanthus virginicus.

Another possible threat to oaks, winter moth (Operophtera brumata), is apparently now being controlled by the biocontrol agent Cyzenis albicans.  

I am uncertain about the current status of two Diplodia fungi – Diplodia corticola and D. quercivora – link to blog which have been detected in both Florida and California. In Florida, almost all the symptomatic trees grow in cultivated settings where they are exposed to various stresses (Mullerin and Smith 2015).

However, host range studies indicate that 33 species of oaks and one species of chestnut that grow in the Southeast are vulnerable, to varying degrees, to D. corticola. Oaks in the red oak group (Section Lobatae) are more vulnerable than are white oaks (Section Quercus) (Mullerin and Smith 2015). In the test, the most vulnerable appear to be the following species native to the Southeast: Q. laurifolia, Q. virginiana, Q. geminata, Q. chapmanni, Q. laevis (turkey oak), Q. phellos, Q. pumila, and Q. incana (Dreaden et al. 2016).

What should we do?

Fei et al. (2019) noted that the losses to biomass would be exacerbated by the likely introduction of additional pests. They did not recommend any prevention actions.

Conrad et al. (2020) said their findings “lend support to national regulatory and awareness efforts to prevent the introduction and establishment of novel exotic insects and pathogens.”

Anderson-Teixeira et al. (2020) join others in declaring that future survival of the IUCN-listed species probably depends on conservation and restoration actions. They cite several sources, but not the CAPTURE Project – although the two studies reinforce each other. They specifically mention limiting invasive species’ spread through strengthened regulations and “enhanced plant biosecurity cyberinfrastructure”.

This last recommendation reinforces the message of Bonello et al. (2019) link to publication. We called for creation of a federal Center for Forest Pest Control and Prevention to implement end-to-end responses to forest pest invasions. One focus would be correcting the currently-inadequate focus on detection, development and deployment of genetic resistance while using modern techniques that allow for much faster breeding cycles.

Posted by Faith Campbell

We welcome comments that supplement or correct factual information, suggest new approaches, or promote thoughtful consideration. We post comments that disagree with us — but not those we judge to be not civil or inflammatory.

For a detailed discussion of the policies and practices that have allowed these pests to enter and spread – and that do not promote effective restoration strategies – review the Fading Forests report at http://treeimprovement.utk.edu/FadingForests.htm

SOURCES

Anderson-Teixeira, K.J., V. Herrmann, W.B. Cass, A.B. Williams, S.J. Paull, E.B. Gonzalez-Akre, R. Helcoski, A.J. Tepley, N.A. Bourg, C.T. Cosma, A.E. Ferson, C. Kittle, V. Meakem, I.R. McGregor, M. N. Prestipino, M.K. Scott, A.R. Terrell, A. Alonso, F. Dallmeier, and W.J. McShea.  Date?  Long-Term Impacts of Invasive Insects and Pathogens on Composition, Biomass, and Diversity of Forests in Virginia’s Blue Ridge Mountains. Ecosystems

Bonello, P. , F.T. Campbell, D. Cipollini, A.O. Conrad, C. Farinas, K.J.K. Gandhi, F.P. Hain, D. Parry, D.N. Showalter, C. Villari, and K.F. Wallin. 2019.  Invasive tree pests devastate ecosystems – A proposed new response framework. Frontiers 

Conrad, A.O., E.V. Crocker, X. Li, W.R. Thomas, T.O. Ochuodho, T.P. Holmes, and C. D. Nelson. 2020. Threats to Oaks in the Eastern US: Perceptions and Expectations of Experts.  Journal of Forestry, 2020, 14–27

Dreaden, Black, Mullerin, and Smith. Poster presented at the 2016 USDA Invasive Species Research Forum

Fei, S., R.S. Morin, C.M. Oswalt, and A.M. Liebhold. 2019. Biomass losses resulting from insect and disease invasions in United States forests. Proceedings of the National academy of Sciences.

Guo, Q., S. Feib, K.M. Potter, A.M. Liebhold, and J. Wenf. 2019. Tree diversity regulates forest pest invasion. PNAS.  www.pnas.org/cgi/doi/10.1073/pnas.1821039116

Morin, R.S., K.W. Gottschalk, M.E. Ostry, A.M. Liebhold. 2018. Regional patterns of declining butternut (Juglans cinerea L.) suggest site characteristics for restoration. Ecology and Evolution.2018;8:546-559

Morin, R. A. Liebhold, S. Pugh, and S. Fie. 2019. Current Status of Hosts and Future Risk of EAB Across the Range of Ash: Online Tools for Broad-Scale Impact Assessment. Presentation at the 81st Northeastern Forest Pest Council, West Chester, PA, March 14, 2019

Mullerin, S. & J.A. Smith. 2015. Bot Canker of Oak in FL Caused by Diplodia corticola & D. quercivora. Emergent Pathogens on Oak and Grapevine in North America. FOR318

Potter, K.M., M.E. Escanferla, R.M. Jetton, and G. Man. 2019a. Important Insect and Disease Threats to United States Tree Species and Geographic Patterns of Their Potential Impacts. Forests. 2019 10 304.

Potter, K.M., M.E. Escanferla, R.M. Jetton, G. Man, and B.S. Crane. 2019b. Prioritizing the conservation needs of United States tree species: Evaluating vulnerability to forest insect and disease threats. Global Ecology and Conservation. (2019)

Serious Invasive Species Damage to High-Elevation Sites in the West

Dream Lake, Rocky Mountain National Park, with limber pine
photo by F.T. Campbell

In this blog, I summarize two pest threats to the unique ecosystems on high-elevation mountain ridges in the West. At risk are several keystone tree species: the five-needle pines growing at high elevations (“high-five” pines) and subalpine fir. The invasive species causing this damage – white pine blister rust (WPBR; Cronartium ribicola) and balsam woolly adelgid (BWA; Adelges piceae) – are two of the most widespread non-native species threatening North American trees and affecting the highest proportion of host volumes (Morin).

The pines being killed by white pine blister rust are whitebark pine (Pinus albicaulis), limber pine (P. flexilis), Rocky Mountain bristlecone pine (P. aristata), foxtail pine (P. balfouriana), and southwestern white pine (P. flexilis var. reflexa). As of 2010, infestations had not been reported on Great Basin bristlecone pine (P. longaeva) and the Mexican white pine species. [Unless otherwise indicated, information on white pine blister rust is from a comprehensive review and synthesis published in the August 2010 issue of Forest Pathology (Vol. 40:3-4).]

As noted above, sub-alpine fir (Abies lasiocarpa) is also being affected – although less uniformly than the pines – by the balsam woolly adelgid.

Both of these pests arrived approximately a century ago, but they are still spreading and causing additional damage. White pine blister rust had spread widely throughout the West within 40 years of its introduction. Meanwhile, BWA spread among lowland and subalpine firs along the Pacific coast from California to British Columbia within 30 years of its first detection. Its spread eastward was slower, but relentless. It reached Idaho, Montana, Utah and interior British Columbia within 50 years.  Also, BWA reached Alaska within 90 years of its introduction in California. These pests are perfect examples of how invasive species introduced long ago are dreaded “gifts that keep on giving”.

For a detailed discussion of these pests’ impacts, see the descriptions posted here. To summarize, though, WPBR is present in the ranges of eight of the nine vulnerable western white pines and has caused severe mortality to some species (Sniezko et. al. 2011). For example, 88% of the limber pine range in Alberta is affected (Dawe et al. 2020). WPBR is generally causing more damage to its hosts’ northern populations. Impact of the BWA are more subtle than WPBR. Also, impacts’ severity is linked to climatic conditions. For example, measurable decline on the Olympic Peninsula was greater on south-facing slopes. However, the study did not determine whether this reflected heat-loading and tree stress or more abundant subalpine fir on these slopes. An estimated 19-53% (average 37%) of subalpine fir trees had died on sample plots on one ridge over the 19 years since BWA was first detected there. Overall forest growth after 2007 could indicate partial recovery, a momentary pause in BWA invasion, or tree growth after severe weather events (Hutton 2015).

Ranges of Trees at Risk

Many of the host trees of these two pests are widespread; others are more narrowly endemic.

Limber pine reaches from Alberta and British Columbia south to mountain peaks in Arizona and New Mexico. Whitebark pine is found from Alberta and British Columbia to California and Nevada (USDA Plants database. Subalpine fir stretches from southeast Alaska along the Canadian Rockies coast into Washington, Oregon, east into Idaho, Montana, Wyoming, Colorado, Utah, even into scattered mountain ranges of Nevada and New Mexico (Hutton 2015).

Limber pine and subalpine fir are also found in a wide range of ecosystems within these ranges. Limber pine is found at both upper and lower tree lines in grassy, open forests; on exposed rocky slopes; and in dense, mixed-conifer stands. Subalpine fir is a pioneer species on ridges, alpine meadows, avalanche chutes, and lava beds (Ragenovich and Mitchell, 2006).

Before arrival of non-native pests or pathogens, these tree species have persisted for thousands of years under harsh conditions (Hutton 2015). Many of the individual trees were long-lived; some five-needle pines, e.g., bristlecone pines, have famously live for thousands of years. Core studies demonstrated that subalpine firs trees could live 272 years in the forests of Olympic National Park and 240 years in Glacier National Park (Hutton 2015). Surely loss of these trees – or even their conversion from large and old to small and short-lived – will result in significant destruction of these unique biomes.

All these trees play important roles in high altitude, unique ecosystems (Pederson et al. no date; Dawe 2020; Hutton 2015):

  • They retain ground water, slow the rate of snow melt, and maintain stream flow characteristics and water quality;
  • They curtail soil erosion and maintain slope stability; and
  • They provide high-value food and shelter to wildlife.

Whitebark and limber pines are famous for providing critical food for many wildlife species at high elevations —notably bears and nutcrackers (Compendium and Dawe 2020).   

More Pest Threats

Other diseases, insects, and disturbances also pose serious threats to these tree species. The threats vary by region and age of the stand. They include – for the pines — mountain pine beetle (Dendroctonus ponderosae), dwarf mistletoe (Arceuthobium spp.), and various shoot, cone or foliage insects and pathogens. For subalpine fir, threats include western balsam bark beetle (Dryocoetes confusus), fir engraver (Scolytus ventralis), and the fir root bark beetle (Pseudohylesinus granulatus) (Hutton 2015). Trees are also damaged by bear and deer, seed predation by squirrels, wildfire, and biotic succession.

On Washington’s Olympic Peninsula, BWA initiates or predisposes subalpine fir for a novel disturbance complex. BWA-caused stress makes the trees more susceptible to moisture stress and endemic bark beetle attack. Surviving trees are subsequently subject to toppling by wind. A tree can die in a few years, survive with insects for up to 20 years, or recover, depending on duration, severity, and location of infestation, and local environmental conditions (Hutton 2015).

BWA study plots in the Cascade Range experienced subalpine fir mortality ranging from 7 to 79% (measured as stem counts, not basal area) over a 19 to 38 years study period. Higher mortality occurred at low-elevation, mesic sites. One stand experienced 40% mortality in 19 years, but lost the remaining 60% during a subsequent spruce budworm infestation. Most plots continued to show sporadic signs of adelgid presence and continued tree mortality. However, 41-69% of trees survived stem infestations (Hutton 2015).

How to Protect These Ecosystems

The seeds of both whitebark and limber pines are dispersed to newly disturbed, open areas by Clark’s nutcracker (Nucifraga columbiana). Furthermore, whitebark cones open to release seeds only after fire. This had led to expectations that prescribed fire could promote regeneration of these species. However, studies by Dawe (2020) and other have found that nutcracker seed caching behavior and seedling establishment are complex. Fire management might have to vary among regions, demanding consideration of stand characteristics,like openness and the presence of other tree species. For example, in the Colorado Front Range, limber pine can be replaced by subalpine fir when fire-free intervals are long. On the other hand, in Alberta, fire appeared to boost regeneration of the dominant tree species in the stands pre-fire. In the study areas, these were white spruce (Picea glauca) and lodgepole pine (Pinus contorta) (Dawe 2020).  Dawe recommends protecting existing stands of limber pine through fire mitigation efforts, e.g., thinning and other fuel treatments, and supplementary planting of seedlings.

Efforts to find biocontrol agents to target the balsam woolly adelgid began in 1957; the original focus was on the insects’ damage to Fraser fir (Abies fraseri) in the southern Appalachians.  More than 25 predatory species have been introduced from Europe and Asia. There was simultaneous research on native predators. None has had an impact on BWA populations in either the East or the West.

Neither white pine blister rust nor balsam woolly adelgid is considered a quarantine pest by federal officials, so there is no attempt to prevent their movement via interstate trade in Christmas trees, timber, or nursery stock. Hutton (2015) hypothesizes that the absence of regulatory measures targetting BWA arises from the pest’s gradual effect and the hosts’ not being commercially important as timber species (although several firs are important in horticulture and as Christmas trees). I think another factor is that the pests were introduced so long ago and are now widespread.

Efforts are under way to detect resistant genotypes to be used in breeding programs. Several of the lower-elevation five-needle pines vulnerable to WPBR have benefitted from extensive breeding efforts Whitebark pine has more recently been added to programs.

The eastern Fraser fir is the target of breeding – primarily for Christmas trees (APS). However, at least small-scale volunteer efforts have been carried forward by the Alliance for Saving Threatened Forests.

Hutton (2015) expresses hope that evolutionary pressure by BWA might enhance survival of more resistant forms of subalpine fir and lead to their gradual takeover. However, I ask, why leave it to chance?

In this context, I remind you of my involvement with a group (see Bonello et al. 2019) proposing creation of a federal Center for Forest Pest Control and Prevention to implement end-to-end responses to forest pest invasions – including overcoming the currently inadequate focus on detection, development and deployment of genetic resistance using modern techniques that allow for much faster breeding cycles.

I am puzzled that the Project CAPTURE places whitebark pine and subalpine fir only in Class A4.2, not among the highest priority species (Potter et al. 2019). As I blogged last spring, Project CAPTURE is part of a multi-partner effort to categorize and prioritize US tree species for conservation actions based on the threats and the trees’ ability to adapt to those threats. I find it puzzling because I am not sure I agree that these two species have a moderately high mean pest severity score – as required by the category. I am less puzzled by the assignment of a low adaptive capacity score.

Limber pine apparently ranks even lower in the Project CAPTURE priority process.

Posted by Faith Campbell

We welcome comments that supplement or correct factual information, suggest new approaches, or promote thoughtful consideration. We post comments that disagree with us — but not those we judge to be not civil or inflammatory.

For a detailed discussion of the policies and practices that have allowed these pests to enter and spread – and that do not promote effective restoration strategies – review the Fading Forests report at http://treeimprovement.utk.edu/FadingForests.htm

SOURCES

A comprehensive review and synthesis of the history, ecology, and management of white pines threatened by white pine blister rust see the August 2010 issue of Forest Pathology (Vol. 40:3-4).

American Phytopathological Society. Science Daily. December 9, 2019 https://www.sciencedaily.com/releases/2019/12/191209161314.htm?utm_source=feedburner&utm_medium=email&utm_campaign=Feed%3A+sciencedaily%2Fplants_animals%2Finvasive_species+%28Invasive+Species+News+–+ScienceDaily%29

Bonello, P. , F.T. Campbell, D. Cipollini, A.O. Conrad, C. Farinas, K.J.K. Gandhi, F.P. Hain, D. Parry, D.N. Showalter, C. Villari, and K.F. Wallin. 2019.  Invasive tree pests devastate ecosystems – A proposed new response framework. Frontiers 

Dawe, D.A., V.S. Peters, M.D. Flannigan. 2020. Post-fire regeneration of endangered limber pine (Pinus flexilis) at the Northern extent of its range. Forest Ecology and Management 457 (2020) 117725

Hutton, K.M. 2015. A dissertation submitted in partial fulfillment of the requirements for the degree of Doctor of Philosophy. University of Washington. Available here

Morin, R. Presentation to the 81st Northeastern Forest Pest Council Northeastern states forst agencies, Philadelphia, Pennsylvania, March 2019.

Potter, K.M., Escanferla, M.E., Jetton, R.M., Man, G., Crane, B.S. 2019. Prioritizing the conservation needs of US tree spp: Evaluating vulnerability to forest P&P threats, Global Ecology and Conservation (2019), doi: https://doi.org/10.1016/

Ragenovich, I.R. and R.G. Mitchell. 2006. Forest Insect and Disease Leaflet (FIDL) #118. http://www.na.fs.fed.us/pubs/fidls/bwa.pdf

Sniezko, R.A., M.F. Mahalovich, A.W. Schoettle, D.R. Vogler. 2011. Past and Current Investigations of the Genetic Resistance to Cronartium ribicola in High-elevation Five-needle Pines. In Keane, R.F., D.F. Tomback, M.P. Murray, and C.M Smith, eds. 2011. The future of high-elevation, five-needle white pines in Western North America. Proceedings of the High Five Symposium. 28-30 June, 2010. Missoula, MT.

NPS Report Published in Journal – Has it Been Implemented? Can it Be?

invasive lake trout in Yellowstone National Park

The National Park Service has a legal mandate to manage lands and waters under its jurisdiction so as to “preserve unimpaired” their natural and cultural resources (NPS Organic Act 54 U.S.C. § 100101, et seq.) Invasive species undermine efforts to achieve that mission. In 2000, the NPS adopted a program to coordinate management of invasive plants. It’s not as effective as needed – see the strategic plan.  

However, only recently has NPS begun trying to prioritize and coordinate programs targetting the many animals and animal diseases which threaten Park resources. These organisms range from emerald ash borer and quagga mussels; to pythons, goats, and pigs; to diseases such as white nose syndrome of bats and avian malaria in Hawai`i.

In 2017, NPS released an internal study of the pervasive threat to Park resources posed by invasive animals and discussed steps to overcome barriers to more effective responses (Redford et al., 2017; full citation at end of this blog). The Chief of the Biological Resources Division initiated this report by asking a Science Panel to evaluate the extent of the invasive animal problem, assess management needs, review best practices, and assess potential models that could serve as a service-wide organizational framework. The report was to pay particular attention to innovative and creative approaches including, but not limited to, new genomic tools. I summarized the Panel’s  findings and conclusions in a blog when its report appeared in 2017.

Significantly, the Panel’s final report states that “a general record of failure to control invasive species across the system” was caused principally by a lack of support for invasive species programs from NPS leadership.

This report has now appeared in the form of a peer-reviewed article in the journal Biological Invasions by Dayer et al. 2019 (full citation at end of this blog). Although nine of the ten authors are the same on both reports there are substantive differences in content. For example, the journal article reiterates the principal findings and conclusions of the Panel’s final report, but in less blunt language.

What’s Been Watered Down

The toning down is seen clearly in the statements some of the panel’s six key findings.

Finding #1

            The panel’s report says:  invasive animals pose a significant threat to the cultural and natural values and the infrastructure of U.S. national parks. To date, the NPS has not effectively addressed the threat they pose.

            Dayer et al. says: the ubiquitous presence of invasive animals in parks undermines the NPS mission.

Finding #2

            The panel’s report says: managing invasive animals will require action starting at the highest levels, engaging all levels of NPS management, and will require changes in NPS culture and capacity.

            Dayer et al. says: coordinated action is required to meet the challenge.

Finding #4

            The panel’s report states: effective management of invasive animals will require stakeholder engagement, education, and behavior change.

            Dayer et al. says: public engagement, cooperation and support is [sic] critical.

Wording of the other three “key findings” was also changed, but these changes are less substantive.

Drayer et al. also avoid the word “failure” in describing the current status of NPS” efforts to manage invasive animal species. Instead, these authors conclude that the invasive species threat “is of sufficient magnitude and urgency that it would be appropriate for the NPS to formally declare invasive animals as a service-wide priority.”

Where the Documents Agree – Sort of

Both the Panel’s report and Dayer et al. state that invasive animal threats are under-prioritized and under-funded. They say that addressing this challenge must begin at the highest levels within the NPS, engage all levels of management, and will require investments from the NPS leadership.  Even within individual parks, they acknowledge that staffs struggle to communicate the importance of invasive animal control efforts to their park leadership, especially given competition with other concerns that appear to be more urgent. And they admit that parks also lack staff capacity in both numbers and expertise.

Also, both the Panel’s report and Dayer et al. urge the NPS to acknowledge formally that invasive animals represent a crisis on par with each of the three major crises that drove Service-wide change in the past: over-abundance of ungulates due to predator control; Yellowstone fire crisis (which led to new wildfire awareness in the country); and recognition of the importance of climate change.

The Panel suggested ways to update NPS’ culture and capacity: providing incentives for staff to (1) address long-term threats (not just “urgent” ones) and (2) put time and effort into coordinating with potential partners, including other park units, agencies at all levels of government, non-governmental organizations, private landowners, and economic entities. Dayer et al. mention these barriers but does not directly mention changing incentives as one way to overcome them.

Both the Panel’s report and Dayer et al. suggest integrating invasive animal threats and management into long-range planning goals for natural and cultural landscapes and day-to-day operations of parks and relevant technical programs (e.g., Biological Resources Division, Water Resources Division, and Inventory and Monitoring Division).

What is Missing from the Journal Publication

The Panel’s final report noted the need for increased funding. It said that such funding would need to be both consistent and sufficiently flexible to allow parks to respond to time-sensitive management issues. It proposes several approaches. These include incorporating some invasive species control programs (e.g., for weeds and wood borers) into infrastructure maintenance budgets; adopting invasive species as fundraising challenges for non-governmental partners (e.g., “Friends of Park” and the National Park Foundation); and adopting invasive species as a priority threat. Dayer et al. do not discuss funding issues.

The final internal report envisioned the NPS becoming a leader on the invasive species issue by 1) testing emerging best management practices, and 2) educating visitors on the serious threat that invasive species pose to parks’ biodiversity. As part of this process, the authors suggest that the NPS also take the lead in countering invasive species denialism.  Dayer et al. do not mention the issue of invasive species deniers.

Common Ground: Status of Invasive Animals in the Parks

The Panel’s report and Dayer et al. describe the current situation similarly:

  • More than half of the National parks that responded to the internal survey (245 of the 326 parks) reported problems associated with one or more invasive animal species.
  • The total number of species recorded was 331. This is considered to be an underestimate since  staffs often lack the ability to thoroughly survey their parks – especially for invertebrates.
  • Invasive species threats to Parks’ resources have been recognized for nearly 100 years. The original report notes that 155 parks reported the presence of one or more exotic vertebrate species in 1977. At that time, exotic animals were the fourth most commonly reported source of threats. In 1991, parks identified 200 unfunded projects to address exotic species, costing almost $30 million.
  • Only a small percentage of non-native animal invasions are under active management. Dayer et al. stated that 23% have management plans at the park unit level, and only 11% are reported as being ‘‘under control”.
  • Individual parks have effective programs targetting specific bioinvaders (examples are described in Redford et al;  a brief summary of these efforts is provided in my previous blog.    

Common Ground on Some Solutions

The report and Dayer et al. promote the same steps to improve invasive animal management across the Service. Both note that the NPS is adopting formal decision support tactics to update and strengthen natural resource management across the board. More specific steps include

  • establishing a coordination mechanism that enables ongoing and timely information sharing.
  • mainstreaming invasive species issue across the NPS branches or creating a cross-cutting IAS initiative among the Biological Resources Division, Water Resources Division, Inventory and Monitoring Division, Climate Change Response Program, and the regional offices.

While both documents call on the NPS to develop and test emerging technologies, the Panel’s final  report is more detailed, providing, in Table 5, a list of several areas of special interest, including remotely triggered traps, species-specific toxicants, toxicant delivery systems, drones, environmental DNA, and sterile-male releases. Dayer et al. mention eDNA and metabarcoding for ED/RR, biocontrol, and gene drives to control invasive pathogens. (Neither document discusses possible concerns regarding use of CRISPR and other gene-altering technologies, other than to say there would be public concerns that would need to be addressed.)

Both documents note the necessity of working with resource managers beyond park boundaries to detect and manage species before they arrive in parks. They note that developing and operationalizing such partnerships requires time and resources. Furthermore, invasive species prevention, eradication, and containment programs can be effective only with public support. They suggest strengthening NPS’ highly regarded public outreach and interpretation program to build such support, including through the use of citizen scientists.

The Panel’s final report said that the NPS should recognize that the condition of the ecosystem is the objective of efforts.  Its authors recognized that achieving this goal might require reconsidering how ecosystem management is organized within NPS so interacting stressors (e.g.,  fire) and management levers (e.g., pest eradication/suppression, prescribed fire) would be addressed. For this, the NPS would need to create a focused capacity to address the pressing issue of invasive animals in such a way that fosters integrated resource management within parks, focusing on fundamental values of ecosystem states, and not eradication targets. Dayer et al. called for the same changes without specifically labelling “condition of the ecosystem” as the goal.

Publication of Dayer et al. prompted me to find out what progress the NPS has made in responding to the “key findings” in the Panel’s final report (neither publication calls them “recommendations”). 

The National Park Service has acted on the recommendation to appoint an “invasive animal coordinator” within the Biological Resources Division. That person is Jennifer Sieracki. However, I wonder whether a person located in BRD is of sufficient stature to influence agency policy across all divisions. It is not clear whether there is active coordination with the national-level invasive plant coordinator.

Dr. Sieriaki responded to my query by noting the following new efforts 1) to improve outreach to partners and the public, and 2) to expand formal and informal partnerships with local, state, federal and tribal entities and local communities near parks.

  • NPS should soon finalize two formal partnerships with other agencies and organizations for outreach and management of invasive animal species.
  • NPS is working with researchers at the US Geological Survey to expand an existing modeling tool for identifying potential suitable habitat for invasive plant species to include invasive insects. This will help staff focus on the most likely locations for introductions and thus assist with early detection and control.
  • NPS has created a Community of Practice so NPS employees can seek each other’s advice on addressing invasive animal issues. A workshop of regional invasive species coordinators is planned for the coming months to guide direction of the service-wide program and identify other top priorities. (Seriacki pers. comm.)

I also wonder whether the NPS can achieve the top-level coordination and outreach to the public called for by both reports while complying with the terms of Public Law 116-9 – the John N. Dingle Jr. Conservation, Management, and Recreation Act, which was enacted a year ago. Title VII, Section 10(i)  of this law limits spending to carry out invasive species program management and oversight to 10% of appropriated funds. Less than 15% may be spent on investigations (research), development activities, and outreach and public awareness efforts (Section 10(h)). The law does allow spending for investigations regarding methods for early detection and rapid response, prevention, control, or management; as well as inspections and interception or confiscation of invasive species to prevent in-park introductions.

For more information, see my previous criticism of NPS failure to address invasive species issues here.

Posted by Faith Campbell

We welcome comments that supplement or correct factual information, suggest new approaches, or promote thoughtful consideration. We post comments that disagree with us — but not those we judge to be not civil or inflammatory.

See also my earlier discussion of the new legislation here.

SOURCES

Dayer, A.A., K.H. Redford, K.J. Campbell, C.R. Dickman, R.S. Epanchin-Niell, E.D. Grosholz, D.E. Hallac, E.F. Leslie, L.A. Richardson, M.W. Schwartz. 2019. The unaddressed threat of invasive animals in U.S. National Parks.  Biol Invasions

https://doi.org/10.1007/s10530-019-02128-0

Redford, K.H., K. Campbell, A. Dayer, C. Dickman, R. Epanchin-Niell, T. Grosholz, D. Hallac, L. Richardson, M. Schwartz. 2017. Invasive animals in U. S. National Parks: By a science panel. Natural Resource Report NPS/NRSS/BRD/NRR—2017/1564. NPS, Fort Collins, Colorado. Commissioned by the NPS Chief of Biological Resources Division. https://irma.nps.gov/DataStore/DownloadFile/594922

Jennifer Sieracki, Invasive Animal Coordinator, Biological Resources Division, National Park Service

New USFS Report on Forest Health – Confusing Differences from Other Studies

ash killed by emerald ash borer
photo by Nate Siegert

USDA Forest Service has issued its annual summary of the nation’s forest health, based on various data sources.

The report seeks to provide  status and trends at the national and regional levels as of 2017. It analyzes drivers of tree mortality including insects and pathogens, fire, and weather (especially drought). The report also discusses plant invasions in forests in the East. There is considerable discussion of emerging methods to improve data collection and analysis. Finally, it includes three case studies to illustrate the power of these approaches for analyzing forest health issues at specific sites:

• Decline of bishop pine (Pinus muricata) stands in California’s northern coastal areas;

• Impacts on naio (Myoporum sandwicense) on Hawaii’s Big Island of the myoporum thrips; and

• Impacts of increasing temperatures on Great Basin bristlecone pine (Pinus longaeva) communities.

Tree-Killing Insects and Pathogens

In 2017, the USFS Forest Health Protection (FHP’s) national Insect and Disease Survey (IDS) covered 55.1% of the total forested area of the lower 48 states.  In Alaska, surveys covered about 7.3% of the total forested area.  In Hawai`i, the surveys covered about 80.1 %.

The FHP program and partners in State agencies identified 63 mortality-causing agents and complexes that cumulatively affect 3.27 million hectares in the lower 48 states – 1.3% of the total 252 million hectares of forested land in these states. They also identified 50 defoliating agents and complexes affecting approximately 2.34 million hectares. 

Most of the analyses focus on ecoregions developed by USFS scientists based on concepts put forward by Bailey (1995). Ecoregions are made up of regions with similar geology, climate, soils, potential natural vegetation, and natural communities. The area of the lower 48 states is divided into 190 ecoregions (see Chapter 1, esp. page 7).

Their damage, by type and level, was not evenly spread. Geographic hot spots of forest mortality were associated with bark beetle infestations in the West, and with emerald ash borer and southern pine beetle in the East. Hot spots of defoliation were associated with European gypsy moth and several native insects. Several native insects were the principal agents of defoliation in Alaska. In Hawai`i, about 37,000 hectares of mortality were listed officially as caused  by an unknown agent, but the report attributes this mortality to rapid ‘ōhi‘a death.

The emerald ash borer was the most widespread single mortality agent in 2017, causing measurable tree mortality on 1.42 million hectares. In the program’s North Central region, 91% of the area suffering tree mortality was associated with the EAB. In one ecoregion – the Lake Whittlesey Glaciolacustrine Plain ecoregion (on the Ohio-Michigan border), about 73% of the mortality was caused by insects, especially the EAB. In a second, the Southwestern Great Lakes Morainal ecoregion (along the western shore of Lake Michigan in Wisconsin and Illinois), a quarter of the surveyed forest was experiencing exacerbated mortality due to EAB. The EAB also is causing mortality across 10,346 ha in the Northeast and more than 5,000 ha in the South.

However, heightened mortality (rates above 1%) in several Great Plains ecoregions were attributed largely to drought – even in the elm-ash-cottonwood forest type. However, such biological factors as oak decline, bur oak blight (Tubakia iowensis), Dutch elm disease, and native pests of ash were also significant. Emerald ash borer is mentioned rarely. I am confused by this finding – perhaps it reflects the fact that EAB has not yet been detected in North Dakota?

Other non-native pests that affect more than 5,000 ha in the lower 48 states were the Balsam woolly adelgid (20,758 hectares, primarily in the Northeast), beech bark disease (12,222 ha, primarily in the North Central region), oak wilt (9,573 ha, primarily in the North Central region), and sudden oak death (6,335 ha, in California). (All are described here.)

Still, despite the numerous and widespread presence of EAB and other non-native tree-killing insects and pathogens in the Central and Eastern States, in most areas, tree mortality is low relative to tree growth. Indeed, in nearly all the other North Central ecoregions, as well as those in the Northeast and South, 1% or less of the forested area was exposed to mortality agents. Hot spots associated with EAB were detected in Connecticut and eastern Kentucky.

Oak wilt was reported as a mortality agent in Michigan and Texas.

I am confused by the discrepancy between the findings of the Forest Health Protection (FHP’s) national Insect and Disease Survey and studies by other USFS scientists – as reported in earlier blogs. Thus, Randall Morin, speaking at the 81st Northeastern Forest Pest Council in March 2019, reported detecting an approximate 5% increase in mortality – measured by tree volume – nation-wide.  The greatest increases in mortality above the background rate was the four-fold increase for redbay and the three-fold  increase for ash trees (from 0.8% to 2.7%), beech (from 0.7% to 2.1%), and hemlock (from 0.5% to 1.7%). (The increase for ash was incorrectly stated in my earlier blog).  

Other studies by, among others, Guo et al. 2019 and the Potter studies discussed the threat – present and future – rather than current changes in mortality levels. See my blog here.  

All note that their estimates are probably underestimates.

All the studies agree that EAB, European gypsy moth, and oak wilt threaten the greatest number of species (Potter et al. 2091b).

However, these reports also note the widespread presence of other damaging invaders – several of which don’t appear in the FHP survey. These include white pine blister rust (present in 94% of the potential hosts’ ranges; 955 counties); and dogwood anthracnose (in 609 counties in the East; plus uncalculated number of counties in the West) (Morin and the western counties were not calculated) (FIA “dashboards”).

whitebark pine in Crater Lake National Park killed by white pine blister rust
photo by F.T. Campbell

Data available from the West are less suited to the kind of analysis the FHP report used (for an explanation, see chapter 5). In the FHP West Coast and Interior West regions, principal mortality agents were bark beetles, drought, and fire. Some ecoregions suffered up to 5% mortality. Using a different measurement tool — annual mortality volume to gross annual volume growth (MRATIO) – the Southern California Mountain and Valley Ecoregion had the highest damage – at 2.50. This was attributed to a combination of prolonged drought, bark beetles, and fire.

Of 50 defoliation agents and complexes across the lower 48, the most widespread was the European gypsy moth. Across the continent, its impacts were detected on 39% of the total forested area of the lower 48 states (913,000 ha). Defoliation was particularly severe in the Northeast Region — again   primarily by the European gypsy moth (869,000 ha). Other non-native defoliation agents affecting more than 5,000 ha in the lower 48 were the larch casebearer (25,891 ha in the North Central region, another 7,400 ha in the West Coast region) and winter moth (12,760 ha in the Northeast region).  (The last is described here.)

The report concedes that death of tree species that are scattered in multi-species forests, such as most of the victims of non-native forest pests in the East, are not easily detected by the methodology the USFS uses. Examples cited by the report include emerald ash borer, hemlock woolly adelgid, laurel wilt, Dutch elm disease, white pine blister rust, and thousand cankers disease. (All are described here.)  

Hence the authors advise decision-makers to use other forest health indicators in addition to this report.

I have already reported on studies by Morin, Liebhold, and colleagues and Kevin Potter and colleagues. Each finds ways to analyze Forest Inventory and Analysis (FIA) data to provide more detail on mortality caused by non-native insects and pathogens.

Invasive Plants

Invasive plants have already invaded a large proportion of rural forest in the East. Christopher Oswalt and colleagues used FIA data to assess the plant invasion status in 13 bioregions covering most of the temperate and boreal forests in the Eastern U.S. I blogged about Oswalt’s studies previously. Their findings are also reported here, in chapter 6:

  • Data were analyzed on 71 invasive plant species;
  • Half of the total area of 74 forest types was found to be invaded;

Plant invasions are almost twice as likely on privately than publicly owned land. Ownership alone was the deciding factor for the most-invaded forest types.)

The types of forest most heavily invaded were loblolly-shortleaf pine (61%), elm-ash-cottonwood (59%) oak-pine and oak-hickory (each 58%). The forest types least invaded were northern types: spruce-fir (20%), aspen-birch (32%), and maple-beech-birch (34%).

However, several forest type groups were excluded from the study; these included other eastern softwoods; pinyon-juniper; exotic softwoods; other hardwoods; woodland hardwoods; tropical hardwoods; and exotic hardwoods, and Fraser fir.

One-third of publicly owned (federal, state, and local) forest land was invaded, compared to 46% of private corporate forest and 59% of private non-corporate forest.  

SOURCES

Bailey, R.G.. 1995. Descriptions of the ecoregions of the United States. 2d ed. Miscellaneous Publication No. 1391. Washington, D.C.: U.S. Department of Agriculture Forest Service. 108 p.

Fei, S., R.S. Morin, C.M. Oswalt, and A.M. 2019. Biomass losses resulting from insect and disease invasions in United States forests

Guo, Q., S. Feib, K.M. Potter, A.M. Liebhold, and J. Wenf. 2019. Tree diversity regulates forest pest invasion. PNAS.  www.pnas.org/cgi/doi/10.1073/pnas.1821039116

Morin, R.S., K.W. Gottschalk, M.E. Ostry, A.M. Liebhold. 2018. Regional patterns of declining butternut (Juglans cinerea L.) suggest site characteristics for restoration. Ecology and Evolution.2018;8:546-559

Morin, R. A. Liebhold, S. Pugh, and S. Fie. 2019. Current Status of Hosts and Future Risk of EAB Across the Range of Ash: Online Tools for Broad-Scale Impact Assessment. Presentation at the 81st Northeastern Forest Pest Council, West Chester, PA, March 14, 2019

Potter, K.M., B.S. Crane, W.W. Hargrove. 2017. A US national prioritization framework for tree species vulnerability to climate change. New Forests (2017) 48:275–300 DOI 10.1007/s11056-017-9569-5

Potter, K.M., M.E. Escanferla, R.M. Jetton, and G. Man. 2019a. Important Insect and Disease Threats to United States Tree Species and Geographic Patterns of Their Potential Impacts. Forests. 2019 10 304.

Potter, K.M., M.E. Escanferla, R.M. Jetton, G. Man, and B.S. Crane. 2019b. Prioritizing the conservation needs of United States tree species: Evaluating vulnerability to forest insect and disease threats. Global Ecology and Conservation. (2019)

USDA Forest Service. Forest Health Monitoring: National Status, Trends, and Analysis 2018.  General Technical Report SRS-239. June 2019. Editors Kevin M. Potter Barbara L. Conkling

What FIA data tell us about non-native pests of America’s forests

dead redbay in Claxton, GA 2009; photo by Scott Cameron

Several groups of scientists are using two large datasets to analyze impacts of invasion by non-native tree-killing pests. The first dataset used is official Forest Service monitoring data from the Forest Inventory and Analysis (FIA). These data are collected on a “rolling” annual basis from 130,210 forest plots in 2,098 counties in the 48 conterminous states. (Go here to learn more about FIA.)  

The second dataset covers the distribution of non-native forest pests and is contained in the Alien Forest Pest Explorer database, also a Forest Service product.

Some of these studies (those led by Kevin Potter) have been carried out under the auspices of “Project CAPTURE” (Conservation Assessment and Prioritization of Forest Trees Under Risk of Extirpation) as part of a multi-partner effort to categorize and prioritize US tree species for conservation actions based on the threats and the trees’ ability to adapt to those threats. Partners include North Carolina State University; Forest Service Forest Health Protection, Southern Research Station, and forest health monitoring program; Eastern Forest Environmental Threat Assessment Center; and the Forest.Health program.

Here I highlight several key studies that use FIA data to examine:

1) the relationship between the diversity of forest tree species  and the number of non-native insects and pathogens established there;  

2)  the mortality rate of  forest trees due to non-native pests; and

3) impacts i in the form of  “geographic hot spots;”

4) application of these findings to setting conservation priorities.

1. Impact of Host Diversity on Pest Establishment

One group of scientists (Guo et al.; reference at the end of this blog) extracted distribution data for 66 non-native pests (51 insects, 15 pathogens) taken from the Alien Forest Pest Explorer database. Then, the authors compared these pest’ distributions to FIA data on the diversity of tree species in the same invaded forests — for both “host” and non-host tree species. (Guo et al. classified a tree species as a “host” only if the relevant pest was present in the county.)

Guo et al. found that the number of alien pest species established in a county increased commensurate with tree diversity – as long as that tree diversity was fairly low, i.e., below 39 tree species. The number of established pests increased particularly strongly for specialist pests. However, at higher levels of tree diversity the number of established pests fell. Another factor was the diversity of non-host tree species present. When considering generalist pests, fewer pests became established when non-host tree diversity exceeded 15 species. When considering specialist pests, that cutoff was 25 species.

Among other possible factors explaining numbers of pests established, Guo et al. also found that only propagule pressure – measured by the proxy of human population density – had a significant positive correlation with increased pest numbers.

2. Measuring the Impacts of Non-Native Pests – Tree Mortality Data

A different approach has been undertaken by Randall Morin, working with a variety of coauthors. Dr. Morin has used FIA survey data to detect whether the impact of various non-native pests can be seen in heightened levels of mortality of the pests’ hosts. I reported these findings in a previous blog

eastern hemlock killed by hemlock woolly adelgid in Nova Scotia
photo by Celia Boone, Nova Scotia Department of Lands and Forestry

As I noted in the earlier blog, Dr. Morin found that non-native forest pests had caused an approximately 5% increase in total mortality by tree volume nation-wide. The degree to which mortality levels rose in any county depended on the killing power of the individual pest species and the relative density of tree species vulnerable to the pests present. The number or diversity of non-native tree-killing pests established in the county (see the Guo et al. study) did not determine the county’s morality level. See maps in the earlier blog.

The greatest increase in mortality rates (a four-fold increase) was for redbay, under attack by laurel wilt disease. Three-fold increases in annual mortality rates were detected for ash, beech, and hemlock. To learn the specific mortality rates for individual pest-host relationships, visit here and read the descriptions of butternut, chestnut, redbay, beech, hemlock, ash, tanoak (sudden oak death), Port-Orford cedar, oak wilt, and European gypsy moth

tanoak killed by sudden oak death (Phytophthora ramorum), Big Sur, California

3.Overview of Impacts, Identification of Geographic “Hotspots” and Use in Setting Conservation Priorities

To carry out “Project CAPTURE,” Potter, Escanferla, Jetton, and Man 2019a (full reference at the end of this blog) sought to identify regions at greatest risk of significant ecological and economic impacts from damaging insects, pathogens, or parasitic plants, especially non-native, introduced pests.

They first compiled a list of 339 serious pests threatening one or more of 419 native tree species in the continental United States. The list comprised 168 diseases, 151 insects, and 20 parasitic higher plants. It included both native and introduced pests – 142 native, 55 non-native, and 142 of unknown or disputed origin.

They analyzed up to five of the most serious pests for each native tree species. This analysis resulted in 1,378 pest-host combinations.

The authors assigned a severity rating for each pest-host combination. Instead of using counties, as Guo et al. did, they evaluated pests and hosts in hexagons covering approximately 800km2. They used FIA data to determine in which hexagons each pest-host combination is present. Finally, the authors determined the “importance value at risk” (IVAR) for each hexagon based on the number of pest-host combinations present and the relative severity of those combinations.  [See the article – referenced below – for detailed explanations of these calculations.]

General Findings

Analyses addressing all the pests, including native ones, found different results than analyses focused on the non-native pests. Thus, analyses of all pests found greater impacts in the West, whereas non-native pests caused potentially greater impacts in the East. The authors note that the non-native pest risk could be greatly magnified across much of the eastern United States if the alien pests are able to spread to the entirety of their hosts’ ranges.

Considering the pests:

  • Of the 1,378 host/agent combinations, 51.5% involve diseases, 43.6% involve insects, and 4.9% involve parasitic plants.
  • Among the insects, 77 are phloem or wood-borers, 51 are foliage-feeders, and 23 are sap-feeders. Of the total of 601 insect-host combinations (both native and exotic), borers are the agents in 224 (37%) of the combinations.
  • 54% of the host tree species (228) are infested by an exotic pest – although only 28% of the 1,378 host/agent combinations involved known exotic pests.

Considering the host tree species:

  • two non-native pests affect the largest number of hosts: European gypsy moth – 65 hosts; and oak wilt (Bretziella fagacearum) – 61 hosts. A third alien species, Asian longhorned beetle, ranked fourth overall with 43 hosts.
  • Nearly 70% of the host/agent combinations involve angiosperm species, 30% gymnosperms. Regarding all combinations, the severity of the gymnosperm/agent combinations was significantly higher than angiosperm/agent combinations. However, when considering only non-native pests, the opposite was true: host/agent combinations for angiosperms had greater average severity.

Severity of Impacts

  • Disease impacts are more severe, on average, than insect pests.
  • Wood-borers are more damaging than other types of insect pests.
  • Exotic agents have, on average, considerably more severe impacts than native pests.
  • The risk estimate – especially for the East – is an underestimate because established pests could spread to additional vulnerable areas and there is a high likelihood that new pests will be introduced.

Of the 15 host-agent combinations with the highest severity, seven are caused by an insect, seven by a disease, one by an insect-disease complex. These 15 tree species at highest risk are:

  • Florida torreya (Torreya taxifolia) – pathogen,
  • American chestnut (Castanea dentata) – pathogen,
  • Allegheny chinquapin (C. pumila) – pathogen,
  • Ozark chinquapin (C. pumila var. ozarkensis) – pathogen,
  • redbay (Persea borbonia) – disease complex, 
  • Carolina ash (Fraxinus caroliniana) – insect,
  • pumpkin ash (F. profunda) – insect,
  • Carolina hemlock (Tsuga caroliniana) – insect,
  • Port-Orford cedar (Chamaecyparis lawsoniana) – pathogen,
  • tanoak (Notholithocarpus densiflorus) – pathogen,
  • butternut (Juglans cinerea) – pathogen,
  • eastern hemlock (Tsuga canadensis) – insect,
  • white ash (Fraxinus americana) – insect,
  • black ash (F. nigra) – insect, and
  • green ash (F. pennsylvanica) – insect.
emerald ash borer – cause of threat to five of the “top 15”

Four host families are at the highest risk to alien pests, as measured by both the numbers of tree species affected and by the most host/agent combinations – Fagaceae (oaks, tanoaks, chestnuts, beech); Pinaceae (pines); Sapindaceae (soapberry family; includes maples, Aesculus (buckeye, horsechestnut); Salicaceae (willows, poplars, aspens). The authors point out that these families comprise the most tree species in North America and that the species are widespread.

The families under greatest threat varied somewhat when measured by the severity of the host/pest threat. While Fagaceae was still at greatest risk, and Sapindaceae was still in the top four, Ulmaceae (elms) and Oleaceae (includes Fraxinus) replaced pines and willows.

Analyses addressing all the pests found geographic “hotspots” only in the West. Analyses addressing non-native pests, based on their current extent, also resulted in Western areas appearing at highest risk. However, analyses addressing non-native pests but assuming that these pests had spread to the full extent of their hosts revealed “hotspots” in the Northeast and Great Lakes States.  The Southeast is consistently a “coldspot” – clearly the near extirpation of one understory tree – redbay – is not sufficient to affect top-level data.

Note that none of the maps in the article shows all exotic pests separately from native pests; even the map in Figure 4b illustrates non-native insects only. Dr. Potter has told me that it proved too difficult to determine the origin of many pathogens (K. Potter pers. comm. April 2019).

Setting Conservation Priorities

In a second publication, Potter Escanferla, Jetton, Man, and Crane (2019b) applied the severity ranking for host-pest relationships to set priorities for conservation actions targetting the host – especially conservation of genetic diversity and implementation of programs aimed at enhancing hosts’ resistance to the pest through breeding.

They created 11 classes of species based on three factors:

  • each tree species’ exposure to an extrinsic threat – as measured by the extent to which a threat could diminish a species’ adaptive genetic variation;
  • each tree species’ sensitivity to the threat – as indicated by the species’ rarity, and size of range, or the degree to which a species’ total genetic resource base is susceptible to a threat; and
  • each species’ ability to adapt to the pest threat – as determined by extent to which a species is unable to adapt, through micro-evolutionary change and phenotypic plasticity; unable to maintain evolutionary resilience

(These definitions are taken from Potter, Crane, and Hargrove 2017; reference below)

The highest ranked species (in three classes) are the 15 listed above.

How to Use These Data / Findings

The purpose of the CAPTURE project is to guide USDA Forest Service prioritization of forest tree species and populations for genetic conservation and monitoring efforts. It began as a response to a request from the National Forest System regional geneticist in the Southern Region (Region 8); it was then expanded to the entire country – including Puerto Rico, the Virgin Islands, and Hawai`i. (Dr. Potter told me that he has most of the data needed for Hawai`i, but is still collecting data for the Caribbean. He still needs to query experts in order to customize the framework for the two regions.) 

Now that the project has set priorities for continental species, it will be interesting to see the extent to which these findings guide actual allocation of resources. For example, will additional resources be assigned to protecting such non-commercial species as Florida torreya and redbay? Will existing resistance breeding efforts – which mostly struggle to obtain funding – now have better access to funds?

The Forest.Health project – which promotes use of biotechnology to breed resistant hosts – has adopted the priority list.

Potter et al. 2019b call also for incorporating their findings into regular national reports such as those issued per the Resources Planning Act Assessment and the National Report on Sustainable Forests. These data are essential to assessing the degree to which U.S. forests can continue to meet demand for a broad range of goods and services, safeguard biological diversity, and contribute to the resilience of ecosystems and economies.  

I hope that the data on regeneration, growth, and succession of individual species compiled by Morin, et al., — which are not part of the CAPTURE project — would also be included in such reports.

I applaud these studies and hope they will prove influential. They avoid some of the flaws in other priority-setting processes, which tend to focus on species with commercial value. However, I would like to suggest that some other factors should also be included in calculating priorities:

  • Are some host species especially significant in their ecosystems? That is:
    • Do some create unique biomes, e.g., hemlocks in stream valleys in the middle and southern Appalachians; Fraser fir (and red spruce) on southern Appalachian mountain tops; black ash in wooded swamps from Minnesota to New Brunswick; Port-Orford cedar as part of the unique flora of the serpentine soils of the Siskiyou Mountains; whitebark pine at high elevations of Western mountains.
    • Are some hosts important providers of rare resources, e.g., hard mast – tanoak in California coniferous forests, beech in northern part of its range, whitebark pine at high elevations. Or calcium to the leaf litter and soil – e.g., dogwoods.
    • Are particularly high numbers of faunal species associated with the host? Or rare fauna?
  • Should pests that threaten entire genera – or monotypic genera – receive a higher priority? E.g., emerald ash borer threatening Fraxinus; Phytophthora ramorum threatening tanoak?

SOURCES

Guo, Q., S. Feib, K.M. Potter, A.M. Liebhold, and J. Wenf. 2019. Tree diversity regulates forest pest invasion. PNAS.  www.pnas.org/cgi/doi/10.1073/pnas.1821039116

Morin, R.S., K.W. Gottschalk, M.E. Ostry, A.M. Liebhold. 2018. Regional patterns of declining butternut (Juglans cinerea L.) suggest site characteristics for restoration. Ecology and Evolution.2018;8:546-559

Morin, R. A. Liebhold, S. Pugh, and S. Fie. 2019. Current Status of Hosts and Future Risk of EAB Across the Range of Ash: Online Tools for Broad-Scale Impact Assessment. Presentation at the 81st Northeastern Forest Pest Council, West Chester, PA, March 14, 2019

Potter, K.M., B.S. Crane, W.W. Hargrove. 2017. A US national prioritization framework for tree species vulnerability to climate change. New Forests (2017) 48:275–300 DOI 10.1007/s11056-017-9569-5

Potter, K.M., M.E. Escanferla, R.M. Jetton, and G. Man. 2019a. Important Insect and Disease Threats to United States Tree Species and Geographic Patterns of Their Potential Impacts. Forests. 2019 10 304.

Potter, K.M., M.E. Escanferla, R.M. Jetton, G. Man, and B.S. Crane. 2019b. Prioritizing the conservation needs of United States tree species: Evaluating vulnerability to forest insect and disease threats. Global Ecology and Conservation. (2019)

New Study of Why People Move Firewood – and Its Relation to EAB Deregulation

We know that people moving firewood long distances is cause for great concern because of the likelihood that tree-killing pests will be transported to new and previously uninfested locations. This concern has been heightened by the USDA APHIS proposal to deregulate the emerald ash borer (EAB). As the principal federal “quarantine pest” transported by firewood, the EAB provides the legal foundation for most federal and state firewood regulations. (Of course, the EAB regulations also govern other articles that could transport wood-boring pests). (See earlier blogs here and here.)

Most forest pest professionals agree that the greatest risks are associated with individuals who transport firewood for recreational camping or summer homes. These people have proven to be the most difficult to regulate and the most likely to not see – or to ignore – messages intended to discourage them from moving firewood. The Nature Conservancy manages the “Don’t Move Firewood” program. It has done polling on messages and impact and concludes that the percentage of U.S. voters who have heard a “don’t move firewood” message remains steady and that those who have heard that message are less likely to transport firewood, especially over distances greater than 50 miles. More details are here

A recently published study by several academics and one forest service scientist reinforces The Conservancy’s earlier conclusion about the importance of outreach efforts as an essential component of programs intended to manage wood-boring pests. On the other hand, the new study points to additional nuances in crafting messages that will be effective in changing people’s behavior.


Findings


Daigle et al. 2018 (see full citation at the end of the blog) surveyed 272 people who were camping in public (state) or private campgrounds in three New England states in 2013 – four years after each of those states adopted regulations prohibiting out-of-state firewood and began their outreach efforts. Some campers apparently feel a strong connection to the place they are visiting, as shown by the fact that 84% of the 79 campers at private campgrounds had spent two or more nights camping in the same state in the previous year. That emotional connection might provide a motivation that could be activated to persuade those campers to stop transporting firewood (see below).

The authors found that slightly more than 25% of the 272 respondents reported that they often or always brought firewood from home for camping. More discouraging is that they found that people might not comply even when informed about the risks. Instead, compliance depended largely on the individual’s motivation and commitment level rather than knowledge. Worse yet, campers categorized as “highly involved” in the forest pest issue were just as likely to transport firewood from home as were others. Apparently, these non-compliant campers did not fully “connect the dots” between their concerns about forest health and their own actions. See below for Daigle et al.’s suggestions for ways to help people make those connections.

To understand the role of motivation, Daigle et al. tried to assess the strength of each camper’s beliefs about the relationship between tree-killing pests and the transport of firewood by recreational campers.

Overall, 25% of respondents were very highly involved with tree pest issues; another 22% were highly involved. Respondents’ perception of the relationship between damaging tree pests and transport of firewood differed significantly based on their levels of involvement. Respondents with a low level of involvement were less likely to agree with three statements (listed below) that firewood-associated pests pose a serious threat. Campers with very high levels of involvement strongly disagreed with three other statements that either downplayed the threat or portrayed the respondent’s compliance as “useless” as long as others continue to transport firewood.

Perception questions against which respondents’ agreement or disagreement was measured:

  • “There is not much one individual can do about invasive pests brought in by firewood”
  • “I don’t think invasive pests brought in by firewood are very important.”
  • “The threat of invasive pests brought in by firewood is serious.”
  • “As long as other people continue to bring firewood from home, my efforts to prevent invasive pests are useless.”
  • “The invasive forest pest risk from firewood is exaggerated.”
  • “In the long run, things will balance out with invasive pests.”


Rationale

Respondents’ most frequent explanations for why they take firewood from home when they go camping were cost, quality, and convenience. The most frequently cited reason for not transporting firewood was that the respondent knew that it was not allowed.

Level of pest awareness:

While nearly all respondents (92%) had heard something about non-native pests killing trees, but 57% could not recall the name of a specific pest in the absence of a prompt. When asked about the emerald ash borer and Asian longhorned beetle, more respondents had heard about the ALB (77% v. 52%). Most said the principal source of information was a state agency.


Suggested Actions

Daigle et al. conclude that authorities need to increase citizens’ exposure to outreach materials in order to activate concern and bring about desired actions to curtail risk of pests in firewood.

One clear need is to counter many campers’ belief that their wood is safe so it is okay to transport it regardless of the regulations. Often they based that belief on the fact that their home is not in a designated quarantine zone. Daigle et al. suggested that educational material should try to counter this belief by emphasizing the time lag between a pest’s establishment and its detection.

To help “connect the dots” between campers’ concerns about forest health and the implications of their actions (transporting firewood), survey respondents suggested using more visuals showing the destruction caused by the invasive forest pests, especially in areas they care about – close to home or favorite recreation areas. Daigle et al. thought such pictures would “help the campers with high involvement to trigger activation of attitudes with the association of forest pests and firewood transport.”

Other suggestions for strengthening outreach were to ensure that the message

  • Is novel – that it does not simply reiterate a camper’s initial belief system.
  • Produces agreement by the recipient without generating counterarguments.
  • Is relevant to the audience’s concerns.

They also suggested that campgrounds (public and private) help motivate campers to leave firewood at home by coordinating with local firewood vendors to provide competitively priced firewood at the campground or by including the cost of providing some firewood in the camping fee.

Daigle et al. made two other suggestions that call for stronger actions.

First, they suggested that outreach programs incorporate incentives or rewards to engage people who don’t have a high level of involvement in forest health issues.

Second, they suggested that authorities reinforce the educational message by using “more direct” actions, such as

  • confiscating illegally transported firewood at check stations,
  • issuing warnings about such actions, or
  • administering fines for moving non-compliant firewood.

The authors suggest that state agencies should consider taking these actions – but I see no reason why federal agencies should not also.

EAB; David Cappaert

Conclusions re APHIS’ Proposal to Deregulate EAB

Daigle et al. conclude that outreach efforts aimed at curtailing movement of firewood need to be continued. They are a critical component of overall management programs targetting non-native tree-killing pests – programs developed through decades of research and trials. The motive is clear: more effectively delaying these pests’ spread provides large benefits to municipalities and homeowners.

These are the same points made by many who opposed APHIS’ proposal to deregulate the emerald ash borer.

In its comments to APHIS, The Nature Conservancy noted that the domestic EAB quarantine had been effective in limiting spread of the pest through two of the most important pathways – firewood and nursery stock. The resulting slower spread had protected three-quarters of the ash range in the United States and bought time to develop mitigation measures.

Further, eliminating the federal quarantine would not only unleash this pathway for long-range movement of EAB but undermine the many federal, state, regional, tribal, private, and non-profit  partners’ efforts to curtail movement of all invasive forest pests in firewood.

Many other commenters, including several state agencies, the National Association of State Foresters and Southern Group of State Foresters called for APHIS to continue leading national efforts to curtail spread of EAB and other pests through careless movement of infested firewood. The Montana Department of Natural Resources and Conservation and NASF specifically urged that APHIS reinstate the National Firewood Task Force (which APHIS led in 2009-2010).

The Don’t Move Firewood program has a more informal blog on this topic, available here.


Source

Daigle, J.J., C.L. Straub, J.E. Leahy, S.M.De Urioste-Stone, D.J. Ranco, N.W. Siegert. How Campers’ Beliefs about Forest Pests Affect Firewood Transport Behavior An Application of Involvement Theory. Forest Science XX(XX):1-10  https://academic.oup.com/forestscience/advance-article/doi/10.1093/forsci/fxy056/5232804


South African report: Rigorous, Honest, and a Model for U.S. and Others

Density of invasive plants in South Africa

map available here


Last month, in my blog about the US Geological Survey’s report on invasive species  I announced release of a report by South Africa on its invasive species management programs – available here.  Because this report is unusual in both its rigor and its honesty, I’m returning to it here. I think it is a model for our country and others.

The report provides the basics. That is, it analyzes pathways of introduction and spread; number, distribution and impact of individual species; species richness and abundance of alien species in defined areas; and the effectiveness of interventions. Of the 775 invasive species identified to date, 556, or about 72%, are listed under some national regulatory program. Terrestrial and freshwater plants number 574 species; terrestrial invertebrates number 107 species. A different set of 107 species, or about 14%, are considered by experts to be having major or severe impacts on biodiversity and/or human wellbeing. The highest numbers of alien species are in the savanna, grassland, Indian Ocean coastal belt, and fynbos biomes. South Africans are particularly focused on the reductions in surface water resulting from plant invasions. Much of the control effort is under the egis of the decades-old “Working for Water” program.

Also, the report has features that are all-too-rare in work of its kind. First is the authors’ focus on rigor – of data sources and interpretation of those data using standardized criteria. Second – and even more important – is their call for analyzing the efficacy of the components of invasive species program. They insist on the need to measure outcomes (that is, results), not just inputs (resources committed) and outputs (“acres treated”, etc.). Inputs are far easier to measure and are, unfortunately, the mainstay of how most U.S. efforts are tracked – if they are tracked at all.

As they note, measure of inputs and outputs are not useful because they provide no guidance on the purpose of the action or treatment or of its effectiveness in achieving that purpose.

(For earlier CISP advocacy of measuring outcomes, visit the National Environmental Coalition on Invasive Species and read the bullet points under “Recommendations for a Comprehensive National Response”.)

The report has been praised by international conservationists, including Piero Genovesi – chair of the IUCN’s Invasive Species Specialist Group. British ecologist Helen Roy says that, to her knowledge, it is “the first comprehensive synthesis of the state of invasive species by any country.”


How well are programs working?

The authors’ focus on rigor includes being scrupulously honest in their assessments of current program components. They note deficiencies and disappointments, even when the conclusions might be politically inconvenient. To be fair, all countries struggle to achieve success in managing bioinvasions. And South Africa is, in many ways, a developing country with a myriad of economic and social challenges.

So it is probably not surprising that, for most factors analyzed, the authors say data are insufficient to determine the program’s impact. Where data are adequate, they often show that programs fall short. For example, they conclude that control measures have been effective in reducing populations of established invasive species, usually plants, in some localized areas but not in others. While the situation would arguably have been worse had there been no control, current control efforts have not been effective in preventing the ongoing spread of IAS when viewed at a national scale. Only one of South Africa’s 72 international ports of entry has consistent inspection of incoming air passengers and cargo – and even those inspections are not carried out outside of regular working hours (e.g., nights and weekends).

The authors are even critical of the “Working for Water” program – which is the basis for most control efforts in South Africa and enjoys wide political support. WfW has two goals: providing employment and development opportunities to disadvantaged individuals in rural areas, and managing invasive alien plants. Despite substantial funding, the WfW program has supported control teams that have reached only 2% – 5% of the estimated extent of the most important invasive plants. Furthermore, programs structured to provide employment have not ensured use of the most efficient control strategies.


What’s needed in South Africa — and around the world

The authors conclude that South Africa needs new processes to monitor and report on bioinvasions in order to achieve evidence-based policy and management decisions. They call for (1) more research to determine and assess invasive species impacts; (2) better monitoring of the effectiveness of current control measures; and (3) the development of methods to look at the impact of bioinvasions and their management on society as a whole.

The authors say it is important for South Africa to improve its management of invasive species because their impacts are already large and are likely to increase significantly. They note that improving management efficiency will require difficult choices and trade-offs. They recommend a focus on priority pathways, species, and areas. They also stress return on investment.


I don’t know how this report has been received in South Africa. I hope government officials, media observers, landowners, political parties, and other stakeholders appreciate the honesty and expertise involved. I hope they take the analyses and recommendations seriously and act on them.

(Preparation of the report was was overseen by a team of editors and contributing authors employed by the South African National Biological Diversity Institute (SANBI) and the DST-NRF Centre of Excellence for Invasion Biology at (C.I.B). Drafts were widely circulated to contributing authors and other stakeholders for comments. An independent review editor will be appointed to assess the review process and recommend any ways to strengthen the process for future reports.)


Meanwhile, how do we Americans apply the same rigor to analyzing our own efforts?


Posted by Faith Campbell


We welcome comments that supplement or correct factual information, suggest new approaches, or promote thoughtful consideration. We post comments that disagree with us — but not those we judge to be not civil or inflammatory.


Report Lists Non-Native Species in the U.S.

Ailanthus altissima

Several scientists at the United States Geological Service (USGS) have published a report and accompanying datasets that attempts to provide a publicly accessible and comprehensive list of non-native species established in United States.

Led by Annie Simpson and Meghan C. Eyler, a team of six scientists worked six years (2013–2018). They reviewed 1,166 authoritative sources to develop a list of 11,344 unique names – most of them binomials (genus and species), a few genera, plus some viruses.

This was a Herculean effort that produced very valuable products. We are all in their dept!

Simpson and Eyler point out that knowing which species are non-native to a region is a first step to managing invasive species. Lists compiled in the past were developed to serve a variety of purposes, including watch lists for preventing invasions, inventory and monitoring lists for research and modeling, regulatory lists for species control, and non-regulatory lists for raising awareness. As a result, they are not comprehensive.

Among the sources these authors consulted in preparing the list were peer-reviewed journal articles, books, brochures, circulars, databases, environmental assessments, technical reports, graduate theses, and websites.

Data – by Region

The report also notes which non-native species were established in each of three regions: the “lower 48” states, Alaska, and Hawai`i. Not surprisingly, more than half the non-native taxa are established in the vast area (nearly 7.9 million km2) comprising the “lower 48” states – 6,675 taxa. Almost half of the total number of non-native taxa have established in the tiny geographic region (only 28,311 km2) of Hawai`i – 5,848 taxa.  One-tenth as many non-native taxa – 598 – are reported as established in Alaska (1.7 million km2).

This report includes taxa that are not native to any part of the specific region, but established (naturalized) somewhere in the region. An “established” species must have at least one population that is  successfully reproducing or breeding in natural systems. The list includes domesticated animals and plants introduced for crops or horticulture when the taxon has escaped cultivation or captivity and become established in the wild. Species listed range from feral hogs (Sus scrofa) to plum pox virus and citrus canker to ohia rust (Puccinia psidii).

Of the total 11,344 taxa, 157 are established in all three regions. These included 125 vascular plants (especially grasses and asters); 13 arthropods, 11 mammals; 6 birds; 3 mollusks; 1 bryozoan. One of the ubiquitous plant species is tree of heaven (Ailanthus altissima). I find it entirely appropriate that the cover photo shows this tree – the photo was taken 8 miles from my home in Fairfax County, Virginia.

Nearly three-quarters (71.4%) of the non-native species in Alaska are plant species. More than half (59.7%) of the non-native species in the “lower 48” region are also plants. Nearly all the remainder of the non-native species in both regions are some kind of animal. Fungi constitute only 1.8% of the non-native species in the “lower 48” region; all the rest of the groups (Bacteria, Chromista, Protozoa, Virus) constitute less than 1% of the non-native species recorded in either region.

By contrast, in Hawai`i, animals make up 69.7% of the listed non-native species; most are invertebrates. Plants constitute 29.8% of the Hawaiian list.

Gaps, by Taxon

The authors recognize that invertebrates and microbes are under-represented because species are still being discovered; non-charismatic and difficult-to-identify species tend to be overlooked; and the species composition of any nation in this era of globalization is constantly subject to change.

I have noted some gaps among the pathogens: the absence of some of the Phytophthora that have been detected infecting shrubs and herbaceous plants in California,  e.g., Phytophthora cambivora, siskiyouensis, tentaculata;  and the “rapid ohia death” pathogens, Ceratocystis huliohia and C. lukuohia. Dr. Simpson is aware of these gaps and is soliciting sources to help add these organisms – especially the various Phytophthora species – to the next version of the list.

Simpson and Eyler note that the relative geographic distribution of the list at its current state seems to reinforce three well established premises: that tropical island systems are particularly vulnerable; that higher latitudes host fewer but are not invulnerable; and that species diversity in general decreases with increasing latitude.

 Comparisons to Other Databases

After standardizing the names in the list by comparing them to the Integrated Taxonomic Information System (ITIS), Simpson and Eyler also reviewed the USGS BISON database, which has more than 381 million occurrence records for native and non-native species in the U.S. and Canada, covering 427,123 different taxa. (The BISON database contains significantly more species occurrences for the U.S. than the largest invasive species database, EDDMapS, which contained 4.4 million species occurrences as of June 2018.) Simpson and Eyler had to evaluate which of these taxa met their definition of non-native, since most species occurrence records in the USGS BISON are not labeled as non-native in the original records.

Comparing the BISON and non-native lists, Simpson and Eyler found that the BISON list contained a larger number of occurrence records for non-native taxa: a total of 13,450,515.However, the BISON list does not provide complete coverage of non-native species: it includes records for 77% of list of non-native species Simpson and Eyler found in Alaska, 75% of the “lower 48” sublist, but only 37% of the Hawaiian sublist.

Simpson and Eyler state their intention to continue updating the list of non-native species, they welcome contributions to it from area experts, and they urge integration of new occurrence data into invasive species database such as EDDMapS.

Indicators of Non-Native Species Richness

Figure 3 in the report (above) maps the number of non-native taxa in BISON at the county level. Figure 4 displays the proportion of non-native to native species in BISON. Higher percentages are generally evident in coastal areas and other regional hotspots. For example, the proportion in Hawaiian counties is greater than 33%. Additional data are needed to perform a more in-depth analysis of non-native species richness and abundance.

UPDATE! New Report in the Works

In June 2021, USGS announced that it was updating its Comprehensive List of Non-Native Species Established in 3 Major Regions of the U.S. so that the document more closely aligns with the parameters of the Global Register of Introduced and Invasive Species. The new USGS dataset is to be called the US Register of Introduced and Invasive Species. The list in the current draft includes 15,364 records. About 500 of these records are in Alaska, 6,000 in Hawai`i, and 8,700 in the conterminous 48 States.

One of the lead authors, Annie Simpson, contacted invasive species experts seeking feedback and suggested additions – based on authoritative resources such as peer reviewed journal articles, pest alerts, databases, books, and technical bulletins. She sought input by 25 July, 2021.

The published version of this dataset will be made freely available on USGS’ ScienceBase (https://www.sciencebase.gov), and all reviewers will be acknowledged in the dataset’s abstract.

SOURCE

Simpson, A., and Eyler, M.C., 2018, First comprehensive list of non-native species established in three major regions of the United States: U.S. Geological Survey Open-File Report 2018-1156, 15 p.

The report and accompanying data tables are available here.

South African report

In an unrelated but similar development, South Africa has issued a report on its invasive species — 2017 The Status of Biological Invasions and Their Management in South Africa. The report analyzes pathways of introduction and spread; number, distribution and impact of individual species; species richness and abundance of alien species in defined areas; and the effectiveness of interventions. The report notes that 775 invasive species have been identified to date, of which 556 are listed under some national regulatory program. Terrestrial and freshwater plants number 574 species; terrestrial invertebrates number 107 species. (This total does not include the polyphagous shot hole borer, which was detected too recently.) 107 species are considered by experts to be having either major or severe impacts on biodiversity and/or human wellbeing. Alien species richness is highest in the savanna, grassland, Indian Ocean coastal belt and fynbos biomes, lower in the more arid Karoo and desert biomes. South Africans are particularly focused on the reductions in surface water resulting from plant invasions. The decades-old “Working for Water” program has two goals: providing employment and development opportunities to disadvantaged individuals in rural areas, and managing invasive alien plants.

The Status of Biological Invasions and Their Management in South Africa is available here.

Posted by Faith Campbell

We welcome comments that supplement or correct factual information, suggest new approaches, or promote thoughtful consideration. We post comments that disagree with us — but not those we judge to be not civil or inflammatory.