The Virginia Invasive Plants Coalition was formed at December 2023. Seventy-six organizations participated in the formative meeting. The Coalition now boasts 113 members. CISP joined the coalition this autumn.
The Coalition’s purpose of is to identify and carry forward statewide efforts to make dramatic progress against invasive plants support the use of native plants. Members work collectively on ten initiatives:
awareness & education;
resource development;
support & implement a Virginia Invasive Species Management Plan;
create or provide expertise, incentives, and access to funds to help private land stewards mitigate invasive species
limit access to invasive plant;
research to identify & address knowledge gaps;
remove invasive plants & restore with native plants;
ensure equitable access;
build collaborative networks;
ensure that Virginia adopts policies that support reduction of invasive plants & reverse the damage they cause
I rejoice that the Coalition explicitly includes advocacy for state-level policy. I wonder whether – over time – VIPC members might consider advocating for more effective federal policies.
I also wonder whether organizations concerned about invasive species have formed similar broad and action-oriented coalitions in other states.
I will focus here on two VIPC efforts.
Virginia State Capitol; photo by Tony Fischer via Flickr
Policy
Virginia currently has two lists of invasive plants. The Department of Agriculture and Consumer Services (VDACS) lists “noxious weeds”. It currently contains 26 species in three tiers. It is illegal to sell species on this list. The Department of Conservation and Recreation (DCR) maintains the Virginia invasive plant list. The list contains 103 species. It includes a list of species identified to spur “early detection”. All noxious weeds are also included on the “invasive” list, but not all “invasive” plants are listed as noxious weeds.
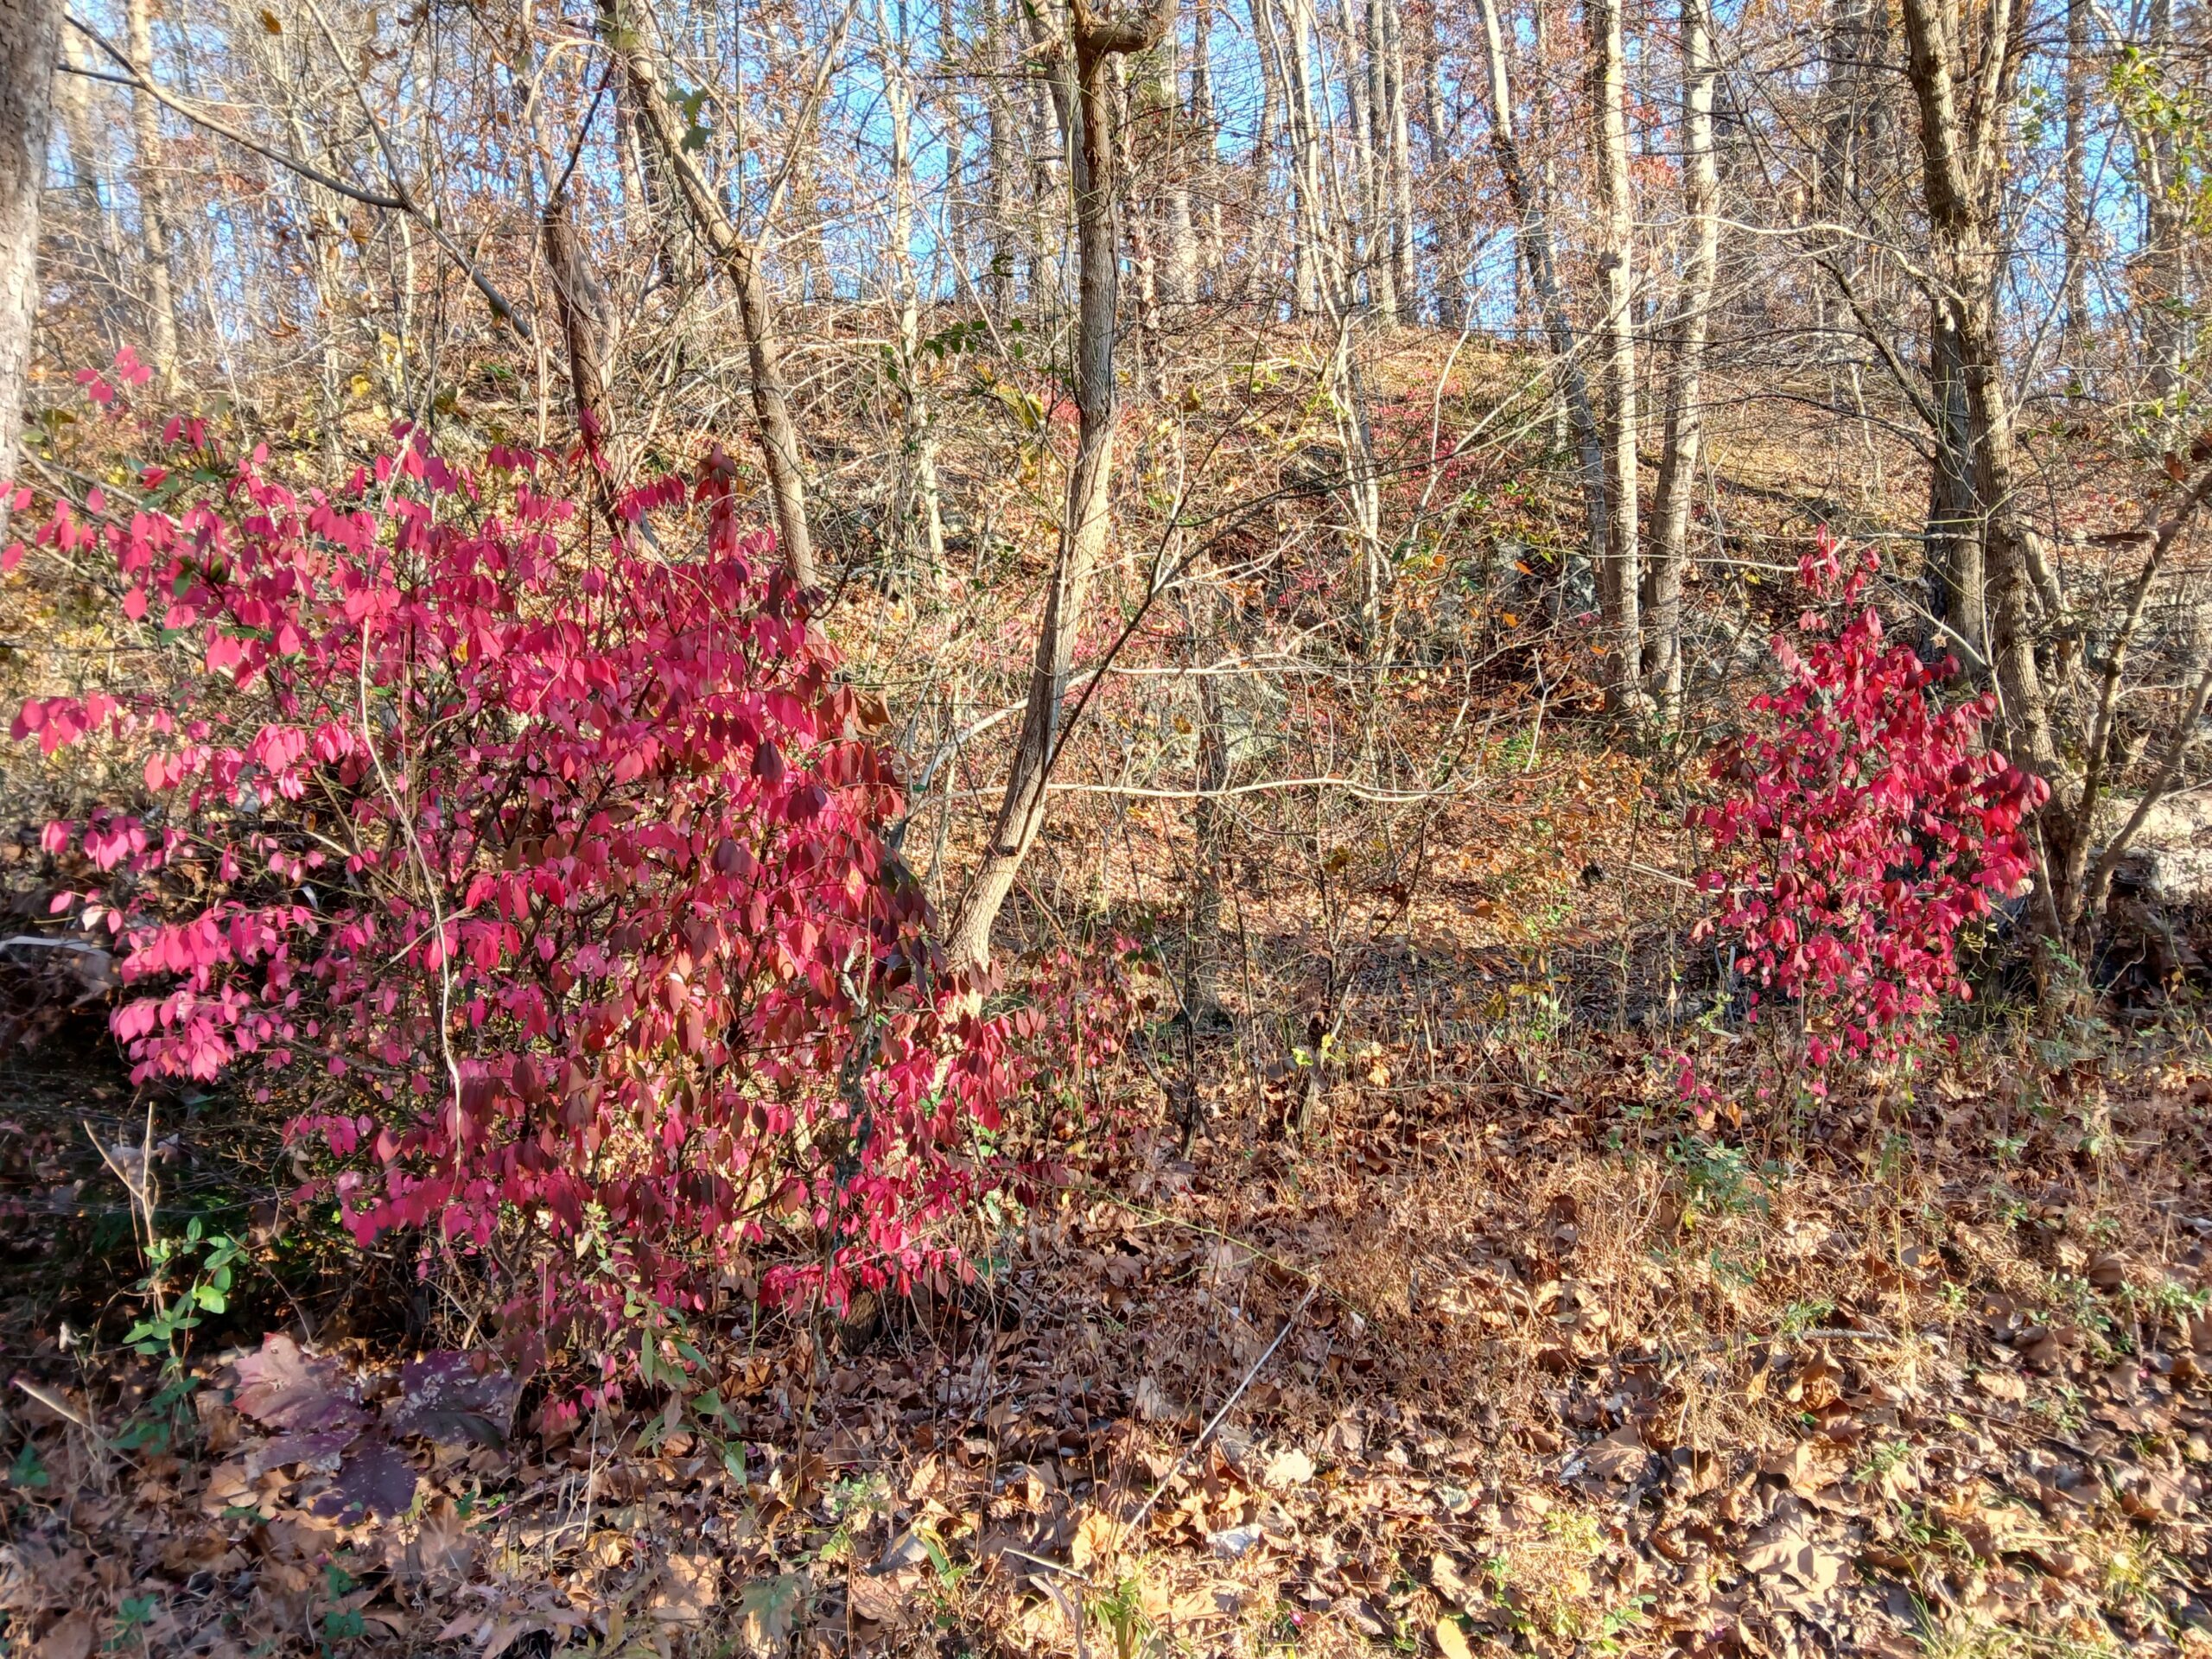
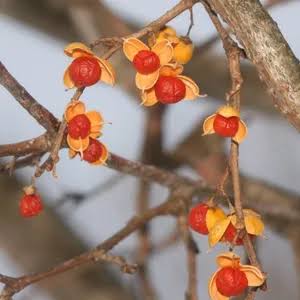
burning bush – on the DCR invasive plant list but not the VDACS noxious weed list; photo by F.T. Campbell in Fairfax County, Virginia
VIPC is a member of the Virginia Conservation Network. This coalition has developed a conservation agenda for 2027; the agenda has four categories: water; land & wildlife conservation; climate & energy; land use & transportation. “Preventing harm from invasive plants” is included under the “Native habitats & species” chapter.
In 2026 the state legislature adopted four laws that:
a) added invasive plant management to the powers of service districts; [A “service district” is a defined geographic area within a local government established to provide additional, more complete, or more timely governmental services than those generally provided to the rest of the locality];
b) removed the “commercial viability” loophole from the state’s noxious weeds law;
c) required Virginia’s Department of Transportation to create a plan for managing invasive plants along public roadways; &
d) allowed volunteers to use herbicides on state-owned public lands when under supervision of a licensed commercial pesticide applicator.
Legislation also now requires retail outlets to place warning signs near each invasive plant species offered for sale (effective January 2027); partially funds the Virginia Invasive Species Management Plan; prohibits state agencies from planting, selling, or propagating invasive plants; requires tradespersons to provide written notification to property owners for all plants proposed for installation that are included on the list of invasive plants; & allows localities to permit the supervised use of herbicides by volunteers on public lands.
The Virginia Conservation Network considers these actions to be too limited. The VIPC asks its member organizations to advocate for
Require property sellers to disclose the presence of Japanese knotweed (Reynoutria /Fallopia japonica or Polygonum cuspidatum) on a property they are selling because it can disrupt underground infrastructure.
Tightening label language regarding whether a plant is “sterile”.
Require those clearing property for development to plant cover crops to forestall weed invasions if there is a delay in further work.
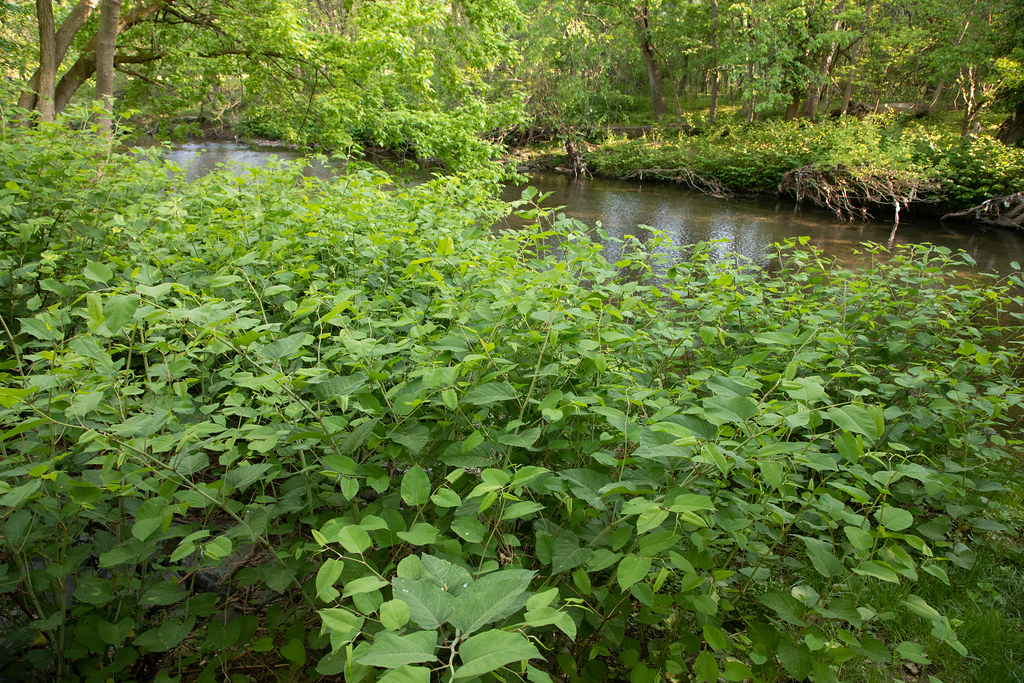
Japanese knotweed; photo by Will Parson, Chesapeake Bay Foundation
Perhaps in future the Network might broaden members’ concern about the loss of forest canopies to include insects and pathogens that kill trees?
2) Surveying nurseries to find those selling invasive plant species.
VIPC members carried out surveys in 2025 and again in 2026. The 2026 surveyors visited 122 nurseries in 60 locations across the Commonwealth. This was 42% more retailers than the 2025 survey. One-third of the nursery locations were in the Northern Virginia suburbs of Washington, D.C.
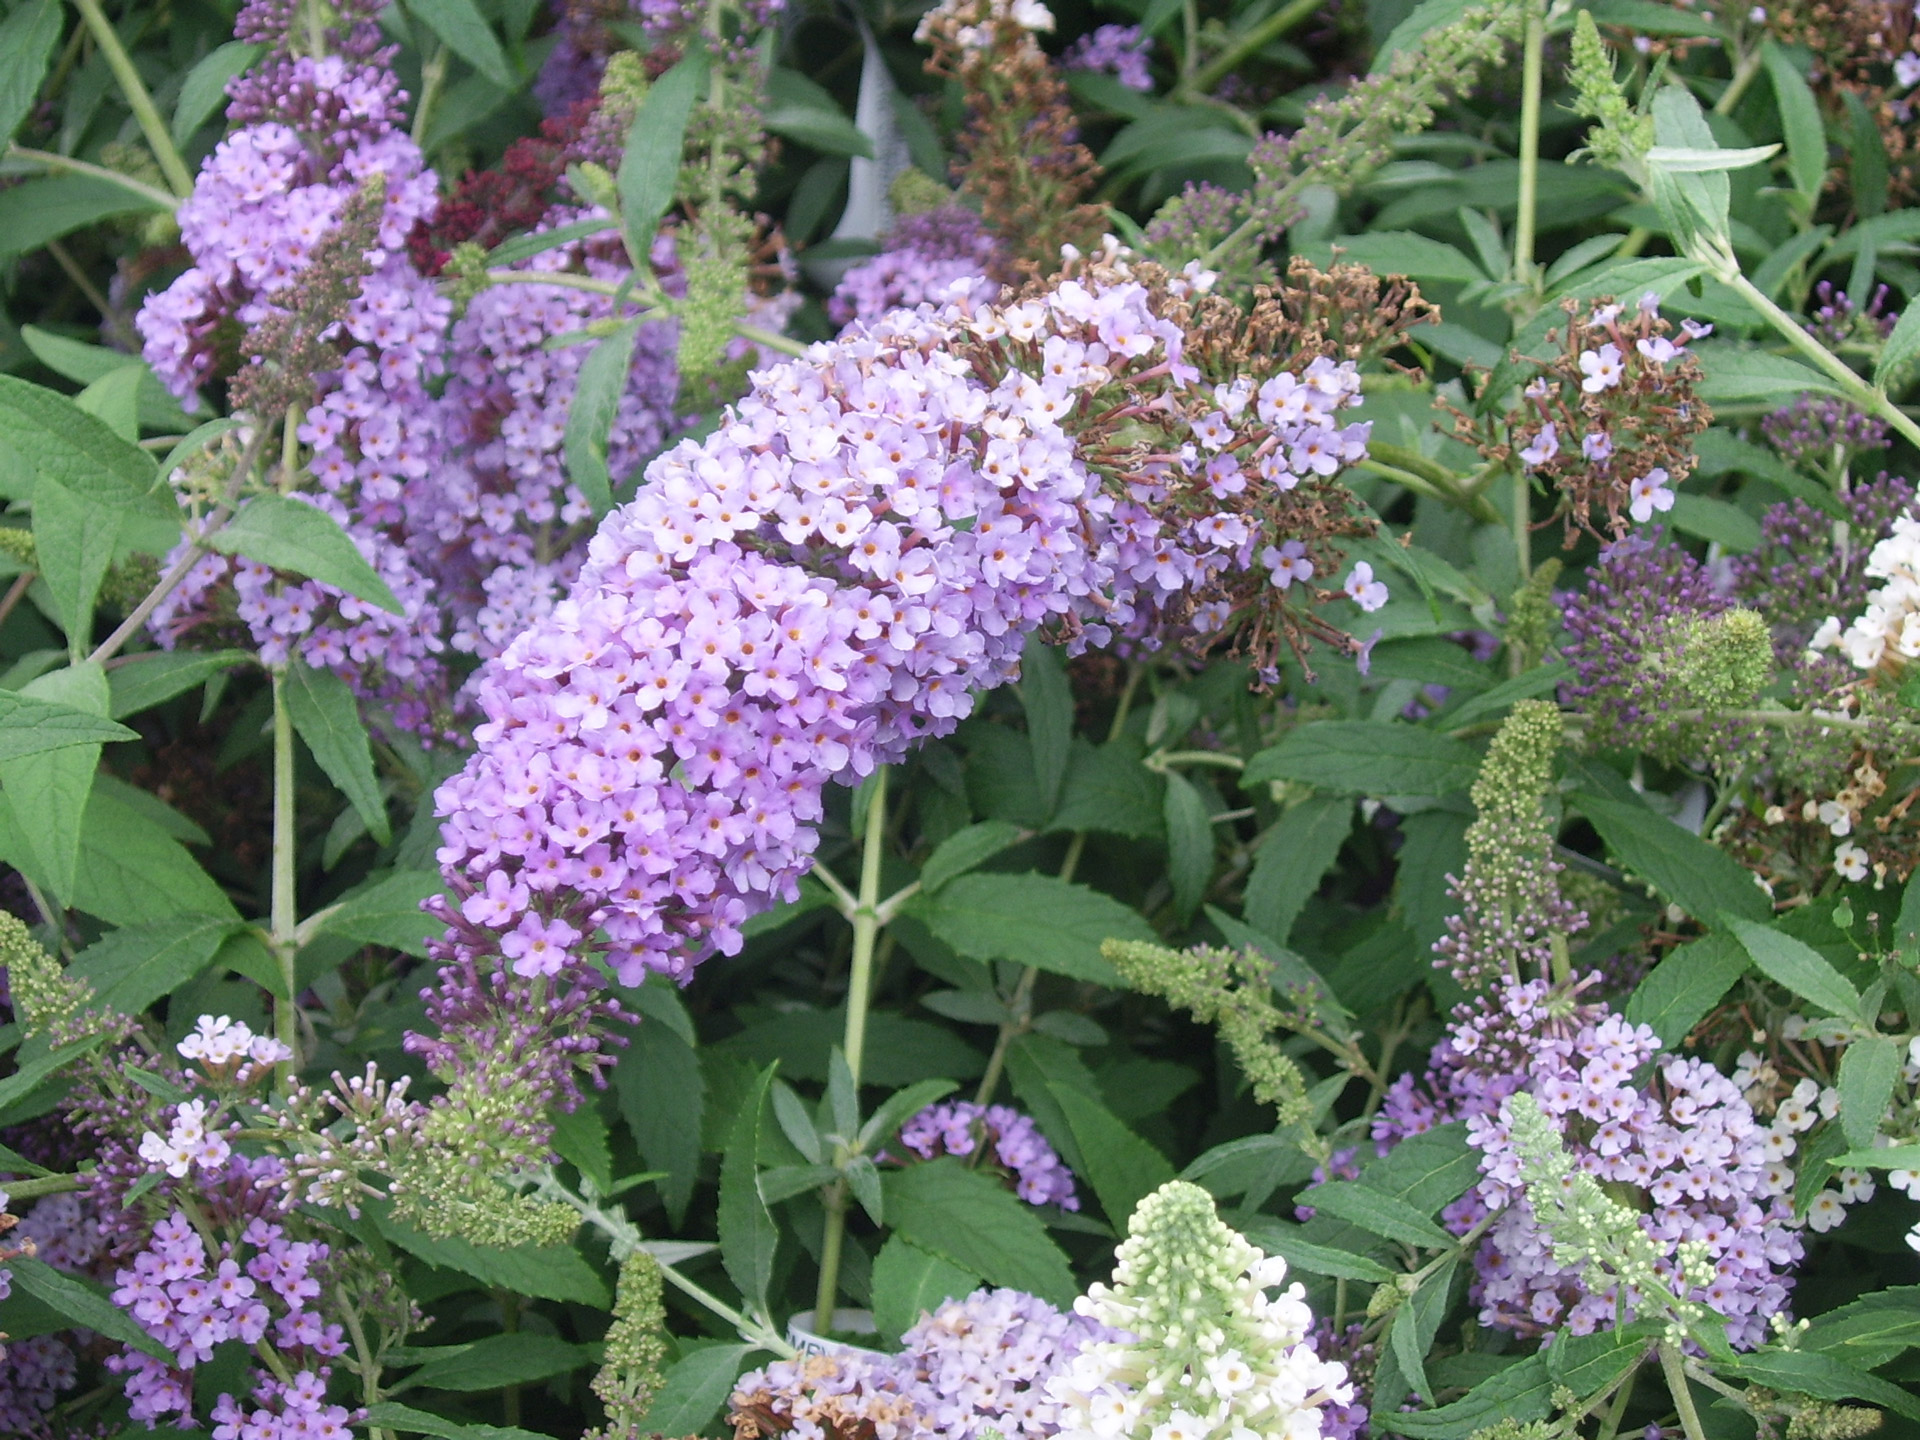
butterfly bush Buddleyadavidii; photo from Free Public Images
The 2026 surveyors found a 23% decrease in invasive plant species being offered per retailer. Twelve percent of the garden centers had no invasive species for sale. This was more than triple the number found during 2025. However, one garden center was selling 24 of the 39 invasive plant species. The most commonly detected invasive species are:
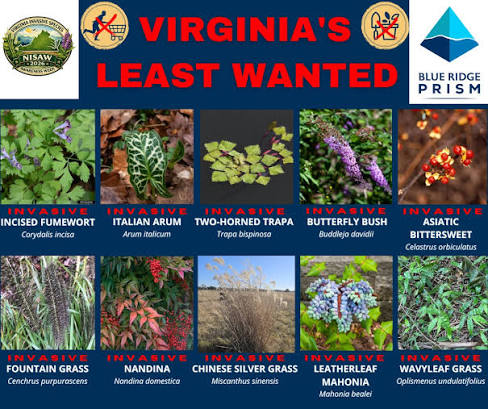
butterfly bush — found during 95 visits; [see Douglas Tallamy on why butterfly larvae cannot use this plant.]
species found during 58 to 79 visits were nandina, English ivy, periwinkle, moneywort, and Japanese barberry;
Japanese spirea and burning bush were found during 45 or 44 visits;
Two ornamental grasses, Chinese silvergrass and fountain grass, were found during 30 or 29 visits;
species found during 19 to 16 visits were greater periwinkle, leatherleaf mahonia, Chinese privet, and winter creeper;
species found during eleven to eight visits were Chinese wisteria, mimosa, water hyacinth, yellow flag, sweet autumn clematis, and border privet;
species found during five or four visits were creeping Charlie, Callery pear, golden bamboo, and Norway maple.
Invasive species found at a smaller percentage of Virginia garden centers in 2026 than in 2025 were butterfly bush, nandina, English ivy, periwinkle, greater periwinkle, Chinese privet, winter creeper, sweet autumn clematis, border privet, Callery pear, and linden arrowwood.
Invasive species found at a higher percentage of retailers in 2026 than in 2025 were moneywort, Japanese spirea, Chinese silvergrass, mimosa, water hyacinth, yellow flag, and Japanese honeysuckle (Lonicera japonica). The last species is on the Virginia Noxious Weeds List, so sale is illegal.
Invasive species found at the same percentage of Virginia garden centers in 2026 as in 2025 were Japanese barberry, burning bush, fountain grass, leatherleaf mahonia, Chinese wisteria, creeping Charlie, golden bamboo, Norway maple, five-leaf akebia, parrotfeather beefsteak plant, Italian arum, white mulberry, Chinese tallow-tree, and trifoliate orange.
Invasive species not found offered for sale by surveyed garden centers in 2026 were Amur honeysuckle*, Autumn olive*, Brazilian waterweed, cinnamon vine, cogon grass*, crown-vetch, incised fumewort*, marsh dewflower, Morrow’s honeysuckle, Oriental bittersweet*, porcelain-berry*, purple loosestrife, ravenna grass, royal paulownia, shrubby bushclover*, Siberian elm, tartarian honeysuckle, thorny olive, tree-of-heaven*, wineberry, and winter honeysuckle. (*indicates plants listed on the Virginia Noxious Weeds List.)
oriental bittersweet; on Virginia’s noxious weed list (tier 3); Picture This
Posted by Faith Campbell
We welcome comments that supplement or correct factual information, suggest new approaches, or promote thoughtful consideration. We post comments that disagree with us — but not those we judge to be not civil or inflammatory.
For a detailed discussion of the policies and practices that have allowed these pests to enter and spread – and that do not promote effective restoration strategies – review the Fading Forests report at http://treeimprovement.utk.edu/FadingForests.htm
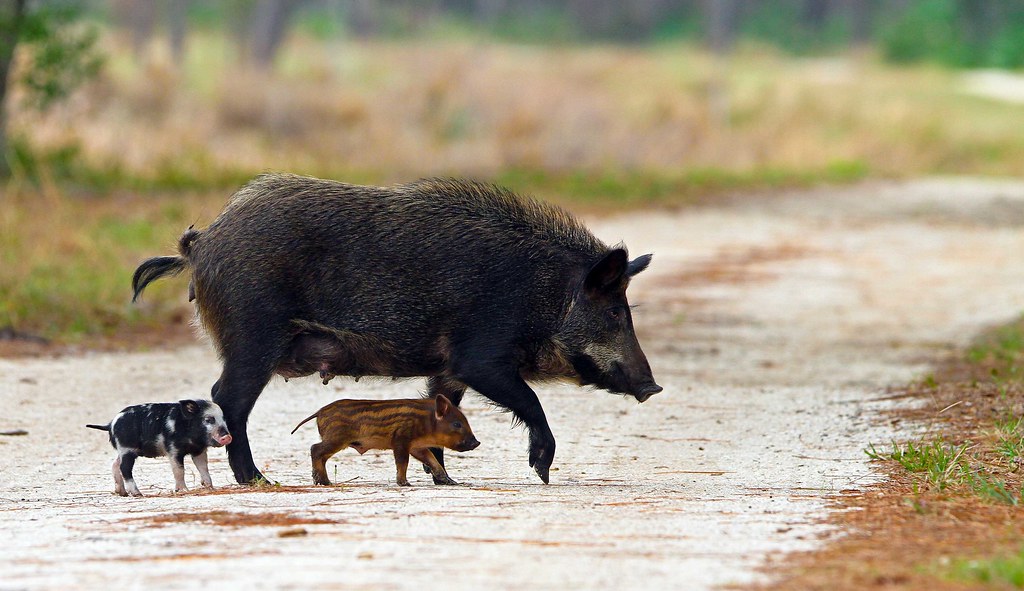
feral hogs — one the invasive species on which state approaches vary; photo by Creg Oneal via Flickr
Several groups of scientists are addressing systemic problems that impede efforts to counter bioinvasions. One of those problems is the lack of a consistent approach in federal systems.
Drake et al. (2026) (full citation at the end of this blog) evaluate the impacts of this situation in the United States where – they argue – the national government has been slow to adopt overarching policies and provide adequate and dependable funds to implement them. The result is a patchwork of varying – even clashing – regulations and differing levels of effort that undermine program efficacy. Conflicting approaches add to such well-known challenges as limited budgets and evolving goals. They recommend applying such existing frameworks as the National Invasive Species Council’s (NISC) Early Detection / Rapid Response framework or One Biosecurity to facilitate integration and cooperation among the large variety of sectors affected. (NISC’s purpose is to coordinate federal agencies’ programs. The Council has no official role vis a vis state programs. Still, there is no legal impediment to states adopting any NISC approach which they consider appropriate.) At the same time Drake et al. (2026) warn against imposing too great uniformity or lacking flexibility.
I regret that Drake et al. (2026) do not mention the National Plant Board. The NPB focuses on managing plant pests (insects, pathogens, etc.) and invasive plants. The NPB recently celebrated its centennial anniversary. States have created fora under the NPB in which they exchange experiences with the goal of coordinating their efforts.
With respect to animal invaders (other than plant pests) or disease or parasite threats to animals, I believe there is no equivalent to the NPB. The Association of State Wildlife Agencies (AFWA) has an invasive species committee which discusses issues of general concern (see agenda from one of its meetings here). This effort is much more recent than the NPB. It is similar in that it is consultative, with no authority to enforce a common approach.
Findings
Drake et al. (2026) explore the extent to which American states apply similar vs. different approaches to managing invasive species as a group and plants, invertebrates, and vertebrates separately. Lack of data forced them to exclude fungi and other microorganisms. They focused on 21 contiguous states in the eastern part of the country. They also compared the states’ lists of regulated species to national lists of invasive species compiled by the United States’ Register of Invasive and Introduced Species (US-RIIS) (Simpson et al., 2022; Simpson and Eyler, 2018) and U.S. Geological Survey Non-indigenous Aquatic Species database (NAS; U.S. Geological Survey, 2023).
A literature search revealed 1,117 state statutes, regulations, and similar policy documents that pertain to invasive species. One third of these documents (n = 448) named at least one taxon at the genus or species level. Of these, 35.3% named one or more plant species; 19.9% named one or more invertebrate; and 44.8% named vertebrates. Overall, 60.5% of these species were listed by only one state. Viewed by taxonomic group, this broke down to 40.6% of plant species, 60.6% of invertebrates, and 56.4% of vertebrates. Only four species are regulated in all 21 states = western (European) honeybee (Apis mellifera); and three agricultural weeds, creeping thistle (Cirsium arvense), quackgrass (Elymus repens), and dodder (Cuscuta species).
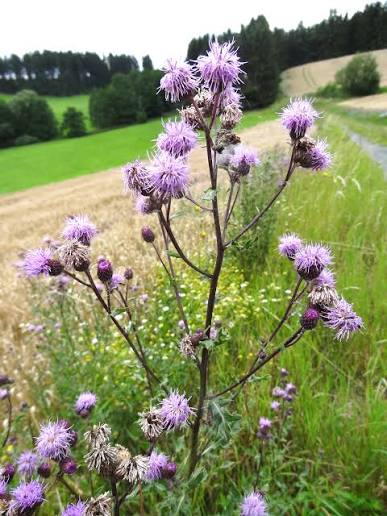
Cirsium arvense; photo by USchmidt via WikiMedia
Drake et al. (2026) found neighboring states did not share similar species lists or approaches. Consistency was even less at the regional scale, particularly when managing invasive invertebrates or vertebrates. The absence of a unified approach means that proactive states are susceptible to invasion from neighboring states which take a less vigorous stance. Since managing invasive species becomes more difficult and costly as the invasion progresses, undermining proactive policies undercuts efficiency.
Even when the national government does act, it lacks a unified approach. No federal legislation mandates a central authority to direct and implement IAS detection and response. The National Invasive Species Council (NISC), established by Executive Order 13112 in 1999, is supposed to provide high-level leadership to help overcome barriers to communication and promote collaboration among the several federal agencies bearing responsibility for various aspects of the issue. Authors, e.g., Reaser, Simpson, et al. (2020); Simberloff et al. (2020), say NISC’s effectiveness has been undermined by inconsistent funding and vacillating political support from policy-level leaders.
Drake et al. (2026) also assessed which of the 21 states took action proactively. Two plant species were listed by name by all 21 states: quackgrass (Elymus repens) and creeping thistle (Cirsium arvense). They called three states (14.3%) “pro-active” because they regulated quackgrass before it was detected in the state. Four states (19%) did the same regarding creeping thistle. The one invertebrate species listed by all 21 states, the western (European) honeybee, was established in these states before they began addressing invasive species, so it is not a test of states’ forethought.
Of course, the policy goals differ between the two plant species and the honeybee: the former are considered damaging so policies focus on their control and management, whereas the honeybee is valued for pollination and honey production so policies aim at protecting it. There is no federal legislation regulating Apis mellifera individuals already in the country. State regulations governing interstate movement are the usual jumble of approaches. Drake et al. (2026) says this lack of consistency can increase the risk that introduced pathogens, pests, and undesirable subspecies (i.e., “Africanized” bees) will spread. They note that this chaos reigns despite bees’ importance to the agricultural sector.
Florida had policies governing the most species (345), Vermont the least (67). More surprising to me, New York regulated the most plant species (161); Mississippi the most invertebrates (105), and Virginia the most vertebrates (189).
Collectively the states regulate three times more species than appear on either national registry: 1,862 species in the state database versus 630 in US-RIIS or NAS databases. The states regulated a proportionally larger number of plant species and much smaller proportion of vertebrates. The number of species named in both state and federal databases were 360 plant species (57.1%), 170 invertebrates (28.4%), and 91 vertebrates (14.4%). The difference between federal and state lists is further magnified by the fact that significant numbers of species listed on the federal databases are managed by only one state: 143 plant species (48.3%), 86 invertebrates (29.1%), and 28 vertebrates (9.5%). In other words, only 217 plant species, 84 invertebrate species, and 63 of vertebrate species designated as invasive by federal databases were being managed by more than one state.
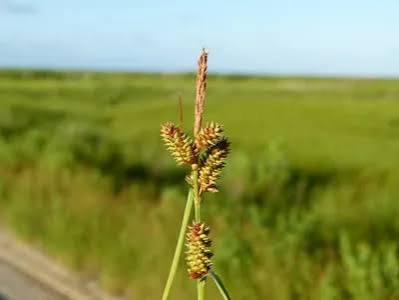
Carex extensa – one of plant species listed as invasive by USGS but not regulated by any of the 21 states; photo by botanygirl via Picture This
The survey identified a wide range of state agencies that have at least some responsibility for managing invasive species. These agencies’ principal concerns are agricultural, plant, or livestock industries; wildlife, fisheries, and recreation; forestry, mining, and natural resources; marine resources; public and environmental health; transportation, utilities, and commerce; and administration, education, specific locations, and all other types. Agriculture agencies are overwhelmingly responsible for invasive plants, insects, and arthropods; and almost equal to Fish and Wildlife departments in the case of managing molluscs. F&W departments are most often responsible for mammals, fish, crustaceans, amphibians and reptiles. Public and environmental health agencies are a distant second as regards responsibility for plants and arthropods, and third re: insects. Administration/education/specific location agencies are third most frequently given responsibility for plants; they hardly appear for other categories. Transport and commerce ranked fourth (nearly the same as public health agencies) for managing insects.
More than half of state policy measures (55.4%) related to terrestrial species, habitats, and pathways; 17.1% related to aquatic species, habitat, and introduction pathways; and 27.5% related to both.
Considering all species named in each state’s policy codes, about half of the listed taxa in each focal state’s policies are also listed by at least one neighboring state. At the regional level, overlapping or consistent policies declined to about 19% of the species. It doesn’t surprise me that New England states rank high in cooperation. Nor that the least number of species also regulated by neighboring states applies to Florida; the “sunshine state” is semitropical and has many types of ecosystems probably not present in Alabama or Georgia.
Once again, consistency is higher for plant species than the animal taxa. Among-neighbor overlap for plant taxa is ~69-70%, for invertebrates is ~50%, and for vertebrates only about a third. At the regional level, overlap is ~28% for plant species, ~18% for invertebrates, and 14% or less for vertebrates.
Drake et al. (2026) present case studies on several species to illustrate the breadth and depth of policy inconsistency, coordination, and implementation. The species studied are three of the four species regulated by all 21 states in the database; and three others selected to be emblematic of plant, invertebrate, and vertebrate taxonomic groups. The representative species for invertebrates is the emerald ash borer (EAB; Agrilus planipennis); the illustrative species for vertebrates is feral pigs (Sus scrofa).
Drake et al. (2026) report that the EAB had been detected in all but two of the 21 states in their study – Florida and Mississippi (EAB has now been detected in the state). There was a federal quarantine until early 2021. Still, only 10 states (47.6%) have a policy regulating EAB per se. Nine states had acted proactively; this was the highest proportion among all the species analyzed, probably because the beetle spread so quickly and had such obvious and severe impacts observed.) My analysis of data on the Don’t Move Firewood website determined that few of these states regulate firewood. Seven states require treatment of firewood originating out-of-state. New York also prohibits movement of firewood within the state over distances exceeding 50 miles. Two states regulate firewood originating in location quarantined for a specific pest, e.g., EAB. Three states restrict movement of outside firewood onto state properties. The rest of the states urge people to “burn it where they buy it” but impose no requirements. In some cases, National parks for forests have more stringent regulations. I am quite disappointed how few states have taken protective actions. Drake et al. (2026) explained the absence of regulations in the other 11 states as possibly due to the slow pace of legislative action compared to the speed of spread. I think this factor deserves greater attention.
Drake et al. (2026) noted that there are cooperative programs that cross jurisdictional boundaries; these increase programs’ effectiveness. The example they cite is the Ash Protection Collaboration Across Wabanakik — a cooperative effort among federal, state, and tribal governments and non-governmental organizations in northern New England and bordering Canadian and tribal lands.
The discussion of feral pigs reported that these animals are becoming increasingly troublesome. The highest density of pig populations is in southern states but suitable habitat is found across North America. Twelve states have adopted relevant policies; five were proactive in doing so. Feral hogs are present in at least three of the nine states that lack any policy; they are also present in neighboring states of most. Drake et al. (2026) say that the patchwork of policies and regulatory agencies across (and even within states) has hindered management. One of the issues with feral hog management is the presence of conflicting views and stakeholders. Some states encourage hunting, others outlaw it in hopes of reducing any motivation to transport hogs to new areas to initiate sport hunting. They conclude that prohibiting private landowners from profiting from feral pig hunting opportunities, while apparently useful for control, might not be reasonable.
Drake et al. (2026) notes that there is no national policy but the federal government does provide financial assistance. Congressional legislation created the Feral Swine Eradication and Control Pilot Program (FSCP), co-managed by USDA Natural Resources Conservation Service and APHIS. They say that while federal and state investment is likely necessary to conduct the large-scale control needed, the public wants the opposite: they say those responsible for pig releases and individual landowners should pay for control efforts. Drake et al. (2026) discuss the situation in North Carolina to illustrate the conflicting approaches within one state.
Drake et al. (2026) find the greatest consistency across states in the regulation of invasive plants. This might reflect the historical attention to agricultural weeds. However, there are still inconsistencies that might cause confusion and facilitate unintended spread of invasive plants by the horticultural trade. (See my earlier blog here.) They point out that the lack of attention to invertebrates and vertebrates falls short considering the risks and costs these invaders impose at the national and global levels. In the eastern United State, five of the six costliest invasive species are invertebrates; the sixth is feral hogs.
Drake et al. (2026) worry that the widespread differences in approach leads to inaccurate estimates of invasive species’ economic cost as well as reduces states’ ability to effectively plan and coordinate efforts. They concede that given the range of agencies and industries that contribute to invasive species management, their review of state policies might not accurately reflect the full effort. Also the engagement of multiple players enhances flexibility. However, the disconnect between policy and on-the-ground actions can be a barrier to effective communication and compliance. It might also result in duplication and missed opportunities for collaborative management on common goals in neighboring states.
Drake et al. (2026) concede that social acceptance affects implementation. The most cost-effective, efficient, and impactful control methods might be socially unacceptable. Often social acceptance comes after an invasive species has spread and established – so after counter action is most successful and cost-effective.
Drake et al. (2026) note that climate change is likely to reduce barriers to invasive species’ spread and establishment and facilitate transition of benign non-indigenous species into damaging invaders. They say there is an urgent need for more attention from policymakers to the threat posed to both the economy and ecological systems. Their example is the contrast between the concentration of forest insect pests in the northeast while Florida and Mississippi list the highest number of species. Drake et al. (2026) suggest these listings reflect the region’s forestry sector’s concern about non-native pests – but I have not seen such interest (See profile of Sirex woodwasp here.)
To reduce vacillations in federal policy when administrations change, Drake et al. (2026) urge Congress to adopt strong, overarching legislation. If that isn’t possible, they say the second best option is to strengthen incentives and procedures for interstate cooperation. Such an approach could be extended to Canadian provinces
Drake et al. (2026) say it is clear from their own and others’ work that current policy tools fall short and leave proactive states at risk of threats from their neighbors. A possible model is competitive and non-competitive State Wildlife Grants program managed by the U.S. Fish and Wildlife Service. These funds should complement, not be reallocated from, current conservation efforts.
They praise some efforts by NISC, specifically the Early Detection Rapid Response framework, as a way to spur improved communication among policymakers, practitioners, and researchers. However, given the many remaining legislative and regulatory gaps, and differing interpretations, they suggest increasing opportunities of practitioners to use existing research and outreach structures e.g., Land Grant institution extension model. New frameworks such as translational invasion ecology can improve identification of research priorities and transfer of generated knowledge. These frameworks explicitly take into account the ecological, sociological, economic, and political contexts. Incorporating diverse stakeholders and quantitative tools e.g., through simulations, climate change projections, connectivity assessments, and species distribution maps that take into account the socio-economic components might be able to more holistically evaluate and act upon the potential threats.
Drake et al. (2026) call for increased attention to researching species likely to become problematic in the future. They note that only four of 18 NIS species in New England identified by another’s study as likely to benefit from climate change are included under policies of at least one state in the region.
SOURCE
Drake, J., E.M.X. Reed, D. Haak, B. Brown, M.C. Mims, M.G. Sorice, H. Rogers, S. Salom, T. Schenk, and J.N. Barney. 2026. State Lines and Species Divides: Inconsistencies and Opportunities in Invasive Species Policies across the eastern United States. Ecological Applications 36(5): e70287. https://doi.org/10.1002/eap.70287
Posted by Faith Campbell
We welcome comments that supplement or correct factual information, suggest new approaches, or promote thoughtful consideration. We post comments that disagree with us — but not those we judge to be not civil or inflammatory.
For a detailed discussion of the policies and practices that have allowed these pests to enter and spread – and that do not promote effective restoration strategies – review the Fading Forests report at http://treeimprovement.utk.edu/FadingForests.htm
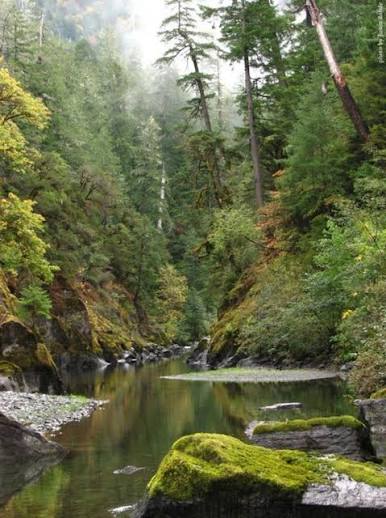
Copper-Salmon Wilderness in Rogue River Siskiyou NF; one of last low-elevation habitat for healthy Port-Orford cedar; photo from USFS
CISP submitted official public comments to the USDA Forest Service opposing the proposed recission of the Roadless Area Conservation Rule, aka ,the roadless rule. Our opposition is based on the heightened risk of invasive species introductions associated with easier human access. Vice President Phyllis Windle wrote the comments.
The roadless rule was adopted in 2001—available here. This regulation prohibits road construction, road reconstruction, and timber harvesting on approximately 44.7 million acres of National Forest System lands, including in Alaska. It is not in effect in Colorado or Idaho because those states have state-specific regulations.
According to the proposal, rescinding the 2001 Roadless Rule is intended to return decision-making for these activities to local officials, in conjunction with forest-level land management planning.
Rescission of the roadless rule would be one of the largest conservation policy changes in recent years.
As required by the National Environmental Policy Act (NEPA), the USFS prepared a draft environmental impact statement (DEIS) analysing the likely effects of allowing local forest managers to open currently road-free areas to construction of temporary or permanent roads. Our review focussed on the 300-plus pages in Volume 1. Phyllis found that division of the analysis into multiple major and minor sections muddied the conclusions and failed to provide an accessible, integrated view.
(The DEIS included two additional volumes totaling 600-plus pages – almost all letters from tribes, congress, states, and localities). Supporting biological and economic documents added nearly 900 more pages. Mostly these were detailed analyses by the US Fish and Wildlife Service and the National Marine Fisheries Service.)
Worse, the backlog in updating individual National forests’ management plans undercuts the ability of local managers to understand current conditions and adopt truly appropriate strategies. (As of March 2023, 99 management plans are older than the legal maximum of 15 years.) The DEIS also does not demonstrate how individual national forests can address problems that cross their own or state boundaries – threats that include those from invasive species.
Phyllis notes that evaluating the benefits and environmental downsides of constructing roads in specific National forest areas will require more complex plans than those developed in the past – and which are so badly tardy. The DEIS does not address how the current planning process can meet the demands of the new responsibilities associated with ending the roadless rule.
Most important, the DEIS barely addresses the risk of spread of non-native insects and plant disease pathogens. CISP asserts that these organisms pose the greatest threats to forest health from invasive species. Yet the DEIS says only that “the presence and severity of pest infestations are influenced by local conditions…” like climate and the biological attributes of pests. (DEIS, Vol.1, p. 78.) A far broader set of conditions influence infestations. Among them are proximity to nurseries selling contaminated stock or homeowners planting such stock; camping enthusiasts moving insect-infested firewood (sometimes in violation of state quarantines); and people transporting invasive species during fire operations, with construction equipment, or on boats. As has been well recognized for decades, economic factors, international regulations, and the popularity of certain pets all affect the “presence and severity of pest infestations.”
As we point out, non-native insects and pathogens are extremely damaging. Yet the DEIS discussion of insects appears to be based almost entirely on responding to damage caused by the native mountain pine beetle (Dendroctonus poderosae). There is no discussion of existing impacts or threats from, for example, the emerald ash borer – in eastern forests or in Pacific coast states; or the balsam woolly adelgid on subalpine fir (Abies lasiocarpa) in the Rockies. New outbreaks of these insects can result from careless visitors taking insect-infested firewood to formerly inaccessible locations.
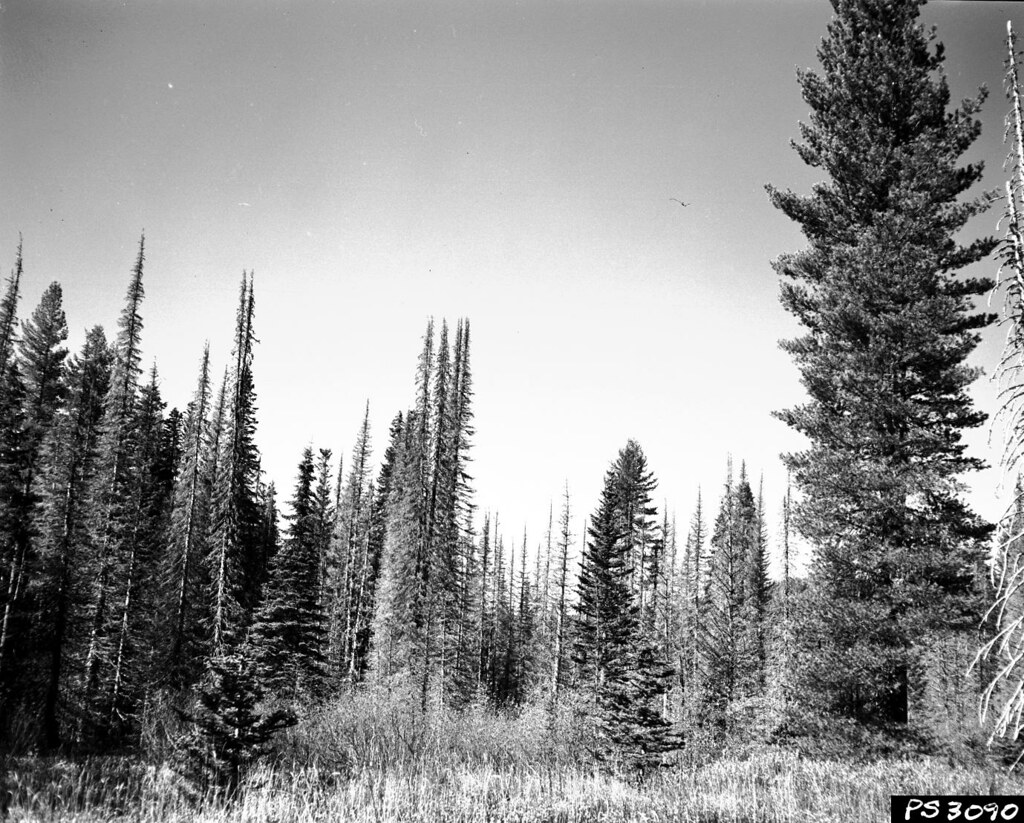
BWA-killed subalpine fir in Oregon in 1959; photo by Ken H. Wright USFS
Failure to mention major and potential plant pathogens is an even more glaring gap since they are often harder to identify, more difficult to detect, deadly … and their spread is sometimes quite intimately linked to roads. The link is best documented for Phytophthora species. The DEIS does not address the many examples already present in National forests. Port-Orford-Cedar root disease (Phytophthoralateralis) has killed up to 90% of its hosts at high-risk sites. It is well-documented as being spread by construction and use of roads (Betlejewski et al. 2011). Sudden oak death has killed an estimated 50 million trees in northern California and southwestern Oregon. Phytophthora cinnamomi is widespread in eastern oak-dominated forests, where it is probably reducing productivity. This root pathogen poses serious challenges to efforts to restore American chestnut trees across most of its current range (Gustafson et al. 2022). Its spores spread from tree to tree in water and through soil. In California, Phytophthora species introduced to wildlands on herbaceous species planted during restoration projects have spread downhill (Swiecki and Bernhardt 2018).
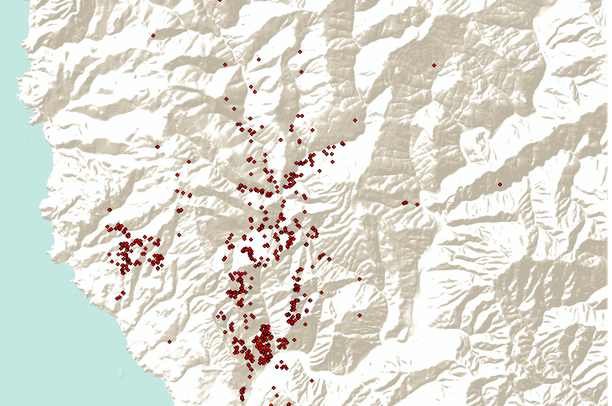
sites of SOD infection in Oregon; map by Oregon Department of Forestry
In all these cases, roads, vehicles, fill dirt or gravel, even shoes can have spread the pathogen. Swiecki and Bernhardt’s (2018) Best Management Practices could help prevent introduction and spread via trail work, construction, and imports of soil. It is not clear whether they have been adapted and implemented widely by land management agencies.
Phyllis suggests that the DEIS should have included a case study reviewing presence and impacts of Phytophthora species in American forests, with the focus on how the pathogens are being introduced and spread. The analysis should closely examine how the three alternatives in the DEIS would help or hinder control of these pathogens – for a specific invasive species, in specific places. She notes that actually preventing a pathogen’s introduction and spread differs from planning what to do. The proposal’s emphasis on planning seems risky.
The DEIS allots more attention to the nexus between invasive plant species’ introduction and spread and road access. It is widely acknowledged that invasive plants can penetrate deep into forests and alter or eliminate biodiversity, scenic, and other forest values. One weakness in the DEIS is that it is not clear which invasive plant species are being mapped in USFS projects. Instead, the text says that “… invasive plants are ranked and identified as being invasive or noxious in the state in which they occur.” The DEIS does not acknowledge that state noxious weed lists are usually focused on agricultural weeds, not those that can invade intact forests. As we noted in an earlier blog, the list of plant species tracked by the Forest Inventory and Analysis (FIA) program does not include numerous such species, e.g., wavy-leaf basketgrass (Oplismenus undulatifolius), fig buttercup (Ficaria verna; formerly Ranunculus ficaria), shrub and creeping Euonymus, callery pear (Pyrus calleryana). Among shrubs, only one privet (Ligustrum vulgare) is included. Plus, since plant species’ status differs from state, shifting authority to Forest level decision-makers could sow confusion and conflict over jurisdictional differences.
The FIA data analysis I reported on in this blog noted both that plant invasions are much more intense in the wildland-urban interface (WUI) and that National forests across the Lower 48 are less invaded by non-native plants than forests under other ownerships. I concluded that the principal reason for increased integrity of forests under federal management is current management: protection from road-building and harvesting over many decades. Allowing construction of roads into currently roadless areas threatens to expand the degrading influence of semi-developed areas.
The risk is high: sites best suited to growing industrial timber are also prone to invasion by non-native plant species. The FIA surveys found that 76% of highly productive plots were invaded compared to 40% of low-productivity plots. It is unclear whether highly productive sites are inherently more invadable, or, instead, that such plots were converted to agriculture earlier, so exposed to human disturbance longer.
Forest Pests Not a Priority?
In CISP’s comments, Phyllis noted that on December 30th, 2025, Secretary of Agriculture Brooke L. Rollins announced four new priorities for research and development. The third was “Protecting the Integrity of American Agriculture from Invasive Species.” Our review of materials accompanying the proposed rule change found little evidence that forest pests are receiving such priority attention.
SOURCES
Betlejewski, F., D.J. Goheen, P.A. Angwin, R.A. Sniezko. 2011 Port-Orford-Cedar Root Disease. Published by USDA Forest Service, Pacific Northwest Region (R6), Portland, Oregon. FS/R6/RO/FIDL#131-11/009
Gustafson, E.J., B.R. Miranda, T.J. Dreaden, C.C. Pinchot, D.F. Jacobs. 2022. Beyond blight: Phytophthora root rot under climate change limits populations of reintroduced American chestnut
Ecosphere. 2022;13:e3917.
Swiecki, T.J. and E. Bernhardt. 2018. Best Management Practices for Preventing Phytophthora Introduction and Spread: Trail Work, Construction, Soil Import. Contract: Development of Phytophthora BMPs for Golden Gate National Parks Conservancy
Posted by Faith Campbell
We welcome comments that supplement or correct factual information, suggest new approaches, or promote thoughtful consideration. We post comments that disagree with us — but not those we judge to be not civil or inflammatory.
For a detailed discussion of the policies and practices that have allowed these pests to enter and spread – and that do not promote effective restoration strategies – review the Fading Forests report at http://treeimprovement.utk.edu/FadingForests.htm
EAB-caused mortality of ash in Midwest; photo by Nathan Siegert, USFS
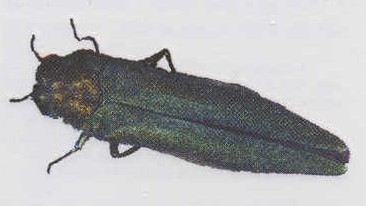
The 20th anniversary of detection of the emerald ash borer (EAB; Agrilus planipennis) in southeast Michigan has prompted reviews of the current situation. Tayal and Perry (2026) analyzed data from invasion-spanning research sites to investigate the extent of ash regeneration. Mortality of black ash (Fraxinus nigra), green ash (Fraxinus pennsylvanica), and white ash (Fraxinus americana) had exceeded 99% in these forests, with a concurrent precipitous decline of viable seed production.
They found that regenerating ash are abundant in the understory of post-outbreak forests. Among the 638 understory trees in the survey, basal area was highest for ash, followed by elm (Ulmus species.), maple (Acer species.), and musclewood (Carpinus caroliniana). On upland (xeric) and riparian (mesic) sites, ash are primarily in seedling and sapling size classes. Larger ash are more plentiful in wetland forests; the seven canopy ash trees were all in wetland forests.
The emerald ash borer is present in low numbers in all study sites.
Many ash of susceptible size (≥2.5 cm dbh) have symptoms of EAB infestation. Several of these symptoms (e.g., woodpecker damage, presence of epicormic sprouts, and canopy decline) grow more established as the trees grow. Still, 57% trees ≥5 cm dbh have healthy canopies. D-shaped adult beetle exit holes were detected on only 2% of the ash.
black ash swamp in Minnesota; photo by Eli Sagor via Flickr
Tayal and Perry (2026) concluded that the black and green ash in wetland forests are able to respond quickly to the multi-tree gaps produced by EAB-induced death of their dominant predecessors in these systems. These gaps result in more light availability and growing space than the single-tree gaps created by mortality of individual ash in mixed-species riparian or upland systems.
Other tree species that also flourished in the aftermath forests were maples, esp silver maple (Acer saccharinum), have become dominant in the overstories of wetland forests in northern US and Canada. In late successional floodplain forest systems, the maples are joined by other species with a tolerance for cold, flooding, and shade including elm (e.g., Ulmus americana); tamarack (Larix laricina) and yellow birch (Betula alleghaniensis).
Of course, American elm is threatened by a separate invasive species, the pathogensOphiostoma ulmi and O. novo-ulmi.
Tayal and Perry (2026) state several times that the future survival of this “orphaned” cohort of seedlings and saplings too small to have been colonized by EAB during the initial outbreak is uncertain. As they grow to susceptible size will they be attacked and killed by a growing population of beetles? Or will the biocontrol agents – assisted by woodpeckers – be effective in keeping EAB populations sufficiently low to allow the immature ash to reach reproductive size? Tayal and Perry (2026) cite Duan et al. (2023) as reporting that there is some evidence that the biocontrol agents can suppress EAB densities in immature ash. [Three agents – Oobius agrili, Spathius galinae, and Tetrastichus planipennisi – are established – in low numbers – in the forest sites studied.] So while the extent to which BC agents have protected regenerating ash in these long-term plots is still unknown, they express the hope that the parasitoids might be most effective in aftermath forests after EAB populations have peaked and then declined.
SOURCE
Tayal, A. and K.I. Perry. 2026. Status of ash (Fraxinus species.) in mixed hardwood post-outbreak forests near the epicentre of the emerald ash borer invasion. Agricultural and Forest Entomology, 1–12. Available from: https://doi.org/10.1111/afe.70067
Posted by Faith Campbell
We welcome comments that supplement or correct factual information, suggest new approaches, or promote thoughtful consideration. We post comments that disagree with us — but not those we judge to be not civil or inflammatory.
For a detailed discussion of the policies and practices that have allowed these pests to enter and spread – and that do not promote effective restoration strategies – review the Fading Forests report at http://treeimprovement.utk.edu/FadingForests.htm
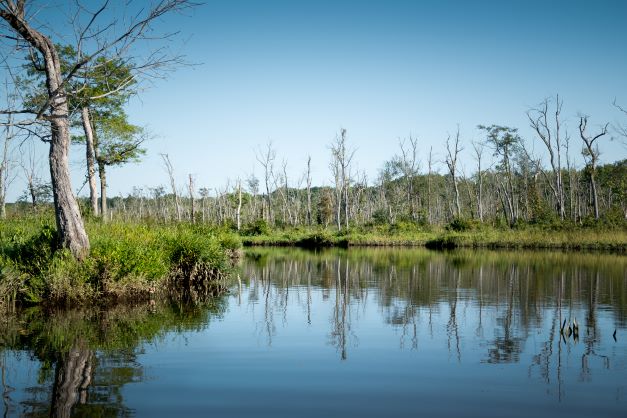
the Oregon ash-dominated wetland in Arkany National Wildlife Refuge in Oregon’s Willamette Valley; photo by Wyatt Williams, Oregon Department of Forestry
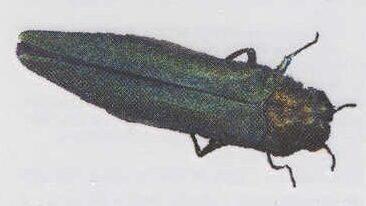
Two years ago I posted a blog summarizing the probable impact of the emerald ash borer (EAB; Agrilus planipennis) in Oregon. Reminder: the EAB was detected in Forest Grove, Oregon (west of Portland) in 2022. Scientists determined that it had been present for four to six years at that time.
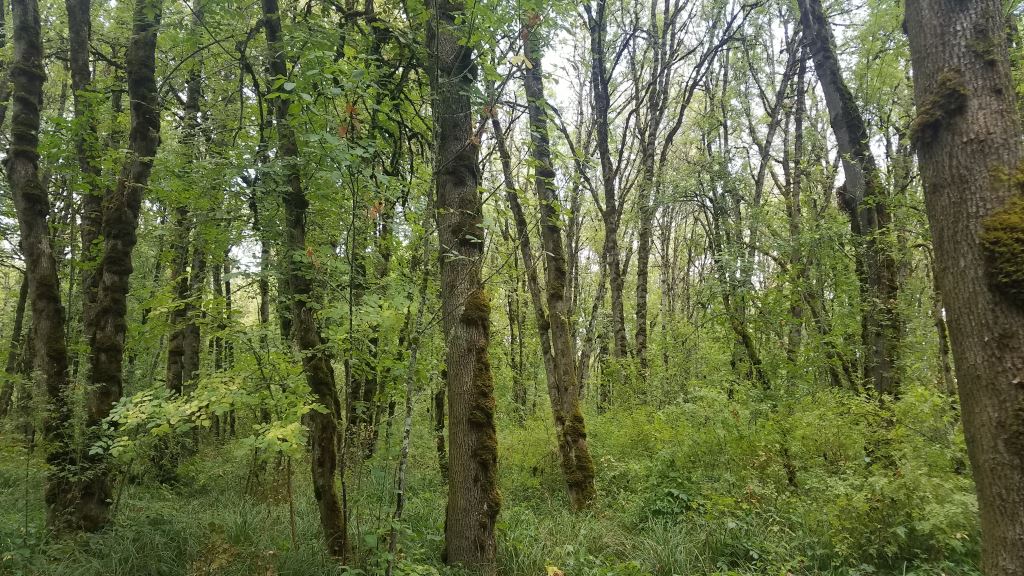
In her Master’s thesis, Chloe Hull (2024) confirms that nearly all forested wetlands in the state’s Willamette Valley are comprised overwhelmingly of Oregon ash (Fraxinus latifolia). Therefore, these wetlands are likely to undergo rapid, significant shifts in vegetation, hydrology, and soils — unraveling their ecosystem functions. Hull warns that no management approach can restore those wetlands to perform the full breadth of their pre-settlement function and diversity. She suggests instead strategies to maintain these areas as wetlands – even if different types.
Hull’s conclusions are based on the expectation that Oregon ash will be killed by EAB infestation at levels similar to black (Fraxinus nigra), white (F. americana), and green (F. pennsylvanica) ash in the Midwest, i.e., up to 99%.
What is Threatened?
Wetlands provide numerous benefits to both human and natural systems, including purification of surface waters, habitats for plant and animal species, and food sources. Hull cites studies estimating that natural wetlands deliver 43.5% of the total global monetary value of ecosystem services provided by all natural biomes despite making up only ~3% of the world’s surface area.
In the Lower 48 United States more than half of wetlands have been converted to other land use types since 1780. In Oregon statewide, the extent of loss is lower: 38%. However, in the Willamette Valley specifically, the estimated loss is 57%.
Hull describes the pre-settlement wetlands of the Willamette Valley and the forces that have transformed them.
The most widespread of these wetlands were wet prairies, covering about 137,277 ha. Wetland, or bottomland, forests occupied about 97,477 ha. These forests typically formed bands along river or stream channels; they were also found occasionally in beaver swamps. These forests were composed of fire-intolerant deciduous trees in various densities. Stands along active channels typically willows (Salix species.), red alder (Alnus rubra), white alder (Alnus rhombifolia), and black cottonwood (Populus trichocarpa). On slightly higher terraces, where the inundations were less frequent, grew Oregon ash, bigleaf maple (Acer macrophyllum), and Oregon white oak (Quercus garryana). Ash and oak were particularly important along many smaller stream channels surrounded by open prairies.
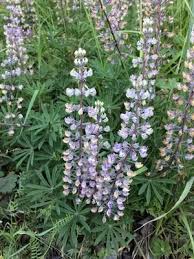
Kinkaid’s lupine; photo from “Picture This” website
The wet prairies provide habitat for two federally-listed endangered plant species [Willamette daisy (Erigeron decumbens var. decumbens) and Kincaid’s lupine (T. Lupinus sulphureus species. kincaidii)]; and four state-listed species [white rock larkspur (Delphinium leucophaeum), peacock larkspur (Delphinium pavonaceum), Willamette navarretia (Navarretia willamettensis) and white fairy poppy (Meconella oregana)]. Two plant species and a butterfly formerly listed by the U.S. Fish and Wildlife Service [golden paintbrush (Castilleja levisecta) and Bradshaw’s lomatium (Lomatium bradshawii), and the Nelson’s checkermallow (Sidalcea nelsoniana)] are also present.
Both types of wetlands were maintained in part by periodic burning by the resident Indigenous peoples. These actions promoted a habitat mosaic of tufted hairgrass (Deschampsia cespitosa) prairies, camas lily (Camassia quamash) wet prairies, Oregon white oak savannas, and ash-dominated bottomland riparian forests. The Willamette River meandered and formed braided channels, with resulting flooding and wetland habitats.
In 1855 the federal government forced the Indigenous peoples to leave the valley. Since then, the wetlands have been drained and converted into agricultural fields; or drowned by various flood-control dams, diversions, and levees. As a result, Hull says, the Willamette Valley has been largely disconnected from the river. In addition, Euro-Americans have introduced non-native plants and intensive livestock grazing. Overall, the valley has lost the wetlands’ ecosystem functions.
Current (pre-EAB-induced mortality) Context
In the absence of disturbance, ash tends to be most important early-seral and final climax tree species. It plays a crucial role in regulating and supporting other species, hydrology, carbon storage, nutrient cycling, and overall resource availability.
Oregon ash are medium-sized trees, growing up to 24 m (80 ft) high and a dbh of 75 cm (30 in). Ash are long-lived, probably up to 250 years. They are thought to reach sexual maturity at ~ 30 years.
Oregon ash are adapted to the clayey, soggy conditions of the valley. (The average clay component of Willamette soils is 60-70%. When they become saturated there is prolonged surface ponding.) They also occupy drier, well-drained sites. Ashes’ tolerance of other environmental conditions, e.g., flooding, drought, salinity, soil pH, etc., is unknown.
Hull based her conclusions on analysis of four ash-dominated wetlands in the central Willamette Valley. Although only ~ 24 km apart, the sites differ in vegetation community composition, hydrology, and past and current other management goals.
Site number 1 (Jackson Frazier) comprises primarily wetlands; current management is attempting to restore the wet prairie system, with little attention to forested wetlands. The second site (Mulkey Creek) is managed primarily to maintain oak woodland and prairie habitat. The third site (Poultry Center) is a university research facility. The fourth site (Shedd) has both natural drainage (two sloughs and a creek) and a relatively intact bottomland forest. This property often hosts public off-roading events so owners maintain trails and camping areas.
Hull determined vegetation types and management activities on these sites since 1948 by examining aerial photographs.
At all sites ash trees grew larger and stands increased in density between 1948 and 1978. Averaged across all sites, Oregon ash comprise more than 92% of forest canopy composition. The species reached 100% in some plots at some of the four sites. The second most common species in the canopy is the native black hawthorn (Crataegus douglasii). Among the other species are several non-native fruit or flowering trees [crabapple (Malus species.), pear (Pyrus species.), plum (Prunus species.)], Oregon white oak, and other species. Overall ash density was highest in the Shedd site, decreasing through Poultry Center and Mulkey Creek to Jackson Frasier. Rankings were different when she considered the balance between adult and sapling ashes: Jackson Frasier has the highest proportion of ash seedlings (93% of total saplings at one plot; 75% at a second); Poultry Center ranked second (70% of all saplings across all study quadrants). There are very few ash saplings at Mulkey Creek and Shedd (the last has only 4 ash saplings on the entire study site). Hull attributes these very low numbers to competition between adult and sapling ash.
EAB damage along a Mid-Atlantic river; is this what will happen in Oregon? photo by Leslie A. Brice
Anticipated Impacts of Ash Mortality
Hull expects 99% mortality of ash trees across the Willamette Valley in eight to 15 years. This will cause complete restructuring of the forest canopy and subsequent changes in disturbance regimes, flora and fauna communities, and land use. Currently there is no feasible way to restore ash-dominated wetlands. She explored three alternative future states, one of which describes several possibilities for maintaining different wetland ecosystem types.
Noting experience in the East, Hull concludes that there is extremely limited potential for ash regeneration following EAB-induced mortality. In the East an “orphaned cohort” of ash trees too small to have been infested in the initial invasion, or which sprouted after that event, has persisted so far. But its long-term survival and maturity is uncertain because EAB remain. See non-PMW article Especially since Oregon ash does not reach reproductive age for 30 years), tree mortality is likely to exceed seedling recruitment in these stands.
Still, since ash seeds banks decline rapidly after adult trees die, the orphaned cohort remains the most realistic opportunity for ash regeneration. It is hoped native woodpecker species and introduced biocontrol agents can sufficiently suppress EAB populations to create an opportunity for the saplings to achieve maturity and reproduce. See non-PMW article
Restoration
A majority of the literature and information about EAB effects on ash wetlands is from the Midwest. Willamette wetlands differ in soil characteristics and biotic and abiotic ecosystem components. Unlike the moderate to deep organic histosols underlain by clay in the Midwest, Willamette soils are hydric, defined as “a soil that formed under conditions of saturation, flooding, or ponding long enough during the growing season to develop anaerobic conditions in the upper part”. As noted above, saturation of these soils often results in prolonged surface ponding. Another factor is that most of the precipitation in Oregon is rain, not the snow of the upper Midwest.
Hull evaluates the probability of maintaining each of her four sites as a wetland. She also considers how to prevent domination of the site by either currently established or newly introduced invasive weed species.
Research in the Midwest indicates that wetland vegetation – in that case especially black ash trees — has a large influence on water table levels throughout the growing season. Simulated ash mortality led to a significant reduction in evapotranspiration and drawdown rates and a long-term rise in the water table. This was expected to promote conversion to open (herb-dominated) or shrub-dominated marshes.
In the Willamette Valley there are two types of wetlands not dependent on tall-stature trees – which are likely to disappear.
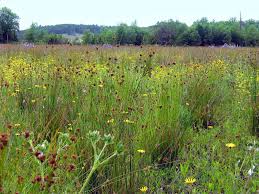
restored wet prairie near Eugene; photo by Bureau of Land Management
Pre-settlement, Willamette Valley wetlands were primarily wet prairies. Even now similar wetlands exist; they support a wide diversity of perennial and annual forbs and graminoids. Their floral diversity is due partly to traditional burning, partly to fine-scale vertical structures (“pedestals”) three to 20 cm high that support grasses and forbs on higher portions, rushes, sedges, and annual forbs on the lower, more often inundated surfaces.
The second type of non-forested wetland is Scrub-Shrub Wetland.These occupy an ecological niche between a wet prairie and a forested wetland. They are dominated by fire intolerant woody vegetation kept short in stature by environmental conditions. Hull reports that these are relatively stable systems. They were once commonly maintained by beavers; Hull does not speculate about possibly restoring those ecosystem engineers. She does consider them to be potentially a successional stage in transition toward a forested wetland system. Oregon white oaks are among full-stature trees that can grow in these wetlands – in shrubby form.
Is it possible to restore forested wetlands by planting tree species other than ash? The success of this approach is challenged by the high clay component of soils and high water tables. None of tree species commonly associated with Oregon ash (red alder, black cottonwood, and bigleaf maple) can tolerate the same high clay soils. The species that do grow in clay soils (black hawthorn, some willows) are small (typically less than 6 meters tall) so they cannot fill the same ecological functions and niches as ash. A few large-form trees might tolerate saturated clay soils and serve a more similar ecological role. Hull names Oregon white oak and Willamette Valley ponderosa pine (Pinus ponderosa var. willamettensis). But these species are less tolerant of inundation.
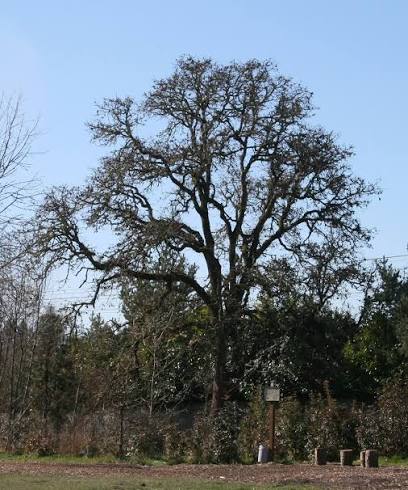
Oregon white oak; photo by born1945 via Flickr
I notice the importance of Oregon oak (Quercus garryana) – both in existing forest and scrub habitats and as a possible replacement for ash. I am concerned that Hull does not mention that Oregon oak is also threatened by a non-native insect, the Mediterranean oak borer (Xyleborus monographus). Given this species’ presence I doubt that Oregon oak is a viable species for restoration of wetlands. I hope other scientists are exploring strategies for minimizing MOB’s damage to this important species.
Hull also discusses some tree species from elsewhere that are reported to be under consideration for planting in Willamette Valley wetlands. Several of these also are vulnerable to established non-native insects or pathogens. These include:
California black oak (Quercus kelloggii) – vulnerable to both the sudden oak death pathogen (Phytophthora ramorum) and the goldspotted oak borer (Agrilus auroguttatus). The latter is not yet found in Oregon.
Oregon myrtle (Umbellularia californica) – a host that supports sporulation by the sudden oak death pathogen (Phytophthora ramorum). SOD is established and spreading in southwest Oregon, on the other side of the coastal mountain range from the Willamette Valley.
Fremont cottonwood (Populus fremontii) and boxelder (Acer negundo) — both are vulnerable to yet other non-native beetles, the Euwallacea-fungus complex known in California as “invasive shot hole borers”. The closest known population of the complex is in the San Francisco Bay area.
Hull notes that in the Midwest, scientists are considering several species as potential replacements for black ash, including American elm (Ulmus americana), swamp white oak (Quercus bicolor), red maple (Acer rubrum), eastern white-cedar (Thuja occidentalis), and common hackberry (Celtis occidentalis). In this case she mentions concern around the viability of American elm in the presence of “Dutch” elm disease. The disease is present on elms planted in Portland and possibly other cities in Oregon.
Hull notes that little research has been conducted on questions now considered important, such as the ecological functioning of forested wetlands – including those in the Willamette Valley – and vegetation responses to changing water tables. As she points out, during the time it will take to assess replacement trees ash will probably be extirpated.
The Threat from Invasive Plants
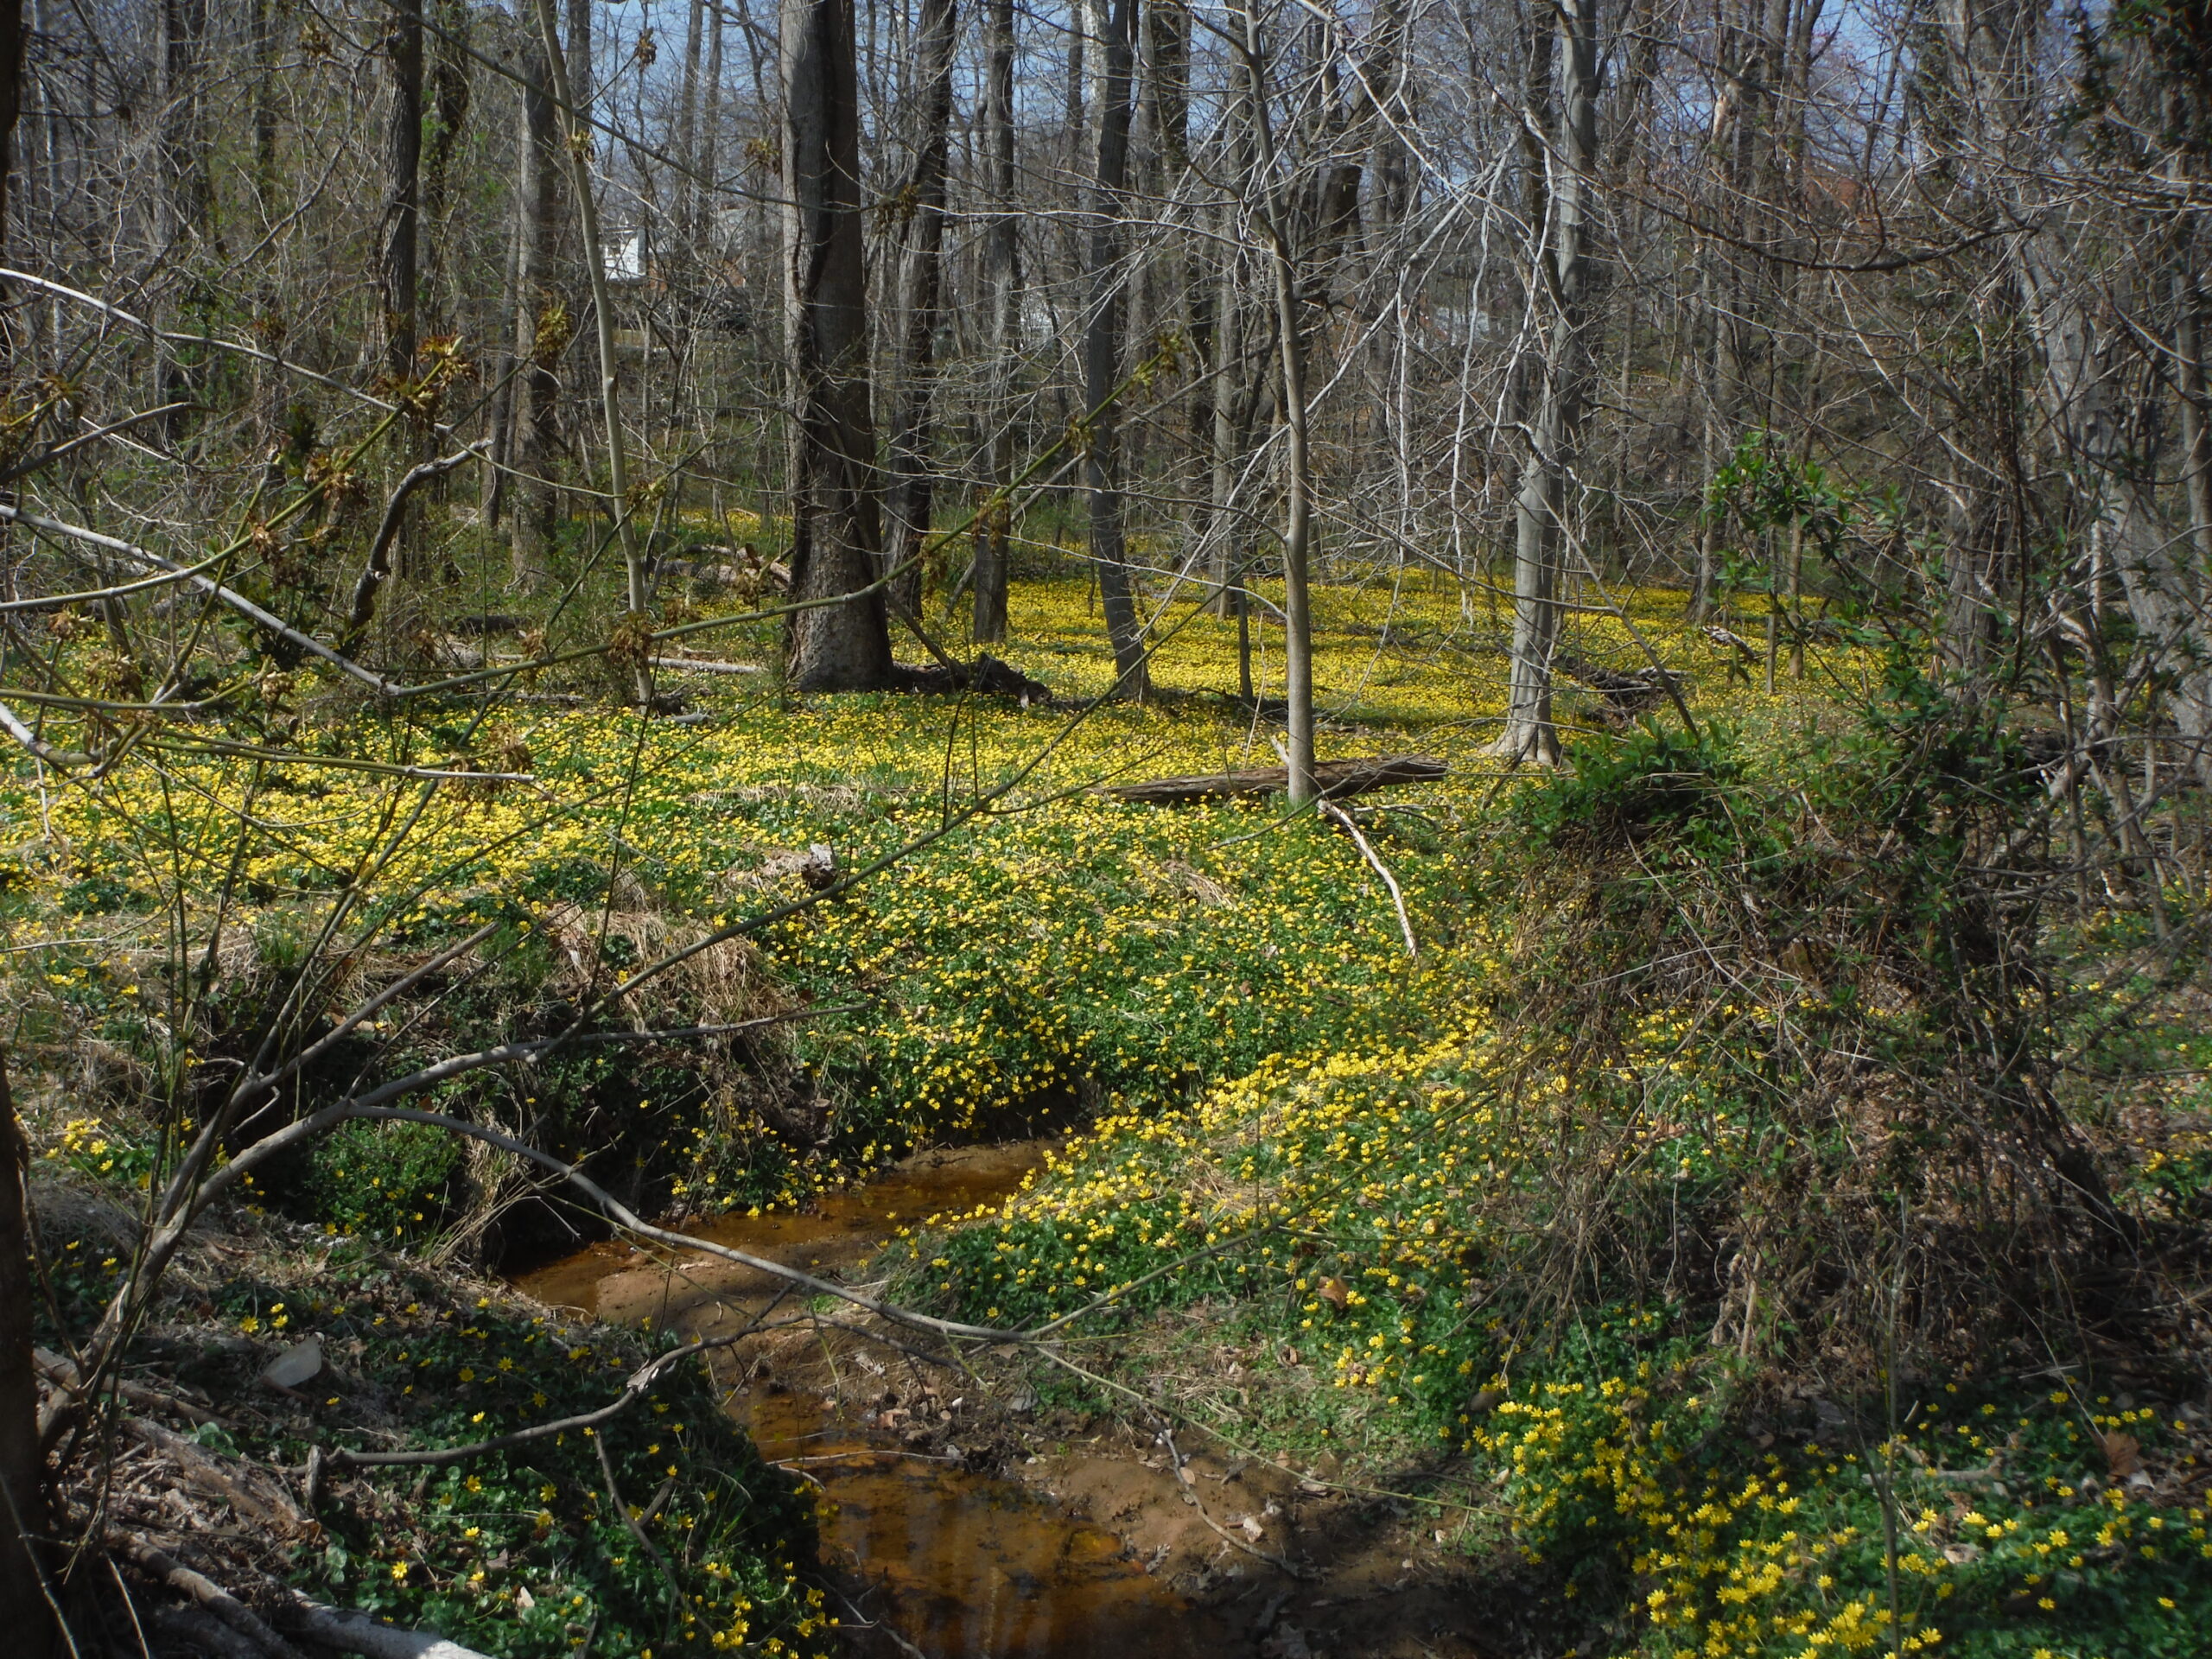
Hull reports the presence of several state-designated noxious weeds in the Willamette Valley that pose a threat to maintaining natural wetlands. The two most common and persistent weeds in the valley’s wetlands are Himalayan blackberry (Rubus armeniacus) and reed canary grass (Phalaris arundinacea). She names several other species, including lesser celandine (Ficaria verna/Ranunculus ficaria) and Japanese knotweed (Polygonum cuspidatum) (both are highly invasive Mid-Atlantic bottomlands); several trees and shrubs; and various grasses.
Ficaria invasion in the Mid-Atlantic; photo by F.T. Campbell
Management Options
Considering management options, Hull thinks it unlikely that officials will decide to do nothing because forests of standing dead ash are dangerous. She believes the best option is to harvest 20% of ash stands in 0.04 ha gaps and promote woody shrub establishment. Shrubs can provide some shade to streams and continued evapotranspiration and offset large rises in water table levels. The large amounts of down woody debris in streams could increase stream complexity and habitat as well as mitigate channelization. Hull notes that the resulting scrub-shrub habitats were common pre-settlement.
Regarding her four study sites, Hull considers two (Mulkey Creek and Shedd) are likely to become scrub-shrub wetland communities. Opportunity to plant tree seedlings at Shedd will depend on the density of understory vegetation. A third site, Poultry Center could transition to either an emergent (herb-dominated wetland or a scrub-shrub community. The direction of changedepends on whether increased surface evaporation leads to less ponding; or reductions in evapotranspiration rates leads to more ponding. Poultry Center is a reasonable candidate for tree species substitution if the hydrologic shifts are favorable. The wettest site, Jackson Frazier, will probably become an emergent wetland community, with a higher water table. It offers limited opportunities to establish alternative tree species.
Management of wetlands is further constrained by multiple restrictions, including state and federal laws; funding limitations; and visitor perceptions.
SOURCE
Hull, C. 2024. A Valley Without Ash: Exploring Strategies for Forested Wetland Restoration Post Emerald Ash Borer Invasion in the Willamette Valley, Oregon. MS thesis submitted to Oregon State University for the degree of Master of Forestry in Forest Ecosystems and Society
Posted by Faith Campbell
We welcome comments that supplement or correct factual information, suggest new approaches, or promote thoughtful consideration. We post comments that disagree with us — but not those we judge to be not civil or inflammatory.
For a detailed discussion of the policies and practices that have allowed these pests to enter and spread – and that do not promote effective restoration strategies – review the Fading Forests report at http://treeimprovement.utk.edu/FadingForests.htm
A newsletter issued by the Oregon Department of Forestry reports lots of action in Oregon and Washington in response to the presence of emerald ash borer (EAB; Agrilus planipennis). (To subscribe to the newsletter, email Jim Gersbach at jim.gersbach@odf.oregon.gov)
Ash-dominated swamp in the Willamette Valley; photo by Wyatt Williams, Oregon Department of Forestry
In Oregon, where EAB was detected in 2022, cities are taking protective actions. In Portland EAB was officially detected inside city limits in late summer 2025 east of the I-205 freeway. So far the beetle has not been reported from elsewhere inside city limits. To better establish where EAB is present, officials plan to girdle 4 ash trees in spring 2027 in hopes that female EAB will be attracted to them and oviposit. Those trees will be cut down in the fall, then examined to determine if any larvae are inside. This method has been used to help pinpoint where EAB is spreading before obvious signs of tree dieback are apparent. Oregon Department of Forestry will demonstrate the techniques for staff from the City of Portland, Oregon Dept. of Agriculture, U.S. Forest Service, Washington Dept. of Natural Resources, and Clackamas Soil & Water Conservation District.
EAB was confirmed within the city limits of Beaverton during summer 2026. The Beaverton City Council has adopted legislation expanding pesticide protection to1,400 ash street treesabove the 600 already treated in 2025. Treatment – injection of emamectin benzoate – is scheduled to begin in spring 2027 and be completed by September 2027. Last year city workers also protected 22 significant native Oregon ash trees (Fraxinus latifolia) over 20” dbh in a city-maintained natural grove that is predominantly ash.
EAB was detected in Silverton by a local tree care professional in summer 2026. The nearby Oregon Garden responded by treating eight ash trees on its grounds – all exotic to the region (seven white ash [eastern North America] & one narrow-leaved ash [Europe]). The Garden receives ~100,000 visitors a year. The treatments were supervised by Oregon Dept. of Forestry & Oregon Forestry Resource Institute staff.
In Washington State, where EAB was detected in August 2026, near Vancouver, the state has regulated firewood imported from sources outside the state. The quarantine on untreated firewood from outside the state was adopted in February by the state Legislature. It took effect on August 18. The rule prohibits importation into WA of untreated firewood from outside the state. Firewood imported into WA must be heat-treated to a minimum woodcore temperature of 160o F (71o C) for at least 60 minutes or receive an equivalent WSDA-approved treatment. The wood must also be labeled to show its source & display the statement “Approved Pest Free”. Firewood harvested within Washington State is exempt as are processed wood products, such as compressed wood bricks, wood pellets, logs, or wood products transported for industrial uses, such as to sawmills, pulp & paper mills, & biomass or wood composite facilities. Civil penalties up to $5,000 per violation can be imposed.
The newsletter provides updates on Europe’s double threat: EAB & ash dieback pathogen.
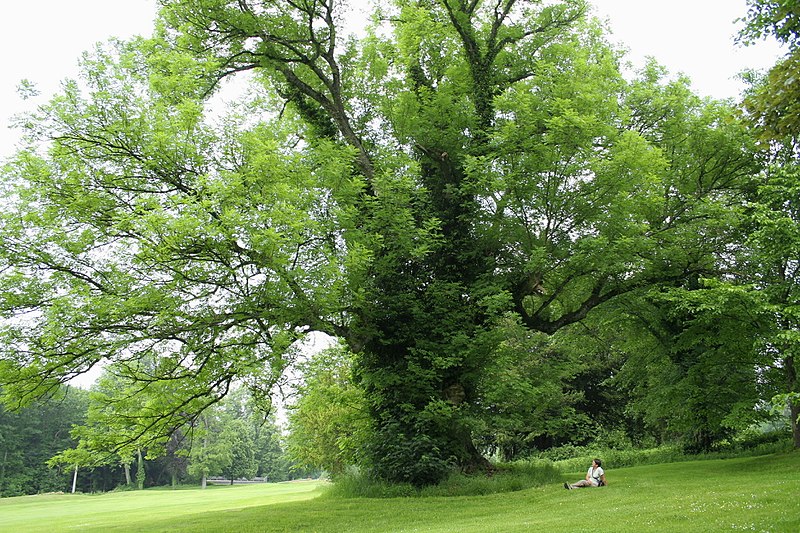
Europe is home to three species of ash: common ash (Fraxinus excelsior), manna ash (F. ornus), & narrow-leaved ash (F. angustifolia).
Hungary is the first European Union country with a confirmed EAB infestation (summer 2026). Neighboring Slovakia has also reported EAB presence but this is still unconfirmed.
While the EAB is native to the Russian Far East & other parts of East Asia, it was not seen west of the Ural Mountains before 2007, when it was reported in western Russia. By 2019 the pest had been recorded in Ukraine & Belarus. Researchers at Ohio State University have found that F. excelsior has at least moderate resistance to EAB.
Fraxinus excelsior in Belgium; photo by Jean-Pol Gramont
The ash decline pathogen (Hymenoscyphus fraxineus) is also from East Asia. It was first described in Poland in 1992 [although probably present much earlier, perhaps the 1990s (Tolio et al., 2025)]. It is now widespread in Europe. Where present, it has killed the vast majority of ash trees. To ascertain whether Oregon ash (Fraxinus latifolia) might be attacked, USDA Forest Geneticist Richard Sniezko of the Dorena Genetic Resource Center has sent seed to European colleagues so that they can plant them and track the results.
Some good news: British scientists report ~5% of F. excelsior trees appear to exhibit resistance to the parthogen and in some ash groves in northern England ~90% of young seedlings appear to be resistant.
The USDA Forest Service will hold a webinar on Oct. 6th to discuss EAB resistance ash breeding
Mary Mason, a geneticist w/ USFS Northern Research Station, will present. The webinar starts at 1 PM Eastern Daylight Time on Tuesday, Oct. 6.
Publications named by the Oregon newsletter that are particularly related to the situation in Oregon):
• Larval development & parasitism of emerald ash borer (Agrilus planipennis) in Oregon ash (Fraxinus latifolia) & European olive (Olea europaea): implications for the West Coast invasion Journal of Economic Entomology | Oxford Academic
• Maze, D., Bond, J. & Mattsson, M. 2024. Modelling impacts to water quality in salmonid-bearing waterways following the introduction of emerald ash borer in the Pacific Northwest, USA. Biol Invasions (2024). https://doi.org/10.1007/s10530-024-03340-3
• Kral, G. & D.C. Shaw. 2023. Alternatives to Ash in Western Oregon: With a Critical Tree Under Threat, These Options Can Help Fill Habitat Niche. Oregon State University Extension EM 9396. https://catalog.extension.ORstate.edu/em9396
Emerald Ash Borer Information Network, a collaborative effort by the USDA Forest Service & Michigan State University www.emeraldashborer.info
SOURCE
Tolio, B., P. Sherwood, D. Marčiulynienė, C. Crocoll, M. Cleary, M. Liziniewicz. 2026. Constitutive Metabolite Profiling of European & Asian Fraxinus with Varying Susceptibility to Ash Dieback. Journal of Chemical Ecology 52:8 https://doi.org/10.1007/s10886-025-01678-z
Posted by Faith Campbell
We welcome comments that supplement or correct factual information, suggest new approaches, or promote thoughtful consideration. We post comments that disagree with us — but not those we judge to be not civil or inflammatory.
For a detailed discussion of the policies and practices that have allowed these pests to enter and spread – and that do not promote effective restoration strategies – review the Fading Forests report at http://treeimprovement.utk.edu/FadingForests.htm
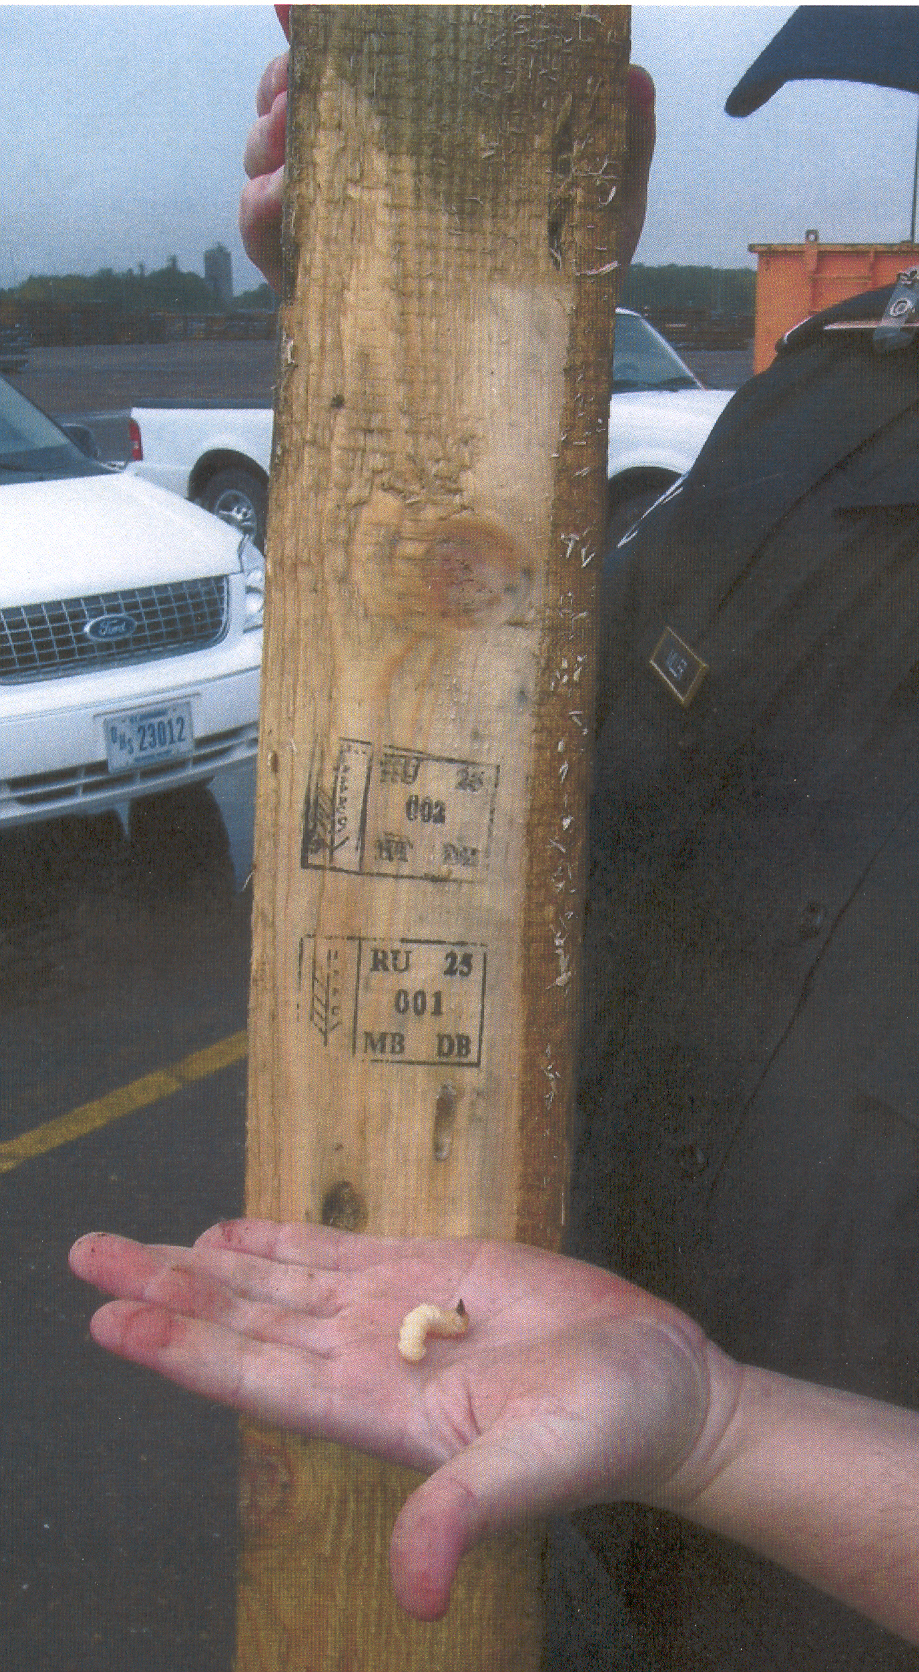
Twenty-four years ago the international community adopted ISPM#15 with the aim of reducing forest pest introductions via the wood used to make crates, pallets, and other forms of wood packaging (SWPM). Over that period questions have been raised about its efficacy. See the analyses by Haacket al. I have posted numerous blogs about wood packaging introductions, focused on the United States. To review these, on this website, scroll below the “Archives” to “Categories”, click on “wood packaging”.
Scientists continue to analyze data on wood borer introductions to explore patterns and evaluate the standard’s efficacy. Two recent articles focus on woodwasps in the Siricidae (Nardi et al. 2026) and ambrosia beetles in the Euwallacea complex (Lanschler et al. 2026). Full citations for both are at the end of this blog.
Sirex woodwasps
S. noctilio in Argentina; photo by Paula or Vicki Klasmer via Bugwood
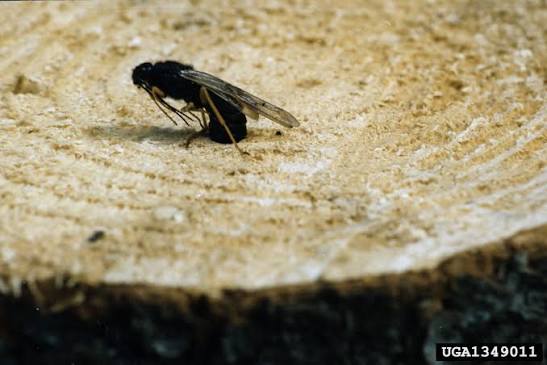
A group of scientist led by D. Nardi surveyed woodwasp introductions to the United States, Canada, and New Zealand to determine historic and current patterns. They found that:
1) Nearly all Sirex woodwasps (84.2% – 97.6%) are transported in wood packaging.
2) While most introductions originated in the woodwasps’ native regions of Europe and Eastern Asia, accompanying high volumes of commodities imported from those regions, interceptions from the Southern Hemisphere have increased recently. Nardi et al. speculate that Asian countries might use softwoods (conifer species) less often for SWPM than do Europe and North America. Certainly the most infamous invasive wood borers from Asia are those that attack hardwoods, e.g., Asian longhorned beetle, emerald ash borer, invasive shothole borers.
3) Widespread adoption of ISPM#15 has significantly reduced interception, establishment, and damage associated with Siricids in the U.S., Canada, and New Zealand since 2002. However, continued detection of live Siricids in wood packaging demonstrates the need for strict enforcement of the standard’s provisions and potentially adoption of additional mitigation strategies.
4) Data collected by phytosanitary agencies of these importing countries is sometimes too limited to support needed analyses of trade patterns and risk.
U.S. phytosanitary agencies identified less than 10% of the intercepted woodwasps to the species level, whereas Canada identified 25% and New Zealand 75%. Identification of the intercepted woodwasp and its country of origin is critical for effective biosecurity. Nardi et al. (2026) express consternation that only 17.8% of interceptions were identified to species level. Even worse, U.S. phytosanitary officials identified less than 10% of the intercepted woodwasps to species. Canadian officials identified 25%, and New Zealand officials identified 75%. Yes, the taxonomy of the family is complex and in flux. And U.S. port staff must process orders of magnitude more interceptions of woodwasps than do either Canada or New Zealand. However, to understand which species are approaching American borders USDA APHIS (which performs the identifications) needs to provide specialized training and apply modern tools e.g., barcoding, molecular diagnostics. CBP and APHIS must also allow adequate time to process the detection before determining the fate of the shipment.
U.S. authorities also did not document the country of origin of 83% of shipments associated with Siricid-infested wood packaging intercepted. New Zealand authorities recorded the country of origin of 78% of intercepted shipments, Canadians of 90%.
Lack of information on sampling effort impedes exploitation of valuable info. Haack et al. (2014) discuss this obstacle in detail. Nardi et al. (2026) note that changing inspection and reporting priorities – especially when not explicitly described – hamper analysis of which factors explain variations in interception rates over time.
5) Interceptions of Siricids on wood packaging from regions outside the species’ native range have been increasing since the 1960s. Overall, 2.2% of the 504 interceptions named to species level were imported from countries to which they are not native. This included 12.3% of Sirex noctilio (from North America, the Neotropics, and Africa); 3.2% of Urocerusgigas (from North America and the Neotropics).
These secondary invasions are often from “bridgehead” populations in the Southern Hemisphere. Nardi et al. (2026) worry that such invasion bridgeheads established in trade hubs could speed up biological homogenization of their region.
6) Only a few of the more than 100 species in the family have established in novel regions although many additional species have frequently been intercepted in wood packaging by port inspectors. The species that have established are Sirex noctilio (introduced from Eurasia to North and South America, Australia, New Zealand, and South Africa); and two North American species: Urocerus albicornis (introduced to Europe and Asia) and Sirex obesus to South America. This pattern suggests that biological, environmental, or dispersal barriers interfere with establishment of other Sirex species even when they are transported to new regions.
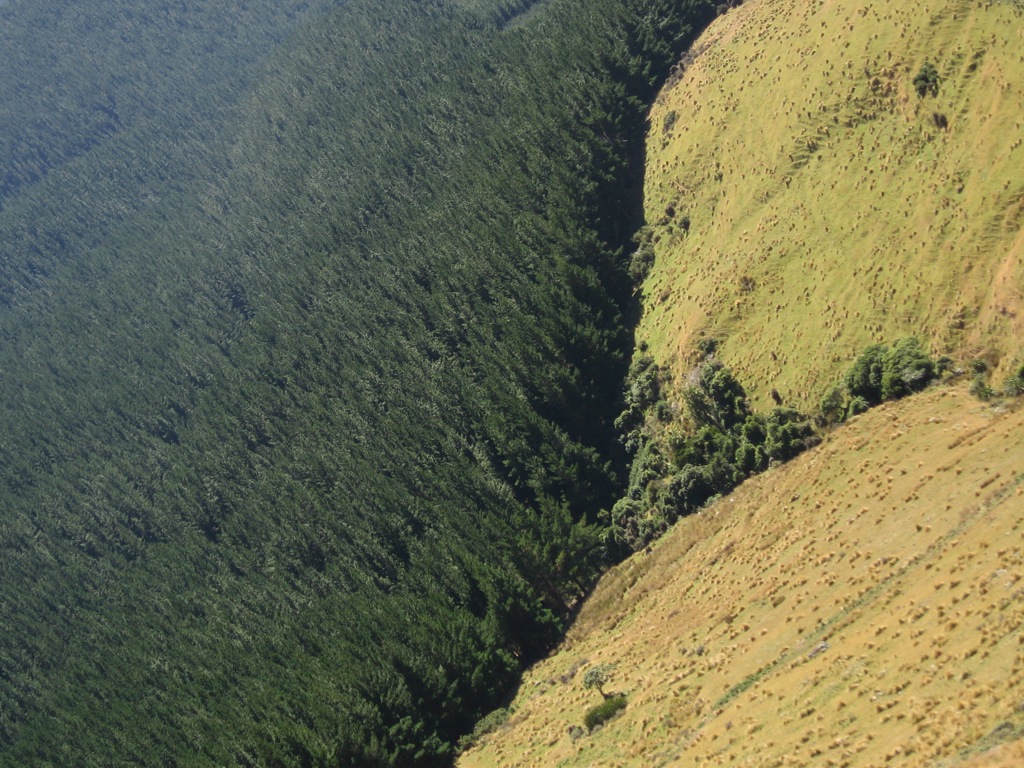
exotic pine plantation in New Zealand; photo by Jon Sullivan via Flickr
One example might be Sirex juvencus. Although it has been intercepted 215 times by one of the three countries, it has not established outside its native range. Nardi et al. (2026) note that the species prefers spruce (Picea spp.), which are much less commonly planted in Southern hemisphere plantations and around the Northen Hemisphere than the pines (Pinus spp.) that support establishment of S. noctilio and U. gigas.
The role of the associated fungi is another factor. Nardi et al. (2026) note that another woodwasp species, Xeris spectrum, has not established in New Zealand despite being intercepted often by that country’s phytosanitary officials and presence of suitable hosts. They note that is species does not transport the symbiotic fungi on its body as do other woodwasps. Instead it oviposits on trees already infested with Amylostereum fungus that was injected by an earlier invasive woodwasp. (A successful biological control program has reduced infestations of S. noctilio, so pine plantations are again widespread on the islands.)
Nardi et al. (2026) warn about several cryptic dangers. First, horizontal transfer of associated symbiont basidiomycete fungal species has been documented: Amylostereum fungal strains from European S. noctilio to American Urocerus species. Such transfers might increase the pathogenicity of formerly benign introductions. Second, scientists don’t yet understand the probable effects of climate change on insect and fungal species’ life cycles. They mention specifically the Asian species Sirex nitobei because its hosts are widespread Pinus species and it has been detected repeatedly, esp. on dunnage.
Nardi et al. (2026) suggest that officials should consider these ecological factors in assessing the risk of new introductions of specific species. I counter that the underlying rationale for adopting ISPM#15 was recognition that trying to manage individual species or countries of origin would not be effective. Instead, I advocate much more assertive enforcement of the standard.
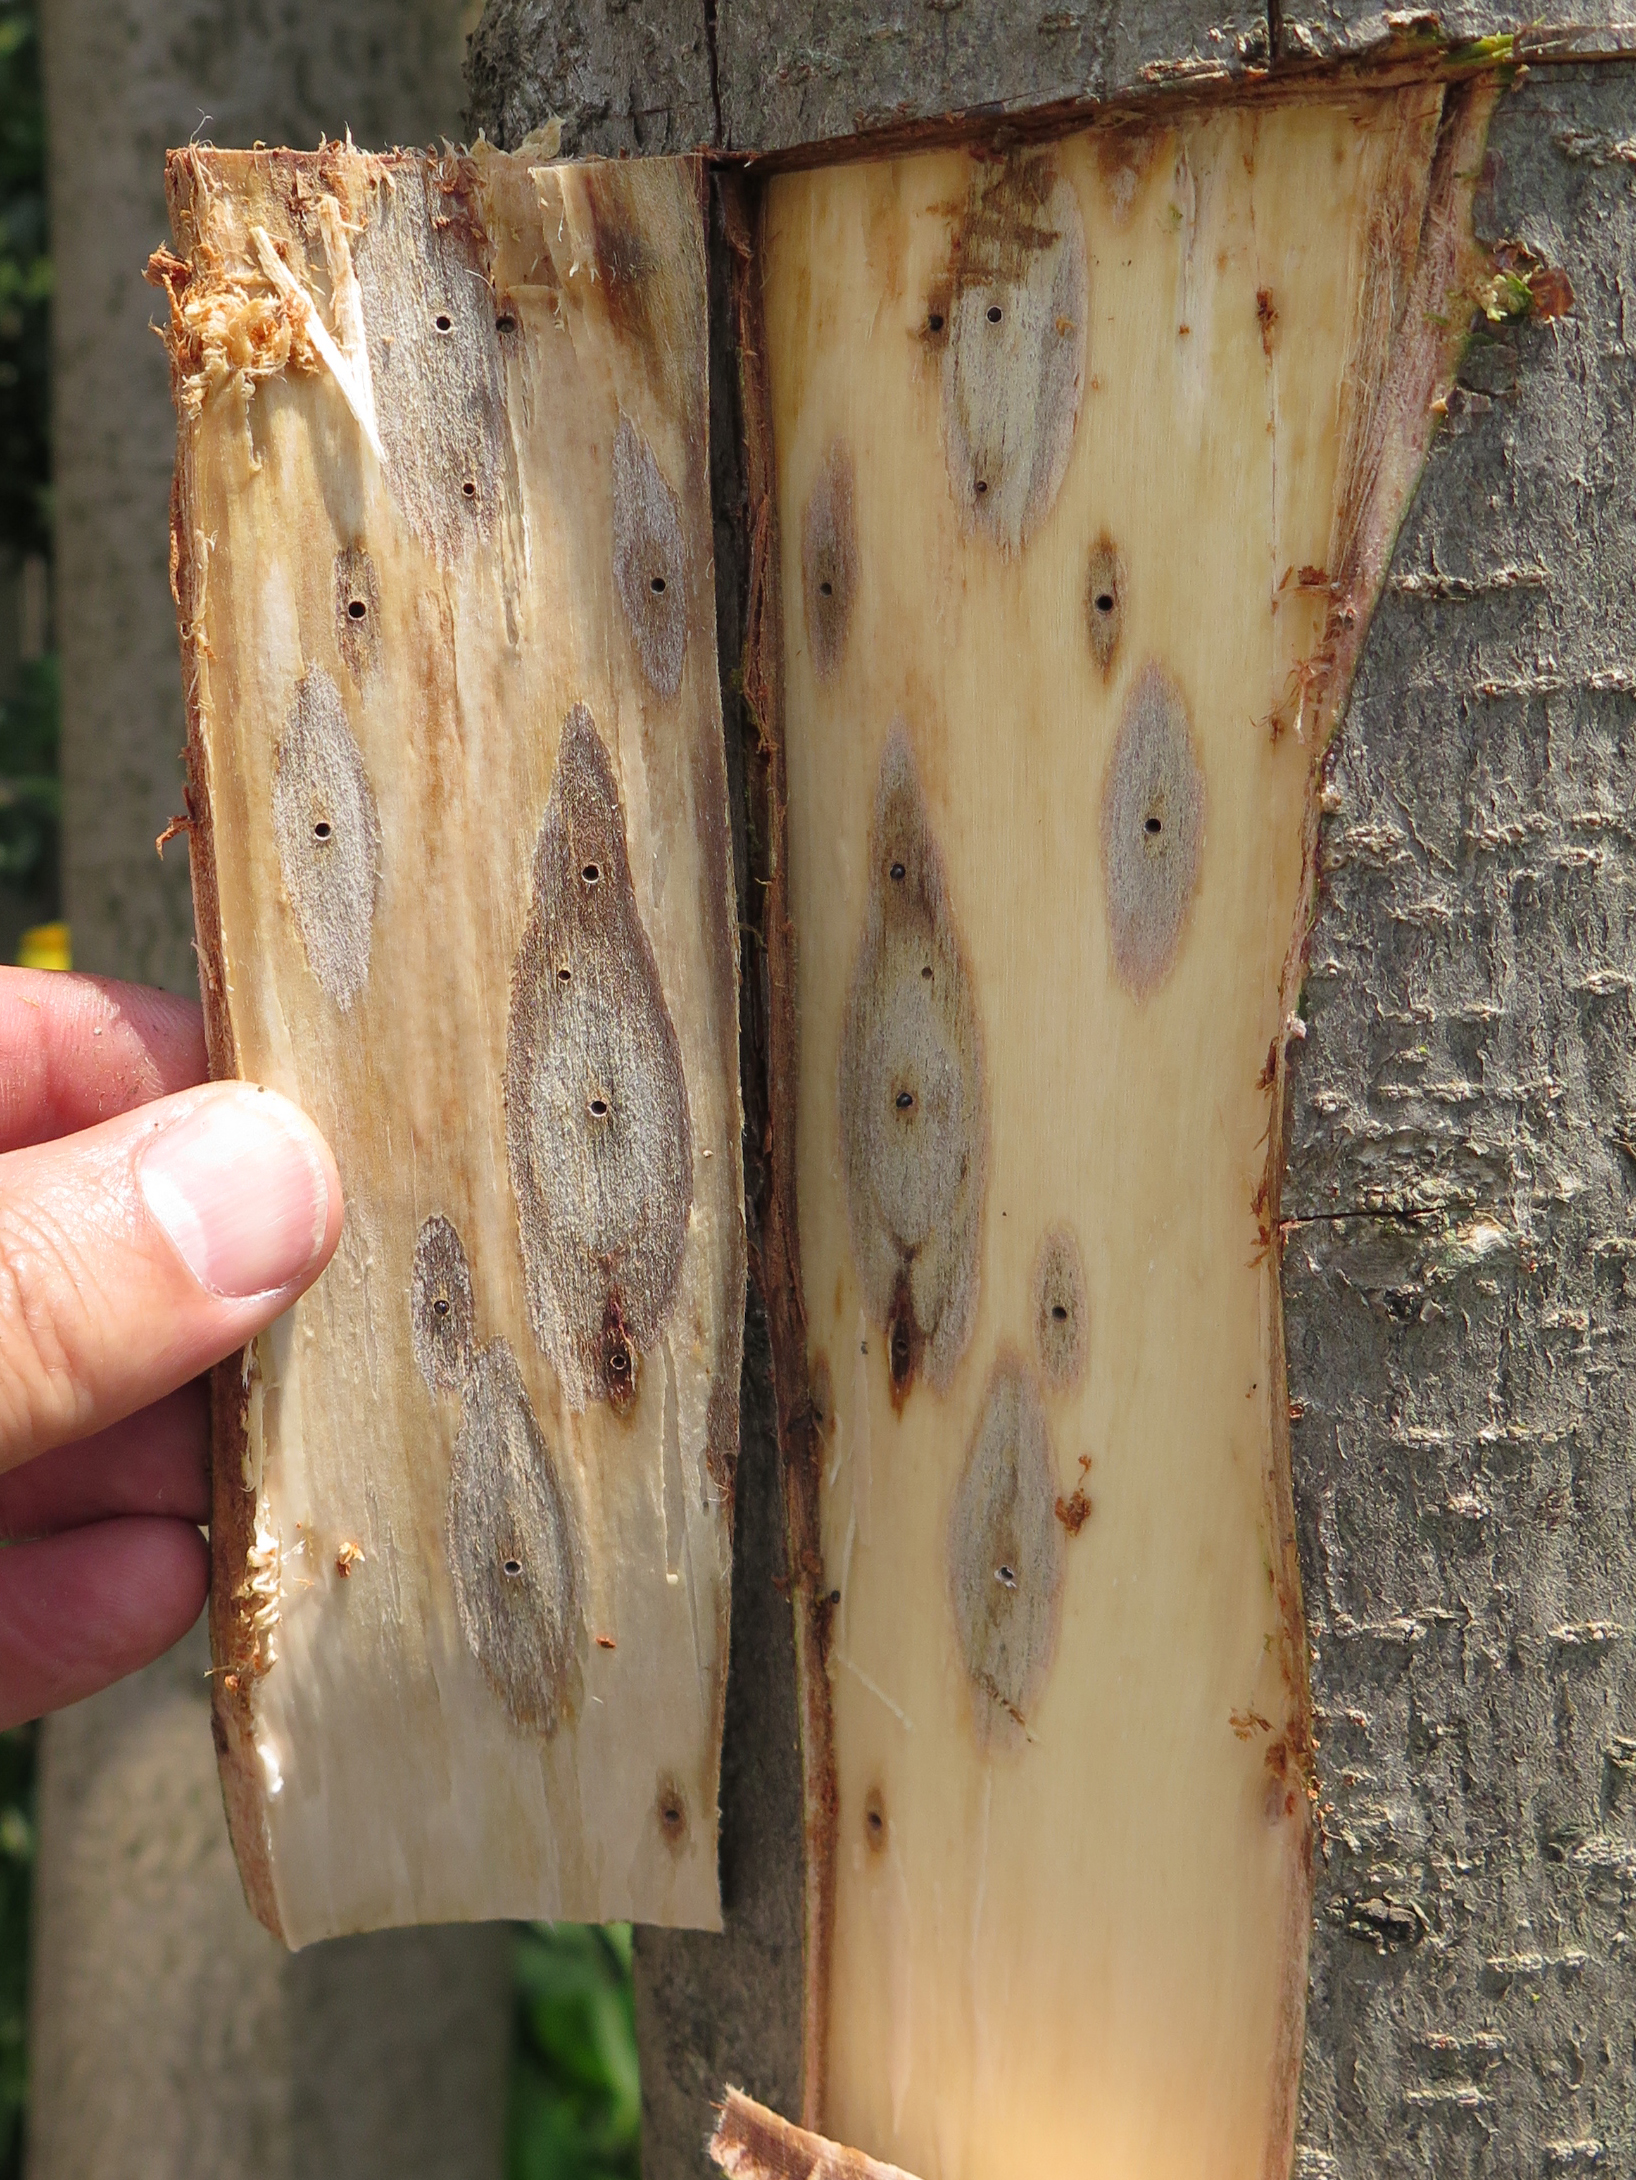
PSHB damage to Harepephyllum caffrum tree in South Africa; photo by Trudy Paap
Invasive shothole borers
Based on analysis on distribution of haplotypes, phylogenetic relationships and dates of first detections, Lantschner et al. (2026) identified seven independent introduction events of the polyphagous shot hole borer (PSHB) Euwallacea fornicatus: to the continental U.S., Hawai`i, South America, Central Europe, Spain, Türkiye, and South Africa. Most apparently originated directly from the species’ native range, although some evidence of likely secondary spread between already invaded regions. Several of these introductions – Israel (2009), South Africa (2016); Brazil (2020), Argentina and Australia (2021), Spain (2022), Uruguay (2023), and Türkiye (2024) – occurred despite stricter biosecurity measures, specifically ISPM#15.
The United States (California) experienced two additional invasions by Euwallaceae in the 2020s: by PSHB E. fornicatus (in San Jose) and a new species, E. interjectus. This makes a total of nine separate introductions.
Lantschner et al. (2026) suggest two opposite explanations for why so many introductions of this group of species from Asia have continued since ISPM#15 came into effect. Their suggestions are that either beetle populations in China, Taiwan, and/or Vietnam grew, thus increasing the pool of potential invaders/propagule pressure, or that increased international exports from these countries opened new commercial pathways. Certainly the latter has occurred. According to Google, exports from China rose from less than $500 billion in 2003 to ~ $4 trillion in 2025. Exports from Vietnam rose from ~$22 billion to $500 billion over the same period.
To be fair, most consider that the principal pathway for movement of species in the Euwallaceae complex is the trade in ornamental plants. In addition to the introductions listed above, E. fornicatus populations have been detected in greenhouses or botanical gardens in Italy, Germany, the Netherlands, and Poland. All have been reported as eradicated (Lantschner et al. 2026). I recently posted a blog discussing the widespread failure of the international phytosanitary system to stem introductions via this trade.
A second group of scientists (Dell, Xu, and Chi 2026) worry that E. fornicatus has spread especially rapidly in South Africa and South America. Already the outbreak of Fusasrium disease in South Africa is the largest the world: it is present in every province except Limpopo. The disease is recorded on 162 tree species, 78 of which are indigenous to the country (Townsend, Hill, Hurley and Roets 2025).
The introduced ranges – sometimes called bridgeheads – create conditions under which the pest can more easily spread further. Lantschner et al. (2026) suggest that the PSHB population established in southern California could spread into the American southeast, eastern Mexico, and parts of Central America. The population in South Africa might expand into other temperate and subtropical regions of Africa. Beetle populations established in Spain, Israel and Türkiye might spread across Mediterranean basin. Population in Western Australia could spread to eastern regions. They note that achieving some of these dispersals would require crossing substantial gaps of unsuitable habitat. They don’t mention that human transport has moved many populations of wood-boring beetles across unsuitable habitat! As I blogged earlier, officials in Sydney, Australia, determined that 47% of trees in the city are vulnerable to PSHB.
SOURCES
Carnegie AJ, Summerell BA, Trollip C, Tovar F, Smith DI and McDonald J (2026) Sentinel trees for early detection of non-native forest pests and pathogens in AU. Front. For. Glob. Change 9:1801183. doi: 10.3389/ffgc.2026.1801183
Dell, B., W. Xu, and N.M. Chi. 2026. Polyphagous Shot Hole Borer, a Global Threat to Forest Plantations, Green Infrastructure, and Biodiversity: Status, Challenges, and Solutions. Forests 2026, 17, 832
Lantschner, M.V., E. Ceriani-Nakamurakare, A.J. Johnson, A.I. Cognato, S.M. Smith, D.F. Gomez. 2026. Invasion history reconstruction and potential distribution of the ambrosia beetles Euwallacea fornicatus and E. perbrevis (Coleoptera: Scolytinae), two global emerging pests. J Pest Sci 99, 100 (2026). https://doi.org/10.1007/s10340-026-02070-w
Nardi, D., K.E. Wagner, S.F. Ward, A.M. Liebhold, E.G. Brockerhoff, R.M. Turner, J.J. Riggins. 2026. Global movement of woodwasps (Hymenoptera: Siricidae) inferred from border interception records Biol Invasions (2026) 28:167 https://doi.org/10.1007/s10530-026-03881-9
Townsend, G., M. Hill, B.P. Hurley, and F. Roets. 2025. Escalating threat: increasing impact of the polyphagous shot hole borer beetle, Euwallacea fornicatus, in nearly all major South African forest types. Biol Invasions (2025) 27:88 https://doi.org/10.1007/s10530-025-03551-2
Posted by Faith Campbell
We welcome comments that supplement or correct factual information, suggest new approaches, or promote thoughtful consideration. We post comments that disagree with us — but not those we judge to be not civil or inflammatory.
For a detailed discussion of the policies and practices that have allowed these pests to enter and spread – and that do not promote effective restoration strategies – review the Fading Forests report at http://treeimprovement.utk.edu/FadingForests.htm
The international movement of plant material, particularly plants for planting, is widely acknowledged as a principal driver of the global eruption of forest health epidemics (Brasier, 2008; Turbelin et al., 2017; Tanney et al. 2025; Burgess and Wingfield 2026). The international plant health (or phytosanitary) community in 2012 adopted ISPM#36, with the goal of reducing pest and pathogen introductions on nursery stock. (“Plants for planting” is the regulatory term for this stock.) However, the top pages of the International Plant Protection Convention’s (IPPC) website do not mention either this issue or the IPPC’s response – this international standard!
Charles L. Marlatt
Actually, awareness of this risk dates to the 19th Century, at least in Europe. USDA entomologist Charles Marlatt campaigned for the United States to impose phytosanitary rules beginning in 1911. He published a bulletin warning that the U.S. had become a “dumping ground” for contaminated nursery stock from Europe and urged the Congress to act. Marlatt is most famous for requiring destruction of diseased cherry trees sent as a gift by Japan. Liebhold and Griffin, in their summary of these events, do not comment on the fact that Marlatt acted without Congressional authority, although destruction of the cherry trees received permission from President Taft. Diplomatic exchanges resulted in Tokyo sending a new batch of pest-free cherries – their descendants grace the Tidal Basin and other parts of Washington, D.C. to this day. At Marlatt’s urging, and following realization of the damage caused by white pine blister rust, Congress adopted the Plant Protection Act in 1912.
This shows that it is possible to protect America’s flora while still enjoying imported plants. But this requires prompt and decisive action, well-prepared in advance, without the likelihood of legal challenges.
Pathogen and Pest Invasions Are Predictable Outcomes
Tanney et al. (2025) say it this way: “We trade not just in plants but also in phytobiomes.” [The phytobiome is the community of microorganisms living on and within a plant.] Burgess and Wingfield (2026) pronounce that invasions are not anomalies but rather predictable outcomes of global commerce interacting with ecological susceptibility. The global nursery trade creates extensive networks that enable the continuous exchange of live plant material across continents. Unlike many others, Burgess and Wingfield (2026) focus not on ornamental horticulture but the repeated occurrence of devastating outbreaks in Eucalyptus and Pinus plantations across the Southern Hemisphere.
Despite a century of efforts to curtail harmful introductions and 70 years after formation of the IPPC, devastating arthropods and disease pathogens continue to be introduced.
beech leaf disease symptoms, Fairfax County Virginia; photo by F.T.
To this list, I add beech leaf disease nematode (Litylenchus crenatae mccannii), the Euwallaceae/Fusarium complex, and, in Europe, lawson cypress root disease, along with numerous arthropods. These include emerald ash borer (Agrilus plannipennis), goldspotted oak borer (Agrilus auroguttatus), Erythrinagall wasp (Quadrastichus erythrinae). All have irreversibly shaped forest ecosystems in their introduced ranges. The forest losses have had numerous repercussions to human societies in the receiving regions.
ohia trees killed by rapid ohia death; photo by Richard Sniezko, USFS
Mitigation Can’t Keep Up Due to System Failures
Tanney et al. 2025 opine that the inevitable conclusion is that past and current mitigation efforts have been insufficient to keep pace. Nor do the failures result only from growing volumes of imports that overwhelm inspection services.
They point to another reason: limited acknowledgment and integration of phytobiome-associated risks into regulatory frameworks. The system ignores particularly fungal endophytes and latent pathogens with extended asymptomatic or presymptomatic phases.
Their telling illustration is the ash decline epidemic in Europe. Hymenoscyphus fraxineus is a harmless endophyte–saprotroph on its native Asian host (Fraxinus mandshurica). However, it was introduced to the naïve host European ash (Fraxinus excelsior), on which it became an aggressive necrotrophic pathogen that has killed millions of trees. Even if the organism had been detected (the authors thought this unlikely) before the outbreak was recognized, the detection would not have triggered a risk assessment or any phytosanitary measures. None of the approximately 200 species in the genus had been reported as a pathogen. In fact, a congener, H. albidus, has a similar endophyte– saprotroph life cycle on European ash without causing harm.
McTaggart et al. (2016) flagged these issues a decade ago. They said that recent advances in gene sequencing technologies reveal a vast diversity of fungi causing asymptomatic infections. Some are endophytes, defined as fungi that, for all or part of their life history, asymptomatically colonize plant tissue. Some are pathogens with extended asymptomatic stages. When introduced to naïve hosts, some of either can erupt. Therefore, international phytosanitary measures, including the one significant effort to address the plants for planting pathway, ISPM#36, should focus more on phytobiomes as a biosecurity concern. (See my blog reporting Dr. Eliana Torres Bedoya on this topic.)
Tanney et al. (2025) are not alone in calling out the system’s failure. See Weed, Ayres, and Hicke (2013), Fei et al. (2019), Quirion et al. (2021) for North America; and Gougherty, Sitzia et al. (2021) and Martinac et al. (2025) for a global perspective. Raffa et al. (2023) say national and international phytosanitary policies and programs must reflect the true level of threat from introduced plant pathogens (of all Phyla and Kingdoms) and scientific limits.
Experts on ambrosia beetles – insects that have symbiotic relationships with fungi – say the same. Dell, Xu and Chi 2026 call for studies of Euwallaceae fornicatus’s broader phytobiome, especially bacterial communities, which are increasingly recognized as important components of the ambrosia beetle system.
Nor are Tanney et al. (2025) alone in calling on phytosanitary officials to stop using methods known to fail. That is, relying on visual inspections of plants and basing decisions on whether a pest has previously been designated.
A decade ago McTaggart et al. (2016) called for shifting from a name-based to a gene-based biosecurity risk mitigation approach. Burgess and Wingfield (2026) say officials must move beyond case-by-case responses to embrace broader preventative approaches that address the underlying mechanisms of pathogen emergence and spread.
As Tanney et al. (2025) and Bonello describe, the current international phytosanitary framework relies on symptomatic hosts carrying named pathogens. This approach ignores the facts:
endophytes and latent pathogens with prolonged asymptomatic phases are
ubiquitous – on and in leaves, buds, inflorescences, fruit, seeds, xylem, phloem, cambium, and bark. Phytobiomes are more species-rich on plants lacking disease symptoms.
diverse – fungi, bacteria, viruses, nematodes. Some are known pathogens.
challenging to identify. They often can’t be isolated using standard lab processes. If the genome has not already been sequenced and recorded in databases even sequencing-informative loci or barcodes might fail to identify the taxa. (Only ~150,000 species of an estimated 2.5 million fungi are so compiled.)
in some cases, a significant threat to forest health when introduced to naïve realms.
Scientists cannot predict impacts that might accompany introduction of nearly any of these organisms to a naïve host. Missing information pertains, inter alia, to endophyte identities and life histories, trees’ defenses, and the effects of the current and changing climate.
Host ranges might shift during an organism’s life cycle, e.g., juvenile vs. mature/reproducing.
Host jumps within the same host genus are likely (Tanney et al. 2025). They say that importing living plant into areas with congeneric endemic plants is highly risky.
Most endophytes in woody plants can be horizontally transmitted by abiotic (e.g., wind, rain, and surface water movement) transmission and biotic (e.g., insect) vectors. Every colonized leaf might be a propagule! (Tanney et al. 2025)
Microbes might reproduce both asexually and sexually. Sometimes dispersal of these propagule uses different modes, e.g., insect- and water-dispersed asexual spores combined vs. air-dispersed sexual spores.
Endophytes can switch from being asymptomatic to pathogenic when hosts are stressed. Tanney et al. (2025) name several examples, including Fusarium circinatum – causal agent of pine pitch canker.
To protect our plant resources – in forests, in agricultural fields, in our gardens – scientists must be empowered to develop methods and policies that better account for unnamed and unknown organisms.
Tanney et al. (2025) note that there is some flexibility in the face of unknown threats. The World Trade Organization’s Agreement on the Application of Sanitary and Phytosanitary Standards (SPS Agreement) and ISPM#2 allow adoption of a temporary phytosanitary measure based on the information available, even when it is limited. APHIS’ NAPPRA program link takes this approach. I think countries could use this flexibility more often. (I discuss the SPS and IPPC system in greater detail in my report Fading Forests II. I provide a link at the end of this blog.)
How to Improve Prevention
Some progress has been made in countering introductions of arthropods. Adoption of ISPM#15 regulates an entire pathway (crates, pallets, and other forms of packaging made from wood). CISP applauds the approach but calls for more aggressive enforcement. (On this website, scroll down below “Archives” to “Categories”, click on “wood packaging”). I note that introductions via this pathway nevertheless continue: Lantschner et al. (2026) have identified seven independent introductions of Euwallacea fornicatus. Introductions to San Jose, California; Israel; South Africa; Brazil; Spain; and Türkiye occurred after most countries had begun implementing ISPM#15. The same is true of the introduction of the congener E. kuroshio to southern California. Nardi et al. (2026) demonstrate continuing introductions of woodwasps in wood packaging.
Unlike wood products, imported plants, especially those intended to be planted in the new location, must remain alive and healthy. It is extremely challenging to devise effective treatments to kill the arthropod or pathogen without harming the plant. Tanney et al. (2025) discuss the pros and cons of several options, including ionizing radiation, fungicide treatments, and various heat treatments. They note that more research is needed to assess the feasibility, efficacy, optimal dosage, and potential risks of devitalizing plants in high-throughput treatments.
New Tools for Prevention
So the focus remains on preventing introductions. Fortunately, new tools make possible new approaches.
Detection of Pathogens — Tanney et al. (2025), Carnegie et al. (2026), Burgess and Wingfield 2026, and Bonello (pers. comm.) point to the suite of new molecular, remote sensing, and artificial intelligence tools becoming usable for detecting pathogens. They and Dell, Xu and Chi (2026) stress that citizen science can extend the reach of formal surveillance.
Rapid Responses — Tanney et al. (2025) and Carnegie et al. (2026) concede that more work is needed to address such considerations as detecting DNA from nonviable cells, and to develop international standards. However, they assert that results from these tools are already sufficiently science-based to inform decision-making, specifically to implement rapid responses including precautionary quarantines and other measures along with intensive surveys and conducting triage assessments.
Inspection and Enforcement — Burgess and Wingfield (2026) call more generally for enforcing comprehensive phytosanitary treatments and certifications for the live plant and timber trades, and focusing inspection efforts on high-risk entry points. Port detection can be sped up and improved by applying rapid molecular diagnostic tools.
Risk Assessments — New tools and approaches can also improve risk assessments. I blogged earlier about advances in predicting which trees are likely highly damaged, if certain pest insects are introduced. See Mech et al. 2019; Raffa et al. 2023; Schulz et al. 2025; Uden et al. 2022. This is encouraging, although additional work on arthropods is still needed. Carnegie et al. (2026) and Hulcr (2026, USDA Interagency Symposium on Invasive Species, Annapolis Maryland) both note the need for continued investment in taxonomic surveys to generate baseline data.
Predicting the probable impacts of introduced pathogens is inherently more difficult.
After introduction to novel systems pathogens sometimes evolve rapidly and becoming more aggressive and difficult to manage (Burgess and Wingfield 2026).
Host jumps within the host genus are likely. This exacerbates the risk arising from importing living plants into areas with congeneric endemic plants. Under these circumstances the risk assessment must be especially careful in balancing economic and social benefits of trade w/ potential ecological, economic, and social consequences of invasion (Tanney et al. 2025; Burgess and Wingfield 2026). Tanney et al. (2025) recommend systematic studies of regularly traded species from areas of origin (or sites of production) to eventual destinations to provide a foundation for assessing the risk of phytobiomes arriving on imported plants. These studies would also help to determine effectiveness of management approaches.
A number of authors are exploring how to address these difficulties. For example, Tanney et al. (2025) advise using “omics”-based approaches to predict invasiveness, virulence, and host interactions. Caveat: same genes are present regardless of whether the organism is an endophyte on its native host or a pathogen on a naïve host. At the same time, host response must be assessed by combining omics-based approaches, sentinel plantings, and modeling.
Tanney et al. (2025) also recommend greatly expanding sentinel planting-based surveillance. Sentinel plant systems must be carefully managed to provide the necessary levels of information. Raffaet al. (2023) nivemdiscuss strengths and weaknesses of this approach. Eliana Torres Bedoya and Enrico Bonello blog warn that sentinel plantings must support screening all plant parts, above and below-ground, for all potentially pathogenic taxa, including nematodes, phytoplasmas, and viruses. Furthermore, samples must be analyzed from asymptomatic plants, not just those showing signs of disease. Finally, samples must be collected throughout the year. Carnegie et al. (2026) call for greater coordination within the country and with international colleagues (e.g., through the International Plant Sentinel Network (IPSN).
Tanney et al. (2025) provide a convenient list of approaches they think will help close the knowledge gaps that challenge integrating attention to phytobiomes into phytosanitary decision-making.
Tanney et al. (2025) and Burgess and Wingfield (2026) advocate shifting the focus of risk assessments from specific pests to commodity-based or pathway risk assessments that consider unknown but plausible threats.
Horizon scanning is often described as helpful in predicting the next invasion. However, I have been disappointed by the usefulness demonstrated by some applications of the approach – at least in the absence of policies and resources to support a robust “rapid response”. At least in Cyprus blog and the United Kingdom, the main response to detection of one of the predicted species is only heightened monitoring — not attempted management!! According to Peyton et al. (2026), the British exercise failed to evaluate 78% of the 112 species that were introduced over the following decade. The vast majority were not evaluated because they were expected to have negligible impacts on biodiversity in Britain — but some turned out to be damaging.
Countries also need current data on which to base analyses and determine efficacy of programs. I regret that all American analyses of the risk associated with imported “plants for planting” rely on data collected by Liebhold et al. (2012) — which is from 2009!! Not only are these data 17 years old; APHIS has made major changes to its regulations in the interval — including implementation of the NAPPRA program.
The missing component often is rapid response – often justified by uncertainty regarding the introduced organism’s possible impacts.Wingfield and Burgess (2026) cite the example of Australia’s weak response to detection of myrtle rust, Austropuccinia psidii. Now established in the rainforests of eastern Australia (states of New South Wales, Queensland, and Victoria) and an outbreak in Western Australia, myrtle rust threatens at least 76 species. Australia is home to 38% of all species in the vulnerable Myrtaceae family (Carnegie et al. 2026).
myrtle rust on Melaleuca tree in Australia; photo by John Tann via Flickr
Burgess and Wingfield (2026) cite several lessons based on the Northern Hemisphere’s experience with pathogen introductions. They call specifically for more stringent phytosanitary standards, advanced diagnostic techniques, and risk-optimized surveillance. These should be backed up by collaborative resistance breeding programs for high-risk hosts. They note the need for international cooperation across science, policy, industry, and communities.
Proposed Amendments to Trade Regulations
Tanney et al. (2025) point to the value of shifting to a system that favors trading in propagative material with subsequent bulking up in the importing countries for domestic consumption. (See also my advocacy in Fading Forests II.) They concede that this approach is unlikely to be implemented. As a fallback, they suggest applying this approach to the highest-risk commodities, e.g., rhododendron plants. They note that these plants have transported Phytophthora ramorum.
Scientific Fields
Burgess and Wingfield (2026) point to the need for multidisciplinary research to integrate forest pathology with chemical, ecological and social sciences to anticipate pest emergence. I add: integrating plant pathology with invasion science. The two disciplines rarely interact. Paap et al. (2020) suggest a framework to bridge this gap. I noted that the recent IUCN survey regarding the need for an updated species conservation strategy, while it incorporates invasive species issues, did not mention regional phytosanitary organizations, such as EPPO or NAPPO, among the bodies with whom invasions scientists should build relationships.
Interestingly, a group of experts on invasive plants (Hulme et al. 2026) are trying to expand relationships among researchers even more broadly. They seek to integrate invasion science into on-going discussion of global megatrends. Megatrends are clusters of interdependent global trends observed today that together have the potential to cause significant shifts in environmental, economic, and social conditions. At present, government, industrial, and other leaders evaluating how societies might adapt to these changes are not even considering their probable effect on bioinvasions. At least bioinvasion scientists are starting to evaluate the effects of the megatrends.
The invasion scientists explored how 15 megatrends might affect arrival, establishment, spread, and impacts (environmental and economic) of invading non-native plants over the next 25 years. They grouped the trends into four larger gigatrends: “Anthropocene”, “Digital”, “Societal”, and “Technology”.
They expect most of the megatrends to increase invasion risks, especially by accelerating species arrival and spread. While trends grouped under “Technology” promise some improvements in detection and control tools, there are significant barriers to their adoption. This worrying statement should be addressed by the proponents of applying these measures I cited earlier.
Hulme et al. (2026) urge invasion scientists to persuade policymakers that by taking decisive action to steer these trajectories toward mitigating the growing global threat of bioinvasion.
The Need for Adequate Funding and Political Support
Burgess and Wingfield (2026) note that risk assessment, inspection, detection, and response programs need to be supported by investment in quarantine infrastructure, diagnostic laboratories, and emergency response funds to enhance readiness for new incursions.
As they stress, prevention and preparedness cannot rest solely with scientists. Political commitment, regulatory authority, and industry engagement are indispensable. The efforts need the active participation of affected economic sectors, and sustained investment by governments, scientific institutions, industry, and society. The need for reliable, long-term funding and societal support is shared with all invasive species programs. Nearly all participants in the IUCN survey ranked this need at the top.
Property owners, the wood products and nursery industries, and governments from municipal to national have incurred substantial economic costs. Entire wooded ecosystems have been destroyed. Affected stakeholders, however, have not demanded that officials adopt more effective plant health strategies to reduce this risk. Scott Schlarbaum and I have released three “Fading Forest” reports trying to make this happen (links provided below). As shown here, many scientists are calling for action. To quote the late Congressman John Lewis in the context of civil rights, “If not now, when? If not you, who?”
SOURCES
Burgess, T.I. and M.J. Wingfield. 2026. Unveiling a Hidden Menace: Invasive Tree Pathogens, Less Known but Increasingly Threatening Southern Hemisphere Forests Annual Review of Phytopathology 64:18.1–18.2664:18.1–18.26
Carnegie, A.J., B.A. Summerell, C. Trollip F. Tovar, D.I. Smith, and J. McDonald. 2026. Sentinel trees for early detection of non-native forest pests and pathogens in Australia. Front. For. Glob. Change 9:1801183. doi: 10.3389/ffgc.2026.1801183
Dell, B., W. Xu, and N.M. Chi. 2026. Polyphagous Shot Hole Borer, a Global Threat to Forest Plantations, Green Infrastructure, and Biodiversity: Status, Challenges, and Solutions. Forests, 17, 832
Fei, S., R.S. Morin, C.M. Oswalt, & A.M. 2019. Biomass losses resulting from insect & disease invasions in United States forests
Gougherty, A.V. & Davis,T.J. (2024) Evolutionary history of host trees amplifies the dilution effect of biodiversity on forest pests. PLoSBio. 22(2):e30024730 https://doi.org/10.1371/journal.pbio.3002475 PLOSBiology |https://doi.org/10.1371/journal.pbio.3002473 February 27, 2024 1 / 1
Hulme, P.E., J.N. Barney, J.L. Bufford, J.A. Catford, J.A. Coetzee, C.C. Daehler, M.S. Dechoum, H. Jäger, A. Pauchard, P. Pyšek, D.M. Richardson, M. Vilà, E. Wandrag, J.R.U. Wilson. 2026. Seeds of change: Global megatrends will shape the future trajectory of plant invasions. BioScience , 2026, https://doi.org/10.1093/biosci/biag096
Lantschner, M.V., E. Ceriani-Nakamurakare, A.J. Johnson, A.I. Cognato, S.M. Smith, D.F. Gomez. 2026. Invasion history reconstruction and potential distribution of the ambrosia beetles Euwallacea fornicatus and E. perbrevis (Coleoptera: Scolytinae), two global emerging pests. J Pest Sci 99, 100 2026. https://doi.org/10.1007/s10340-026-02070-w
Liebhold, A.M., E.G. Brockerhoff, L.J. Garrett, J.L. Parke, and K.O. Britton. 2012. Live Plant Imports: the Major Pathway for Forest Insect and Pathogen Invasions of the US. www.frontiersinecology.org
Martinac, M-L., F. Ningre, A. Dowkiw, N.Le Goff, B. Marcais. 2025. High host density favour ash dieback. Plant Pathology 2025, 74 (5) 10.1111/ppa.14099
Martinou, A.F., J. Demetirou, I. Angelidou, N. Kassinis, A. Melifronidou, J.M. Peyton, H.E. Roy, A.N.G. Kirschel. 2026. Multiple introductions of invasive alien species on a Mediterranean island predicted by horizon scanning. Biological Invasions 2026 28:41 https://doi.org/10.1007/s10530-025-03729-8
McTaggart, A.R., M.A. van der Nest, E.T. Steenkamp, J. Roux, B. Slippers, L.S. Shuey, et al. (2016) Fungal Genomics Challenges the Dogma of Name-Based Biosecurity. PLoS Pathog 12(5): e1005475. doi:10.1371/journal.ppat.1005475
Mech, A.M., K.A. Thomas, T.D. Marsico, D.A. Herms, C.R. Allen, M.P. Ayres, K.J. K. Gandhi, J. Gurevitch, N.P. Havill, R.A. Hufbauer, A.M. Liebhold, K.F. Raffa, A.N. Schulz, D.R. Uden, & P.C. Tobin. 2019. Evolutionary history predicts high-impact invasions by herbivorous insects. Ecology & Evolution 9(21): 12216–12230. https://doi.org/10.1002/ece3.5709
Nardi, D., K.E. Wagner, S.F. Ward, A.M. Liebhold, E.G. Brockerhoff, R.M. Turner, J.J. Riggins. 2026. Global movement of woodwasps (Hymenoptera: Siricidae) inferred from border interception records Biol Invasions (2026) 28:167 https://doi.org/10.1007/s10530-026-03881-9
Paap, T., M.J. Wingfield, T.I. Burgess, J.R.U. Wilson, D.M. Richardson, and A. Santini. 202 Harmonising the fields of invasion science and forest pathology NeoBiota Vol 62 2020 pages 301-332
Peyton, J.M., S. Rorke, D.C. Aldridge, O.L. Pescott, K. Dehnen- Schmutz, D.G. Noble, J. Sewell, A.J.A. Stewart, T. Adriaens, B.C. Beckmann, J. R. Britton, J. Brodie1, P.M.J. Brown, I.C.N. Cavadino, P.F. Clark, A.M. Dunn, J.Foster, C. Harrower, M.C. Harvey, M.C. Jackson, T. Jones, C.A. Maggs, G. Martin, F. Mathews, A.C. Mill, D. Murphy, E. Paganini, R. Payne, W. Rabitsch, T. Renals, K. Schönrogge, R.H. Shaw, G.C. Smith, P.D. Stebbing, P.A. Stroh, H. Tidbury, E. Tricarico, J. Vallet, K.J. Walker, L.E. Wood, C.A. Wood, B. Woodcock, H.E. Roy. 2026. Assessing the success of a horizon scanning approach in predicting invasive non-native species arrival. J Appl Ecol. 2026; 63: https://doi.org/10.1111/1365-2664.70217
Quirion BR, Domke GM, Walters BF, Lovett GM, Fargione JE, Greenwood L, Serbesoff-King K, Randall JM & Fei S (2021) P&P Disturbances Correlate With Reduced Carbon Sequestration in Forests of the Contiguous US. Front. For. Glob. Change 4:716582. [Volume 4 | Article 716582] doi: 10.3389/ffgc.2021.716582
Rabaglia, R.J., S.A. Dole, and A.I. Cognato. 2006. Review of American Xyleborina (Coleoptera: Curculionidae: Scolytinae) Occurring North of Mexico, with an Illustrated Key. Ann. Entomol. Soc. Am. 99: 1034–1056.
Raffa, K.F., E.G. Brockerhoff, J-C. Gregoirem, R.C. Hamelin, A.M. Liebhold, A. Santini, R.C. Venette, and M.J. Wingfield. 2023. Approaches to Forecasting Damage by Invasive Forest Insects and Pathogens: A Cross-Assessment. Bioscience Vol. 73, No. 2. February 2023.
Schulz, A.N., N.P. Havill, T.D. Marsico, M.P. Ayres, K.J.K. Gandhi, D.A. Herms, A.M. Hoover, R.A. Hufbauer, A.M. Liebhold, K.F. Raffa, K.A. Thomas, P.C. Tobin, D.R. Uden, A.M. Mech. 2025. What Is a Specialist? Quantifying Host Breadth Enables Impact Prediction for Invasive Herbivores Ecology Letters 28: e70083. https://doi.org/10.1111/ele.70083
Tanney, J.B., M. Kemler, M. Vivas, M.J. Wingfield, and B. Slippers. 2025. Silent invaders: the hidden threat of asymptomatic phytobiomes to forest security. New Phytologist 2025 247: 533–545 doi: 10.1111/nph.70209
Uden, D.R., A.M. Mech, N.P. Havill, A.N. Schulz, M.P. Ayres, D.A. Herms, A.M. Hoover, K.J.K. Gandhi, R.A. Hufbauer, A.M. Liebhold, T.D. Marsico, K.F. Raffa, K.A. Thomas, P.C. Tobin, C.R. Allen. 2022. Phylogenetic risk assessment is robust for forecasting the impact of European insects on No Am conifers. Ecological Applications 33(2): e2761. https://doi.org/10.1002/eap.2761
Weed, A.S., M.P. Ayers, J.A. Hicke. 2013. Consequences of climate change for biotic disturbances in North American forests. Ecological Monographs, 83(4), 2013, pp. 441–470
Posted by Faith Campbell
We welcome comments that supplement or correct factual information, suggest new approaches, or promote thoughtful consideration. We post comments that disagree with us — but not those we judge to be not civil or inflammatory.
For a detailed discussion of the policies and practices that have allowed these pests to enter and spread – and that do not promote effective restoration strategies – review the Fading Forests report at http://treeimprovement.utk.edu/FadingForests.htm
a large kauri tree on New Zealand’s North Island; photo by F.T. Campbell
I applaud the growing attention to the impacts of deadly pathogens in forests. The focus is often on the resulting decrease in tree-based storage of atmospheric CO2. In an earlier blog I cited findings by Quirion et al. (2021) that forest diseases in the United States between 2001 and 2019 reduced mean forest carbon sequestration by 28%. Forests were converted from carbon storage to carbon sources. [Full citations for all sources provided at the end of this blog.] Earlier, Fei et al. (2019) had determined that compensatory growth by non-host species (spurred by reduced competition and greater resource availability after a dominant tree species dies) might partially offset CO2 decline, although only over long timescales. Chan et al. (2026) cite examples from redwoods in California to Dipterocarps in Southest Asia that document the importance of large trees in sequestering atmospheric CO2. See also Calders et al. re: Wytham Woods in the United Kingdom.
A pertinent current example is found in New Zealand. There, the oomycete Phytophthora agathidicida is killing the endemic kauri tree, Agathis australis. Kauri are among the largest and longest-lived trees on Earth. The average age of large individuals in old-growth stands is ~ 600 years; exceptional specimens reach 1,600 years. Typical diameters in old-growth stands are 1.3–1.5 m; exceptional specimens > 7 meters (Chan et al. 2026).
A year ago Simpkins et al. (2025) reported a modeling study that indicated that kauri dieback disease could cause a decrease in aboveground carbon stocks by 55% over 500 years. However, as Chan et al. (2026) point out, stand-level carbon sequestration and storage in a forest undergoing widespread mortality of the dominant tree species depend on growth and productivity of the replacement species. Even the magnitude of short-term dynamics depends on the relative abundance of the vulnerable host and the rate of its mortality and decline.
Therefore they explored the impact of kauri dieback in greater detail, including which species they thought likely to replace kauri and their carbon-sequestration capabilities at the stand level.
Although (regrettably) not the focus of their article, Chan et al. (2026) note that loss of the kauri tree also threatens biodiversity. Kauri strongly modify their environment through accumulation of a thick organic soil layer derived from litter. The layer is typically 30 to 50 centimeters deep but can reach 2 meters. These soils are acidic, drought-prone and nutrient-poor. As result the co-occurring plants comprise a unique suite of stress-tolerant plants. The vertical stratification of conifer and angiosperm crowns in kauri forests allows coexistence and unusually high total basal area of other plant species.
In these forests, kauri have dominated annual CO2 capture and long-term storage. Under pre-invasion conditions, Chan et al. (2026) this to continue. Previous work estimated that live vegetation biomass in kauri stands doubles when the stand moves from early- or mid-successional stages to mature. Three other species each contribute more than 10% of carbon storage: the tree fern Cyathea dealbata, and two small trees, Phyllocladus trichomanoides and Kunzea ericoides. All are early successional species that typically dominate in open or disturbed environments but decline as canopies close.
Chan et al. (2026) studied changes in live vegetation carbon stocks between two census periods ten years apart, 2011 – 2014 and 2021 – 2024. The five kauri-dominated plots included two plots each in early- and late-successional stages and one mid-successional stand. The study site was in the greater Auckland region of North Island. Phytophthora agathidicida is spreading through these forests, infecting kauri of all ages. Still, dieback intensity varies within the plots, so they were subdivided plots into 20 10 m × 10 m subplots.
Chan et al. (2026) tried to measure two distinct processes: the increase in carbon stocks coming from recruitment and growth of live stems (= productivity) and loss of sequestration and storage due to tree mortality. The two phenomena might respond differently to kauri dieback and initial carbon stocks. While increasing disease severity and increased mortality both result in lower net accumulation, it is important to disentangle the effects of increased loss, reduced productivity, or the combination.
kauri killed by dieback disease; 149 kauri dieback 02-868×1300
Findings
Carbon sequestration declined proportionately with increasing disease severity due to both reduced productivity and greater carbon loss from mortality. Because kauri contributed the largest share of carbon sequestration and storage due to the enormous size of some individuals, death of higher numbers of large kauri led to the largest reductions in these services. That is, the greatest observed decrease in carbon sequestration and storage was in those stands that initially had the highest levels of carbon storage. These were stands in mid- and late-successional subplots rather than in early-successional subplots. The higher the initial mean carbon stock level, the more pronounced the observed decline in sequestration.
This means that kauri dieback threatens both the carbon sequestration and long-term carbon storage capacity of kauri forests, particularly in mature stands comprising the largest trees.
Chan et al. (2026) conclude that the carbon stocks of these mature kauri stands will not stabilize until after substantial depletion of kauri biomass. As a result, long-term carbon storage capacity is markedly reduced.
Meanwhile, healthy kauri stands continued to sequester carbon as the trees grew. Chan et al. (2026) expect living kauri trees to continue adding to their basal area and other productive species can co-exist under the vertically stratified crowns.
In stands that had low carbon sequestration levels at the time of the first census (early successional stands), the stand maintained positive carbon sequestration until the disease reached a higher intensity. This was because some of the other tree species in the stand raised their proportional contributions to CO2 sequestration. Chan et al. (2026) concluded that these stands were likely stabilize at a reduced level of biomass, effectively lowering their long-term carbon storage and sequestration potential.
The steep decline in carbon sequestration and storage associated with higher initial carbon stocks reveal the disproportionate vulnerability of mature kauri stands. The kauri contribution to stand biomass is unlikely to be replaced by a structurally similar species, e.g., the long-lived, large conifer rimu (Dacrydium cupressinum), until passage of many years. Early-successional species are expected to colonize the damaged forests rapidly, but their lower wood densities and fast maturity/senescence confer limited carbon storage capacity.
a rimu tree; photo by F.T. Campbell
Besides, some of the species likely to replace (temporarily) dead kauri — Myrtaceae such as Kunzea ericoides — are susceptible to another introduced pathogen, myrtle rust (Austropuccinia psidii) (Lantham et al. 2025).
So kauri dieback not only reduces current carbon stocks but succession dynamics do not support future sequestration potential, leading to a long-term decline in the carbon storage capacity of these forests.
Chan et al. (2026) call for urgent efforts to prevent spread of the pathogen Phytophthora agathidicida and injection of phosphite to reduce disease symptoms. Both strategies should target mature kauri stands. Research on phosphite treatments is under way. They also suggest research on disease progression and associated changes in carbon stocks across multiple pools, including coarse and fine woody debris and deep organic soil layers.
Chan et al. (2026) report that the disproportionate contribution of large, long-lived individual trees to carbon storage is a worldwide phenomenon.
Extraneous thought: I am glad that Chan et al. (2026) cite examples of high-impact pathogens from the Southern Hemisphere, i.e., Phytophthora cinnamomi in Australia. While chestnut blight certainly had severe impacts, so have many others, e.g., white pine blister rustCronartium ribicola. Some arthropods have also proved damaging on several continents, including emerald ash borer (Agrilus plannipennis), or across widely separated island systems, e.g., Erythrinagall wasp (Quadrastichus erythrinae) and cycad scale (Aulacaspis yasumatsui). I regret that I can find no recent information on the scale.
SOURCES
Calders, K., H. Verbeeck, A. Burt, N. Origo, J. Nightingale, Y. Malhi, P. Wilkes, P. Raumonen, R.G.H. Bunce, M. Disney. Laser scanning reveals potential underestimation of biomass carbon in temperate forest. Ecol Solut Evid. 2022;3:e12197. wileyonlinelibrary.com/journal/eso3
Chan, P.J., T. Elliott, H.R. Lai, B. Burns, L. Schwendenmann. 2026. Consequences of a dieback disease on carbon stocks and fluxes in forests dominated by a susceptible foundation species. Plant Ecology (2026) 227:97 https://doi.org/10.1007/s11258-026-1669-4
Fei, S, R.S. Morin, C.M. Oswalt, and A.M. Liebhold. 2019. Biomass losses resulting from insect and disease invasions in US forests. Proceedings of the National Academy of Sciences. August 27, 2019 vol. 116 no. 35 www.pnas.org/cgi/doi/10.1073/pnas.1820601116
Latham, M.C., A. Lustig, N.M. Williams, A. McDonald, T. Patuawa, J. Chetham, S. Johnson, A. Carrington, W. Wood, and D.P. Anderson. 2025. Design of risk-based surveillance to demonstrate absence of Phytophthora agathidicida in NZ kauri forests. Biol. Invasions (2025) 27, no.26 https://doi.org/10.1007/s10530-024-03501-4
Quirion BR, Domke GM, Walters BF, Lovett GM, Fargione JE, Greenwood L, Serbesoff-King K, Randall JM and Fei S (2021) P&P Disturbances Correlate With Reduced Carbon Sequestration in Forests of the Contiguous US. Front. For. Glob. Change 4:716582. [Volume 4 Article 716582 doi: 10.3389/ffgc.2021.716582
Simpkins, C.E., P.J. Bellingham, K. Reihana, J.M.R. Brock, G.L.W. Perry. 2024. Evaluating the effects of two newly emerging plant pathogens on North Aotearoa-NZ forests using an individual-based model. Ecological Modelling, www.elsevier.com/locate/ecolmodel https://doi.org/10.1016/j.ecolmodel.2024.110938
Posted by Faith Campbell
We welcome comments that supplement or correct factual information, suggest new approaches, or promote thoughtful consideration. We post comments that disagree with us — but not those we judge to be not civil or inflammatory.
For a detailed discussion of the policies and practices that have allowed these pests to enter and spread – and that do not promote effective restoration strategies – review the Fading Forests report at http://treeimprovement.utk.edu/FadingForests.htm
Spathodea campanulata (one of the most common invasive plant species in moist or wet forests on Puerto Rico); photo by Annika Lindqvist via EasyScape
America’s Caribbean islands have received much less attention that Hawai`i with regard to either their biological importance or level of biological invasion. I posted a blog three years ago about invasive tree species. I rejoice that the silence might be starting to change – thanks in large part to Julissa Rojas-Sandoval.
The West Indies
The Caribbean islands – including but not limited to Puerto Rico and the U.S. Virgin Islands – are considered one of 35 global BD hotspots on Earth (Castro, Quinones, and Gould 2016; Zimmerman et al. 2021). The most comprehensive descriptions are a decade old. Castro, Quinones, and Gould (2016) report that the Caribbean islands are home to ~14,526 plant and terrestrial vertebrate species, half of which are endemic to the region. At that time more than 900 species were on the IUCN Red List. The West Indies are characterized by exceptionally high levels of plant endemism, with more than 70% of seed plants considered endemic to the region (Rojas-Sandoval et al. 2017, citing earlier floristic assessments).
The Caribbean islands have a long history of anthropogenic disturbance – especially since Europeans arrived in 1492 — and intentional or accidental introductions of non-native species. Available sources differ on the number of species that should be categorized as “invasive”.
Potteret al. (2022) report that 17% of the flora of the islands of the Caribbean archipelago are not native. Rojas-Sandoval et al. (2017) identified 516 invasive non-indigenous plant species, representing about 4% of the total West Indian flora, and concluded that the incidence of invasive plants in the region is high compared with other island groups. Interestingly, each island group has its own suite of invasive species. More than 60% of these taxa occur on a single island. Thirty-eight percent belong to one of three families — Fabaceae, Poaceae, and Asteraceae. Thirty-four families are represented by a single species; 78 families by fewer than five.
Leucaena lecocephala; photo by Agnieszka Kwiecien-Nova via WikiMedia
They report that the most widely distributed species is river tamarind, Leucaena leucocephala (Fabaceae); it occurs on all nine islands. Another seven species are found on seven of the islands: Casuarina equisetifolia (Casuarinaceae); Eichhornia crasssipes (Pontederiaceae); Megathyrsus maximus (Poaceae); Melaleuca quinquenervia (Myrtacea); Ricinus communis (Euphorbiaceae); Spathodea campanulata (Bignoniaceae), Terminalia catappa (Combretaceae).
The density of invasive plants per square kilometer varies considerably among the islands. The Virgin Islands (US and British) rank second highest at 0.245 / km2. Puerto Rico doesn’t stand out. As noted above, each island has a distinct invasive flora. The pair of islands which share the highest number of species (122) is Puerto Rico and the Virgin Islands (Rojas-Sandoval et al. 2017). I suggest it might be informative to explore whether these islands’ century-long ties to the United States influenced trade pathways and planting choices, thereby leading to this similarity.
Rojas-Sandoval et al. (2017) report that 31% of the invasive plants (162 species) are herbs; 20% (102 species) are trees; 16% (80 species) are shrubs; 15% (77 species) are grasses; 13% (67 species) are vines; 3% (15 species) are succulents; 2.5% (13 species) are aquatics. Three-quarters are perennials. These plants occur primarily in human-altered habitats: 98% (506 species) in ruderal areas; 61% (314 species) in seminatural areas; 35% (138 species) in agricultural areas. Only 5% (27 species) are found in mature forests.
Nineteen of the species are listed among the “world’s worst alien invasive species”. For example, six of the eight most widely distributed species (above) are invasive in Florida also.
Seventy-five percent of the invasive plant species have escaped from cultivation. According to Rojas-Sandoval et al. (2017), half of these were introduced as ornamentals; another third were introduced for various agriculture and forestry purposes. Finally, 7% were deliberately planted in natural ecosystems for some purpose such as erosion control. They suggest that repeated introduction of some of these species – especially the ornamentals – might increase propagule pressure and thus their probability of establishing.
Generalities About Biology on Puerto Rico
Puerto Rico is the smallest island of the Greater Antilles at ~ 9100 km2 (5,325 mi² / 1,379,000 ha) (Rojas-Sandoval, Presley, and Willig 2026). It is 39% forest, 32% grassland, 13% woodland and shrubland, 11% urban, 3% herbaceous wetlands, 1% forested wetlands, 1% inland water, < 1% natural barrens (Castro, Quinones, and Gould 2016).
Puerto Rico is relatively poor in species richness compared to mainland tropical areas. In one example, a plot in a Puerto Rican wet forest had half the number of freestanding woody species as a comparably-sized area in central Panama. Puerto Rico lacks large herbivores and predators. Still, Puerto Rico is much more diverse than other more isolated islands, e.g., the Hawaiian Islands (Zimmerman, Rojas-Sandoval, and Shiels 2021). There are 2,780 species of plants and 361 native vertebrates, including 277 birds, 52 reptiles, 19 amphibians, and 13 mammals (Castro, Quinones, and Gould 2016).
This biodiversity reflects the island’s highly varied topography – elevations range from sea level to 1338 m – and rainfall. Areas in the south and southwest receive ~800 mm while the high-elevation areas in the northeast are drenched by more than 4000 mm.
Unlike in most tropical areas, forests on Puerto Rico are regrowing due to abandonment of agriculture. Forest cover has increased from less than 6% in the 1950s to more than 55% by 2014. These regenerating forests contain a mixture of native and non-native species in a mosaic of forest at various stages of succession (Rojas-Sandoval, Presley, and Willig 2026). Potteret al. (2022) reported that two-thirds of Puerto Rico’s forests comprised novel tree assemblages.
Invasive species
A decade ago, Puerto Rico had 176 invasive plant species – 32% of the island’s flora. They comprised 44 herbs, 35 grasses, 33 trees, 28 vines, 19 shrubs, and 5 succulents. In this category, Puerto Rico ranks higher than other islands in the Greater Antilles e.g. Jamaica (21%), Dominican Republic (18%), and Cuba (12%) (Rojas-Sandoval et al. 2017; Rojas-Sandoval and Acevedo-Rodríguez 2015).
Three studies have addressed invasive species on “la Isla del Encanto”. They differ in in geographic scope, data, and study objectives.
Zimmerman, Rojas-Sandoval, and Shiels (2021) addressed biological invaders in all taxonomic groups, not just vascular plants. However, their analysis was limited geographically to the Caribbean National Forest (CNF; popularly known as El Yunque). This study was based on published literature, museum and herbarium collections, local and academic experts’ experience, and personal field observations. They concluded that there were some worrisome trends but no strong evidence that the National Forest’s ecosystem was in danger of fundamental change as a result of invasive species. However, they admit data were limited and called for systematic surveys and detailed studies. This need is particularly acute because of the ecological importance of El Yunque, which is one of the few (and the most important) remnants of original native forest on Puerto Rico.
Potter et al. (2022) relied on data collected as part of the USFS Forest Inventory and Analysis (FIA) survey. The survey evaluates 341 permanent plots every 5 years. They assessed trees (no other kinds of plants) in forested areas across the island, not just in the CNF. They usually attribute invasive trees’ prevalence largely to the land-use history, i.e., reforestation of formerly agricultural lands. These scientists emphasize the importance of recent land-use history in determining where non-native tree species occur. They do not offer an overall assessment of the trajectory of invasions.
A more recent analysis by Rojas-Sandoval, Presley, and Willig (2026) was also island-wide and included all woody plants with dbh ≥ 2.5 cm, i.e., trees and shrubs. Noting that invasion intensity is steadily increasing in Puerto Rico’s forests, they concluded that the threat to Puerto Rico’s native biological diversity is greater than did the earlier studies.
Relying on the FIA surveys has the advantage of providing statistically valid data. However, this survey has two drawbacks as regards assessing plant invasions. First, the FIA inventory data don’t evaluate species in the understory, i.e., herbs, small shrubs, or vines. These species might also alter long-term successional trajectories (Rojas-Sandoval, Presley, and Willig (2026). Second, the FIA inventory is not designed to detect even woody plant species in the early stage of invasion, i.e., those that occur only as small seedlings on a few inventory plots (Potter et al. 2022).
El Yunque
Invasive Plants
Zimmerman et al. (2021) report that 168 non-native plant species from 135 genera and 57 families are established in the National Forest – at varying levels from “naturalized” to fully invasive. Of these, 77 species (~46%) had previously been listed as invasive on Puerto Rico. Twelve were hangers-on from crops planted in the past (e.g., coffee, mango, and breadfruit). They considered most of these non-invasive because they hadn’t increased strongly during a 10-year study. They named one possible exception, Simarouba amara, a timber tree, which had increased in numbers in areas of less intense land use after hurricanes in late 1990s. However, this species has not been mentioned as problematic by any other study.
El Yunque (CNF) is home to 37 of the non-indigenous plant species, including 14 vines, nine herbs, and eight grasses. These plants are described as colonizing primarily disturbed areas (e.g., landslides), wastelands, river edges, and roadsides.
The non-native species present in the regrowing forests vary by forest type – as would be expected given the large differences in rainfall. In the subtropical dry forest the principal invasive plants are river tamarind (Leucaena leucocephala) and Prosopis juliflora (Rojas-Sandoval, Presley, and Willig (2026). The former is one of the most widespread and common of the highly invasive non-native tree species throughout the Caribbean. On Puerto Rico, L. leucocephala is documented on 12.6% of 294 forested plots, 40% of plots in this biome. P. pallida (algarroba) is recorded on 10.9% of all survey plots, 27.1% of plots in the biome. Invasions in the dry forest are sometimes arrested by chronic disturbance – presumably fire (Potter et al. 2022). However, the authors do not report which species – native or introduced – come in after the disturbance.
The subtropical moist forest is presumably the biome most affected by previous agricultural efforts. African tuliptree (Spathodea campanulata) occupies 41.8% of survey plots in this biome. Rose apple (Syzygium jambos) is found on 36.4% of these survey plots (Potter et al. 2022).
Invasive trees in the subtropical wet and rain forests biome included Erythrina poeppigiana and two species also found in the moist biome – Spathodea campanulate, and Syzygium jambos. S. campanulata is found on 33.9% of the plots in this biome (Potter et al. 2022). Zimmerman et al. (2021) call our attention to an herb, Selaginella willdenowii. They call this ornamental spikemoss one of most aggressive plant invaders in the CNF.
There is a difference of opinion on the threats posed by Spathodea campanulata. Potter et al. report that S. campanulata is found on 6.1% of all plots surveyed – half or less of plots invaded by the dryland species Leucaena leucocephala and Prosopis juliflora (and the S. campanulata plots are spread across two much larger biomes – moist and wet forests). S. campanulata is also shade intolerant so Potter et al. believe it might decline in the future as other species overtop it. The conflicting opinion is offered by Rojas-Sandoval, Presley, and Willig (2026). They call Spathodea campanulata a key driver of native biodiversity loss and homogenization in moist and wet forests. They note that the species has broad ecological tolerance and can proliferate after hurricanes. They found the species to already be significantly influencing native forest distinctiveness and composition – and to be increasing in abundance.
Potter et al. (2022) considered rose apple (Syzygium jambos) to pose a higher threat since it is shade tolerant and can form dense, monotypic stands under closed canopies – which S. campanulata cannot. Zimmerman, Rojas-Sandoval, and Shiels (2021) agree that where it occurs in areas of secondary forest near stream beds, S. jambos outcompetes other species. Rojas-Sandoval, Presley, and Willig (2026) note the species might potentially contribute to homogenizing biodiversity. A new development might counter this threat: the accidental introduction of guava/ohia rust (Austropuccinia psidii); it has been highly fatal to rose apple populations in Hawai`i. Both Zimmerman et al. and Rojas et al. mention this possibility but I have not seen a more recent discussion of whether this is occurring.
myrtle rust on Syzygium jambos; photo by Smallbiologie via Wikimedia
Zimmerman et al. (2021) say several invasive vines are established in El Yunque. The vines respond quickly to the disturbances caused by the region’s frequent hurricanes. Seven of the 14 species in the CNF are morning glories in the Ipomoea genus. Other locally abundant non-native vines are Epipremnum pinnatum, Pueraria phaseoloides, Dioscorea alata, Thunbergia alata, and Thunbergia fragrans.m
Potteret al. (2022) defined invasive tree species as those exhibiting 60 – 75% of stems in the “small” diameter categories (less than 12.5 cm dbh). Fifty-seven non-native tree species in old-growth and regenerating forests it this definition. They considered 17 of them as highly invasive, 16 as potentially highly invasive, and two as moderately invasive. That is, 35 of 57 nonnative tree species, or 60%, are actually or potentially bioinvaders. While on the continent only seven non-native tree species occurred on at least 2% of FIA plots across the ecoregions in which they were inventoried, on Puerto Rico 21 species (38%) occurred on at least 2% of the FIA plots. Potter et al. (2022) could not assess the invasiveness of eight additional species that occurred only as small stems on a couple of survey plots.
Potter et al. (2022) note the possibility of conflicting views about the invaders: some of the moderately to highly invasive species provide timber and non-timber forest products. These include S.campanulata, L. leucocephala, Syzgium jambos, and Mangifera indica (mango).
Rojas-Sandoval, Presley, and Willig (2026) also analyzed FIA data to assess how non-native tree species affect the biodiversity and composition in three forest types: dry, moist, and wet forests. Unlike Potter et al. (2022), they found that non-native tree species are reshaping native tree assemblages in Puerto Rican forests, leading to significant declines in native species abundance, richness, evenness, and diversity.
The transformation is greatest in the dry forest; there, native richness has declined by more than 90% by some measures. Native communities have become depauperate, dominated by a few species. In subtropical moist forest, native richness peaked at low to moderate invasion levels, then declined. S. campanulata is the dominant non-native species; as noted above, it is found on 41.8% of survey plots in this biome. In subtropical wet forests, native species richness and diversity were highest in uninvaded and lightly invaded plots, followed by marked declines at higher levels of invasion. This is largely driven by that one species, S. campanulata (found on a third of the survey plots in this biome).
The dry forest suffered the greatest proportional loss of biodiversity, including the largest proportional declines in native species richness. Wet forests also experienced strong declines in native richness & abundance. However, since wet forests had much higher initial diversity & structural complexity, their proportional decline in biodiversity is less. Thus, invasion effects differ among forest types depending on initial diversity, resource availability, land-use history, successional stage, and community composition.
Invasion can make individual plots diverge locally through loss of some rare species or gain of different non-native species. If this happens across the study site, the compositional heterogeneity at broader scales is simultaneously reduced. This results in landscape-level biotic homogenization.
Rojas-Sandoval, Presley, and Willig (2026) say homogenization effects are particularly concerning in insular ecosystems, where high endemism and ecological specialization make native biotas especially vulnerable to displacement.
To their surprise, the key driver on Puerto Rico is the increasing abundance of the non-native trees, rather than non-native species richness (Rojas-Sandoval, Presley, and Willig. 2026).
RECOMMENDATIONS
Potteret al. (2022) advise limited efforts to eradicate or control the eight species that occurred only as small stems on a couple of survey plots. These are probably incipient invasives. They name specifically Schinus terebinthifolius (Brazilian pepper) – a species already recognized as moderately invasive in Hawai`i and seriously invasive in peninsular Florida. In 2019 USDA APHIS approved release of two biocontrol insects in Florida targetting Brazilian pepper.
infestation of Brazilian pepper in the Florida Everglades; photo courtesy of Tony Pernas, National Park Service
I recommend that, in order to avoid having to consider importing those biocontrol agents to Puerto Rico, island conservation stakeholders should focus eradication efforts on this species now while it is still – apparently – not widespread.
Rojas-Sandoval, Presley, and Willig (2026) are bolder. They call for implementation of more effective policies to prevent additional introductions and spread of the invasives already on Puerto Rico or nearby islands. They suggest that officials focus on the species named in their dataset. In addition, scientists should also collect data on understory dynamics to get a more comprehensive assessment of bioinvasion in the forest. Rojas-Sandoval et al. (2026) also urge implementation of policies aimed at reducing anthropogenic disturbances in these fragile ecosystems. One component of this program is for those responsible for forest management, conservation, and climate adaptation to incorporate invasion dynamics into their strategies. They remind us that Caribbean islands host extraordinary species richness – many of which are endemic. So protecting these biological riches is of global importance.
Preventing anthropogenic disturbance is likely to aid control of invasive plants. Zimmerman et al. (2021) found that the better-protected forests of the Caribbean National Forest was less invaded by vascular plants than were similar areas that had higher levels of human disturbance. However, this was not the case regarding invasive mammals and some invertebrates. Other than the passing reference to Austropuccinia psidii on Syzygium jambos, none of the studies considered pests or pathogens hosted by trees or other plants.
Other Taxa
Zimmerman et al. (2021) also evaluated invasive animal species. They report that six species of vertebrates are invasive in Caribbean National Forest. Black rats (Rattus rattus), mongoose (Herpestes auropunctatus), and feral cats (Felis catus) are widespread through both disturbed and undisturbed mature forest. Each threatens many native species. The black rat also preys on seeds of several native tree species. House mouse (Mus musculus) is also very common, but restricted to roadside habitats. Cane toad (Rhinella marina) and green iguana (Iguana iguana) are also present. The green iguanas was introduced relatively recently and is rarely observed in CNF. Cane toads have been established much longer. Zimmerman et al. (2021) report no impacts.
Surprisingly, they report no introduced bird or fish species in El Yunque, even the species are common on the island and in parts of the Forest having a history of anthropogenic disturbance.
Two invertebrate bioinvaders are reported as ubiquitous in the National Forest: a hybrid honeybee and Aedes aegypti mosquito. The Africanized honeybee has evolved gentle behaviors and is no longer a great threat to cavity nesting birds, including the endangered Puerto Rico Parrot (Amazona vittata). Two species of introduced earthworms, Pontoscolex corethrurus and Ocnerodrilus occidentalis, are widespread in El Yunque; a third, Drawida barwelli, is found only in lower-elevation forest areas outside NF. The earthworms alter biogeochemical cycling in the soil, which might further influence plant community dynamics. Non-native slugs and snails do not appear to be spreading rapidly or damaging native plant species. Zimmerman, Rojas-Sandoval, and Shiels (2021) warn that additional invertebrates might be of concern in the future, since they can expand rapidly after forest destructions caused by hurricanes.
See also the brief summary of invasive species on Puerto Rico included in the Regional Summary Appendix for the Southeast in Poland et al. (2019). I note mentions of the South American Harrisia cactus mealybug (Hypogeococcus pungens, which is killing columnar cacti in the islands’ dry forests.
SOURCES
Lugo, A.E., J.E. Smith, K.M. Potter, H. Marcano Vega, C.M. Kurtz. 2022. The Contribution of Non-native Tree Species to the Structure and Composition of Forests in the Conterminous United States in Comparison with Tropical Islands in the Pacific and Caribbean. USFS International Institute of Tropical Forestry General Technical Report IITF-54.
Poland, T.M., Patel-Weynand, T., Finch, D., Miniat, C. F., and Lopez, V. (Eds) (2019), Invasive Species in Forests and Grasslands of the United States: A Comprehensive Science Synthesis for the United States Forest Sector. Especially the Appendix on the Southeast and Caribbean. Springer Verlag. Available gratis at https://link.springer.com/book/10.1007/978-3-030-45367-1
Potter K.M., Riitters, K.H. and Guo. Q. 2022. Non-native tree regeneration indicates regional and national risks from current invasions. Frontiers in Forests and Global Change Front. For. Glob. Change 5:966407. doi: 10.3389/ffgc.2022.966407
Rojas-Sandoval, J., R.L. Tremblay, P. Acevedo-Rodriquez, H.D. Soltero. 2017. IAS plant species in the West Indies: geog, ecological and floristic insights. Ecology and Evolution 2017; 1-12
Rojas-Sandoval, J., Presley, S.J. and Willig, M.R. 2026. Increasing non‑native tree abundance reshapes biodiversity and composition of tropical forests. Biol Invasions28, 84 (2026). https://doi.org/10.1007/s10530-026-03802-w
Zimmerman, J.K., J. Rojas-Sandoval, and A.B. Shiels. 2021. IAS in PR: The View From El Yunque. Front. Ecol. Evol. 9:640121. doi: 10.3389/fevo.2021.640121
Posted by Faith Campbell
We welcome comments that supplement or correct factual information, suggest new approaches, or promote thoughtful consideration. We post comments that disagree with us — but not those we judge to be not civil or inflammatory.
For a detailed discussion of the policies and practices that have allowed these pests to enter and spread – and that do not promote effective restoration strategies – review the Fading Forests report at http://treeimprovement.utk.edu/FadingForests.htm